General Relativistic Flux Modulations from Disk Instabilities in Sagittarius A*
Abstract
Near-IR and X-ray flares have been detected from the supermassive black hole Sgr A* at the center of our Galaxy with a (quasi)-period of minutes, suggesting an emission region only a few Schwarzschild radii above the event horizon. The latest X-ray flare, detected with XMM-Newton, is notable for its detailed lightcurve, yielding not only the highest quality period thus far, but also important structure reflecting the geometry of the emitting region. Recent MHD simulations of Sgr A*’s disk have demonstrated the growth of a Rossby wave instability, that enhances the accretion rate for several hours, possibly accounting for the observed flares. In this Letter, we carry out ray-tracing calculations in a Schwarzschild metric to determine as accurately as possible the lightcurve produced by general relativistic effects during such a disruption. We find that the Rossby wave induced spiral pattern in the disk is an excellent fit to the data, implying a disk inclination angle of . Note, however, that if this association is correct, the observed period is not due to the underlying Keplerian motion but, rather, to the pattern speed. The favorable comparison between the observed and simulated lightcurves provides important additional evidence that the flares are produced in Sgr A*’s inner disk.
Subject headings:
accretion—black hole—Galaxy: center—instabilities—magnetohydrodynamics—relativity1. Introduction
Long-term monitoring of Sgr A* has thus far resulted in the discovery of several near-IR (Genzel et al., 2003) and X-ray flares (Baganoff et al., 2001) from this object. One of the most recent events, observed with XMM-Newton in 2004, has produced compelling evidence of a significant modulation in the X-ray lightcurve with a quasi-period minutes (Bélanger et al., 2006). Similar periodic fluctuations had also been seen earlier in the near-IR events.
A period of minutes is rather intriguing because simple considerations (Melia, 2001) would place the corresponding emission region at roughly 3 Schwarzschild radii () for a black hole (BH) mass of M⊙ (Schödel et al., 2003). It is not yet understood, however, why the Keplerian radius corresponding to this period is actually less than . It could be that the difference is due to the spin of the BH, which moves the inner disk radius inwards for prograde rotation. Or it could be that the so-called stress edge—the location where the inspiralling material actually detaches from the rest of the magnetized disk—is dynamically important in establishing where the disk emission terminates (Krolik & Hawley, 2002; Melia et al., 2007).
Part of the uncertainty is due to the fact that the structure of the disk surrounding Sgr A* is itself not fully understood yet. We have recently begun to simulate the behavior of the hot, magnetized disk during a disruptive event that may be responsible for the flares, under the assumption that the instability is induced by low angular momentum clumps of plasma “raining” inwards towards the Keplerian region (Tagger & Melia 2006; see also Chan et al. 2006). This scenario is motivated by extensive hydrodynamic (Melia & Coker, 1999; Cuadra et al., 2005) and MHD (Igumenshchev & Narayan, 2002) simulations which show that for the stellar-wind fed conditions at the Galactic center, the average specific angular momentum of gas captured gravitationally by Sgr A* is too small to sustain a ‘conventional’ (i.e., typically large ) disk. Instead, only clumps of plasma with relatively small angular momentum venture inwards and merge with—essentially, ‘rain’ onto—the compact disk at the circularization radius, which for Sgr A* is (see also Melia & Falcke, 2001; Melia, 2007).
These MHD simulations (Tagger & Melia, 2006) did indeed establish the result that the merger of an infalling blob with the existing Keplerian flow induces a Rossby wave instability (RWI) leading to the total disruption of the disk on a timescale relevant to the Sgr A* flare phenomenon. But unless the ensuing X-ray modulation is due to a QPO response in the inspiralling matter (see Chan et al. 2006), one cannot escape the fact that general-relativistic effects are essential in producing a periodicity in the lightcurve due to radiation by an azimuthally asymmetric emitter. The pattern of modulation over one complete cycle would be the result of several influences, including a Doppler shift, light-bending, and lensing effect near the BH’s event horizon (e.g., Hollywood et al., 1995).
In this Letter, we take the results from the (non-relativistic) MHD simulation of Tagger & Melia (2006) and carry out a full ray-tracing calculation of the lightcurve produced by the disruption for direct comparison with the XMM-Newton data.
2. Observed Lightcurve of an X-ray flare from Sgr A*
An inspection of Fig. 5 in Bélanger et al. (2006) shows that the effects of gravitational light-bending, lensing, Doppler effect and travel time delay may have helped to shape the folded lightcurves from the 2004 August 31 event. One cannot yet discount the possibility that an actual periodic dynamical effect may have also contributed to the modulation seen in the emissivity, but this is necessarily model-dependent and the signature may not be unique. For example, Tagger & Melia (2006) found that a quasi-periodic modulation could be excited by non-linearities in the evolution of the spiral-Rossby pattern, which would sit on top of the modulation one would see due to general relativistic effects. For the purposes of this Letter, we will adopt the simplest assumption—that the modulation is due predominantly to general relativistic effects.
The 2–10 keV folded curve from the 2004 August 31 event (see Fig. 3) looks broader and, except for one significant datum standing well away from the rest, looks more like a continuous, relatively smooth modulation rather than the sharp changing profile produced by an orbiting hot spot (see e.g., Hollywood et al., 1995). It is partially for this (phenomenological) reason that the Rossby wave instability is promising and worth investigating further here, because the disruption it causes is global, offering the possibility of producing a gradual modulation in the lightcurve when general relativistic effects are included.
3. Numerical Simulation of the Instability
The instability we have simulated with our MHD code has a long history, dating back to Lovelace & Hohlfeld (1978), who showed that a disk presenting an extremum of a quantity (later dubbed vortensity) was subject to a local instability of Rossby vortices. The requirement of an extremum is similar to that giving rise to the Kelvin-Helmholtz instability of sheared flows. More recently, Lovelace et al. (1999) renamed it the Rossby Wave Instability (RWI) and developed the theory and numerical simulation.
In isothermal, unmagnetized disks, is the specific vorticity averaged across the disk thickness,
| (1) |
where is the disk’s surface density, its rotation frequency, and is the epicyclic frequency squared. The extremum of appears to be due to an extremum in the radial density profile. To understand how the instability is driven, we note that Rossby waves in disks form normal modes trapped near the extremum of . In the MHD form of the RWI, the disk is threaded by a vertical (poloidal) magnetic field . Its properties are essentially the same as those discussed above, except that here the critical quantity is and the growth rate can be higher because of the long-range action of the Lorentz force coupling the Rossby vortices.
4. Ray Tracing Calculations
A typical profile of the inner disk during the Rossby wave growth is shown in Fig. 3 of Tagger & Melia (2006). In this paper, we present the lightcurve and images associated with this disruption, from the vantage point of an observer at infinity. The calculation is carried out with a fully general relativistic ray-tracing code. The RWI arises in the compact accretion disk surrounding the (Schwarzschild) BH, and we describe its morphology using coordinates in the co-rotating frame (). The modeled accretion disk is thin and the RWI may be considered to lie in the equatorial plane () of the compact object. The observer is located at infinity with viewing angle i relative to the -axis in the non-rotating frame, at (observer) polar coordinates (). The deflection angle of a photon emitted by plasma in the Rossby-unstable region is , and varies periodically with .
These emitted photons are deflected by the BH and intersect the observer’s detector plane at infinity. The distance between the line-of-sight and the point at which the photon reaches the detector is defined as the impact parameter b. Using this geometry, the deflection angle of the photon’s trajectory may be obtained with the light-bending relation between (the angle between the emission direction of the photon and the direction from the center of the BH to the location of the emitter) and from the geodesic equation
| (2) |
This procedure yields the impact parameter of the photons in terms of the emitting radius , and ultimately allows us to calculate the flux at infinity. A detailed description of this geometry is provided in, e.g., Luminet (1979), and Falanga et al. (2007). In our derivation, we shall use the same notation and geometry described in Poutanen & Gierliński (2003), though pertaining to a localized region (or clump) in the disk. The system of units is chosen such that ; in this standard coordinate system, the BH’s horizon occurs at the Schwarzschild radius , where is the mass of the compact object.
In the simulations we report here, the emitting region is geometrically thin, and generally optically thin as well. Our rays include an integration through the whole emitting depth, but because most of the emissivity is concentrated near the disk’s plane, we effectively have a situation in which the rays themselves appear to begin very close to this plane. Rays leaving the disk in directions that eventually take them around the BH, heading toward the observer, contribute much less to the overall flux and we ignore them here.
The general-relativistic effects to be considered are now: (i) light-bending (see above), (ii) gravitational Doppler effect defined as (1+z), (iii) gravitational lensing effect, (with the distance to the source), expressed through the impact parameter, and (iv) the travel time delay. We calculate the relative time delay between photons arriving at the observer from different parts of the disk, using the geodesic equation. The first photon reaching the observer is the photon emitted at phase , on the closest radius () to the observer. We set this reference time, , equal to zero.
The observed flux at energy is , where is the radiation intensity observed at infinity and is the solid angle on the observer’s sky including relativistic effects. Using the relation , a Lorentz invariant quantity that is constant along null geodesics in vacuum, the intensity of a light source integrated over its effective energy range is proportional to the fourth power of the redshift factor, , being the intensity measured in the rest frame of the clump (Misner, Thorne, & Wheeler, 1973).
Although our magnetohydrodynamic simulation, and corresponding ray-tracing calculation, are quite sophisticated, they are nonetheless still somewhat restricted in that we have not allowed for a completely self-consistent coupling between the plasma and the radiation. The infalling plasma radiates inefficiently, so this is not a serious deficiency as far as the dynamics is concerned. Furthermore, properly modelling the compression of the gas would require fully 3-D simulations, which MHD codes are still unable to handle in the conditions (a disk threaded by a near-equipartition vertical field) that we use. For simplicity, the MHD simulation was thus carried out assuming isothermal conditions. However the electron temperature, which dominates the radiative emission, responds to the compression of the gas and we model this here with an ad-hoc prescription, from the compression obtained in the simulation. This is sufficient to provide the main result of the present work, which is the form of the light curve that the spiral pattern and general relativistic effects generate. Also, we have not included non-local effects arising, e.g., from inverse Compton scattering. In determining the surface emissivity, it therefore makes sense to take a simplified approach in which we include principally the parameter scalings, rather than their absolute values. This procedure will give us correct amplitudes in the lightcurve, though not the absolute value of the flux per se.
Using the perfect gas law for an adiabatic flow (since the gas is radiatively inefficient), we can invoke a polytropic equation of state with and write the temperature as . This assumes further that the radiation pressure is negligible and is not so high that the particles are strongly relativistic. Although the disk is not in full hydrostatic equilibrium, we can still argue that on average, we should have for a steady thin disk the gas density , where is the column density, and is the disk height. These give (using to denote the radius in the equatorial plane) and . The synchrotron emissivity is therefore , where the nonthermal particle energy is roughly in equipartition with the thermal. We argue that the plasma is fully ionized and resistivity is minimal, so is frozen into the gas, which means that . We therefore infer that .
Now the X-rays are produced via inverse Compton scattering from the seed photon number flux. Thus, with , where is the synchrotron emissivity in units of energy per unit volume per unit time, the soft photon flux scales as the emitted power divided by the characteristic area. That is, , which is going to be roughly the same scaling as the seed photon density, so . The inverse Compton scattering emissivity is therefore . Thus, , and the surface intensity is , which gives finally . The core physics in this expression is the surface density , which we take from the MHD simulation in Tagger & Melia (2006).
In order to evaluate the flux at a given azimuthal angle and radius , we first compute numerically , and then calculate the Dopper shift, lensing effects, and finally the flux as a function of the arrival time, including all the travel time delays described above. The simulation is carried out on a polar grid with and points, extending from to . In this pass through the problem, in order to clearly separate the general relativistic modulation from the complex dynamical behaviour observed during the simulation, we have chosen to take a representative snapshot and rotate it at the frequency measured in the simulation. A full treatment of the whole simulation will be presented in Falanga et al. (2007).

5. Results and Discussion
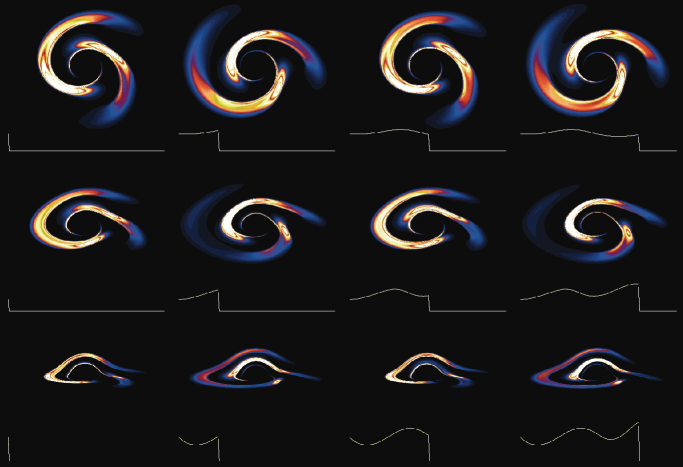
Our principal results are presented graphically below, and may be understood with reference to the simulated images shown in Fig. 1. These are intensity maps projected onto the plane of the sky, for the ray-traced perturbed disk in Tagger & Melia (2006), at three different inclination angles: in the top row, in the middle, and for the bottom row. The four columns are snapshots taken at 4 (equally-spaced) phases of one complete pattern revolution. The general relativistic distortions depend strongly on inclination angle, which we employ in our search for the best fit to the modulation in the X-ray lightcurve.
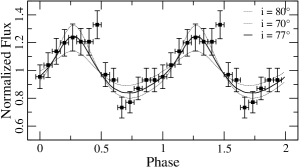
This variation is demonstrated quantitatively in Fig. 2, which shows the lightcurves corresponding to the three inclinations illustrated in Fig. 1. Note that at small inclination, we detect a gradual, broad modulation, whereas for the higher inclinations, we begin to see the effects of a two-spiral arm emitting region. Interestingly, the period associated with the pattern rotation in the Tagger & Melia (2006) simulation is about 50 minutes. Though this calculation was not optimized to fit the observed period, the fact that we see a bimodal modulation from the two spiral arms suggests that one cycle in the data may in fact correspond to half a revolution of the pattern. In this figure, we therefore also show the calculated lightcurve folded over half a pattern period, corresponding to about 25 minutes.
The true test of relevance for this simulation lies in a direct comparison between the data and the inclination-dependent lightcurves. We emphasized in the introduction that the various relativistic effects produce a unique profile, not easily confused with other periodic modulations, most of which tend to be sinusoidal. As we demonstrate in Fig. 3, the shape of the calculated lightcurve, particularly its amplitude, is quite sensitive to the inclination angle, which again, is most easily understood with reference to Fig. 1. For example, this figure includes 3 curves, corresponding to inclinations of , , and . The middle curve produces the best fit (), and it should be noted that the correspondence to the data is excellent, not only in terms of the modulation amplitude, but also for the shape of the lightcurve itself. Note that the simulated lightcurve corresponds to the bolometric flux emission. We have therefore compared the theoretical curve with the observed 2–10 keV lightcurve, rather than individually in different energy bands, as presented in Bélanger et al. (2006).
There are several new ideas that we can take away from this work. First, if the periodic modulation seen in some flares from Sgr A* by both IR and X-ray instruments is real, it is not at all obvious that the periodicity is due to an underlying Keplerian period. One must be very careful, therefore, in over-interpreting these periods in terms of a BH spin. Second, the shape of the X-ray lightcurve in this particular flare is too broad for it to correspond easily to a highly localized hot spot on the disk, which instead would produce a more strongly peaked profile like that investigated earlier by Hollywood et al. (1995). Instead, our work here argues for a more global disruption in the disk, at least for some events, like the 2004, August 31 flare observed with XMM-Newton. In this regard, the driving mechanism is likely to be an infall of clumps of plasma that merge with the existing compact disk and induce a Rossby-type of instability. Finally, the observed power density spectrum shows that the (quasi)-period is quite clean, without any evidence that the emission region is spread over a large range in Keplerian periods. This has been taken as some evidence that the disturbance must therefore be highly localized, probably near the marginally stable orbit. But as we have shown here, the disturbance need not be that close to the event horizon in order to produce a modulation with a period of only minutes. One may still get a narrow peak in the power density spectrum, as long as the modulation is due to a pattern rotation, rather than to motion along an orbit. But this will only work as long as the pattern has multiple components, such as the two spiral arms we have modeled in this paper.
References
- Baganoff et al. (2001) Baganoff, F. et al. 2001, Nature, 413, 45
- Bélanger et al. (2006) Bélanger, G. et al. 2006. ApJ (Letters), submitted (astro-ph/0604337)
- Chan et al. (2006) Chan, C., Liu, S., Fryer, C. L., et al. 2006, ApJ, submitted (astro-ph/0611269
- Cuadra et al. (2005) Cuadra, J., Nayakshin, S., Springel, V. & Di Matteo, T. 2005, MNRAS, 360, L55
- Falanga et al. (2007) Falanga et al., ApJ, 2007, in preparation
- Genzel et al. (2003) Genzel, R. et al. 2003, Nature, 425, 934
- Hollywood et al. (1995) Hollywood, J. M., Melia, F., Close, L. M., et al. 1995, ApJ, 448, L21
- Igumenshchev & Narayan (2002) Igumenshchev, I.V. & Narayan, R. 2002, ApJ, 566, 137
- Krolik & Hawley (2002) Krolik, J. H. & Hawley, J. F. 2002, ApJ, 573, 754
- Lovelace & Hohlfeld (1978) Lovelace, R. V. E., & Hohlfeld, R. G. 1978, ApJ, 221, 51
- Lovelace et al. (1999) Lovelace, R. V. E., Li, H., Colgate, S. A., Nelson, A. F. 1999, ApJ, 513, 805
- Luminet (1979) Luminet, J., -P. 1979, A&A, 75, 228
- Melia (2001) Melia, F. 2001, Nature, 413, 25
- Melia (2007) Melia, F. 2007, in The Galactic Supermassive Black Hole (PUP: New York)
- Melia & Coker (1999) Melia, F. & Coker, R.F. 1999, ApJ, 511, 750
- Melia & Falcke (2001) Melia, F. & Falcke, H. 2001, ARAA, 39, 309
- Melia et al. (2007) Melia, F., Prescher, M., Bélanger, G. & Goldwurm, A. 2007, ApJL, submitted
- Misner, Thorne, & Wheeler (1973) Misner, C. W., Thorne, K., S., & Wheeler, J., A. 1973, Gravitation (San Francisco: Freeman)
- Poutanen & Gierliński (2003) Poutanen, J., & Gierliński, M. 2003, MNRAS, 343, 1301
- Schödel et al. (2003) Schödel, R., Ott, R., Genzel, R., Eckart, A., Mouawad, N., & Alexander, T. 2003, ApJ, 596, 1015
- Tagger & Melia (2006) Tagger, M.& Melia, F. 2006, ApJ, 636, L33