Cascading on extragalactic background light
Abstract
Context. High-energy -rays propagating in the intergalactic medium can interact with background infrared photons to produce pairs, resulting in the absorption of the intrinsic -ray spectrum. TeV observations of the distant blazar 1ES 1101-232 were thus recently used to put an upper limit on the infrared extragalactic background light density.
Aims. The created pairs can upscatter background photons to high energies, which in turn may pair produce, thereby initiating a cascade. The pairs diffuse on the extragalactic magnetic field (EMF) and cascade emission has been suggested as a means for measuring its intensity. Limits on the IR background and EMF are reconsidered taking into account cascade emissions.
Methods. The cascade equations are solved numerically. Assuming a power-law intrinsic spectrum, the observed 100 MeV - 100 TeV spectrum is found as a function of the intrinsic spectral index and the intensity of the EMF.
Results. Cascades emit mainly at or below . The observed TeV spectrum appears softer than for pure absorption when cascade emission is taken into account. The upper limit on the IR photon background is found to be robust. Inversely, the intrinsic spectra needed to fit the TeV data are uncomfortably hard when cascade emission makes a significant contribution to the observed spectrum. An EMF intensity around nG leads to a characteristic spectral hump in the GLAST band. Higher EMF intensities divert the pairs away from the line-of-sight and the cascade contribution to the spectrum becomes negligible.
Key Words.:
Radiation mechanisms: non-thermal – BL Lacertae objects: individual: 1ES 1101-232 – intergalactic medium – diffuse radiation – Gamma rays: observations1 Introduction
The observed very high energy (VHE) spectra of extragalactic sources are attenuated by pair production (PP) on background photon fields. At energies , interactions with CMB photons make the universe opaque beyond a few Mpc (Gould & Schréder 1966). In the 1-10 TeV range, the target photon field is the infrared extragalactic background light (EBL), with an undetermined horizon due to uncertainties in the EBL density at optical to UV wavelengths. Conversely, observations of absorbed VHE spectra of blazars can constrain the EBL density at these wavelengths, provided their intrinsic emission is known (Stecker et al. 1992; Biller 1995). Recently, the HESS collaboration used its observations of 1ES 1101-232 (), together with a reasonable assumption on the intrinsic spectrum, to estimate a stringent upper limit to the EBL (Aharonian et al. 2006). This estimation did not consider emission from the cascade initiated when the created pairs upscatter EBL photons back to VHE energies (Protheroe 1986; Protheroe & Stanev 1993; Aharonian et al. 1994; Biller 1995; Aharonian et al. 2002). Cascade emission may make the universe appear more transparent than under the assumption of pure absorption. Inversely, including cascade emission when deconvolving for propagation effects on a given EBL leads to intrinsic spectra different from the pure absorption case.
The impact of this emission on the EBL upper limit, as derived from the 1ES 1101-232 spectrum, is considered here. Electrons may diffuse on the extragalactic magnetic field (EMF), causing their emissions to be lost for the observer (Protheroe 1986; Aharonian et al. 1994; Plaga 1995). The EBL and EMF governing the propagation of the cascade are described in §2. The cascade equations and numerical method are described in §3 and applied to the case of 1ES 1101-232 in §4. The implications on the EBL and EMF limits are set out in §5.
2 Extragalactic backgrounds
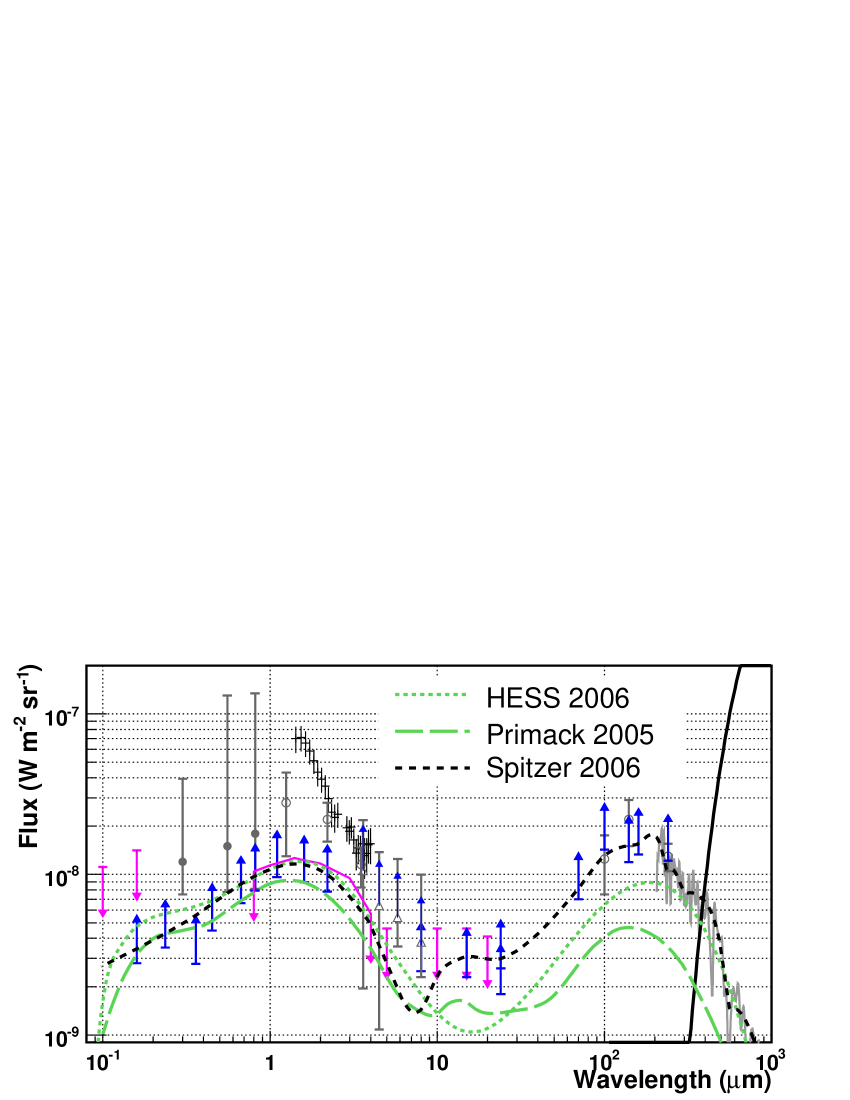
In addition to the CMB, the diffuse photon background is constituted of integrated emission from stars (peaking around , see Fig. 1) and heated dust (peaking around ). The EBL spectral energy distribution is difficult to measure directly because of the strong zodiacal and galactic foregrounds. Lower limits have been set using source counts while SED shapes have been derived from simulations of galaxy formation (Primack 2002; Lagache et al. 2003; Xu et al. 2001). The EBL shape HESS 2006 (Fig. 1) was computed by Primack et al. (1999) and normalised by a factor 0.45 in Aharonian et al. (2006) to account for the TeV observations of 1ES 1101-232. Primack 2005 refers to an EBL normalised instead to fit the lower limit set by galaxy counts. The Spitzer observations suggest higher fluxes in the range (Dole et al. 2006). This affects attenuation above 20 TeV but has been verified to have no consequence on the results presented here.
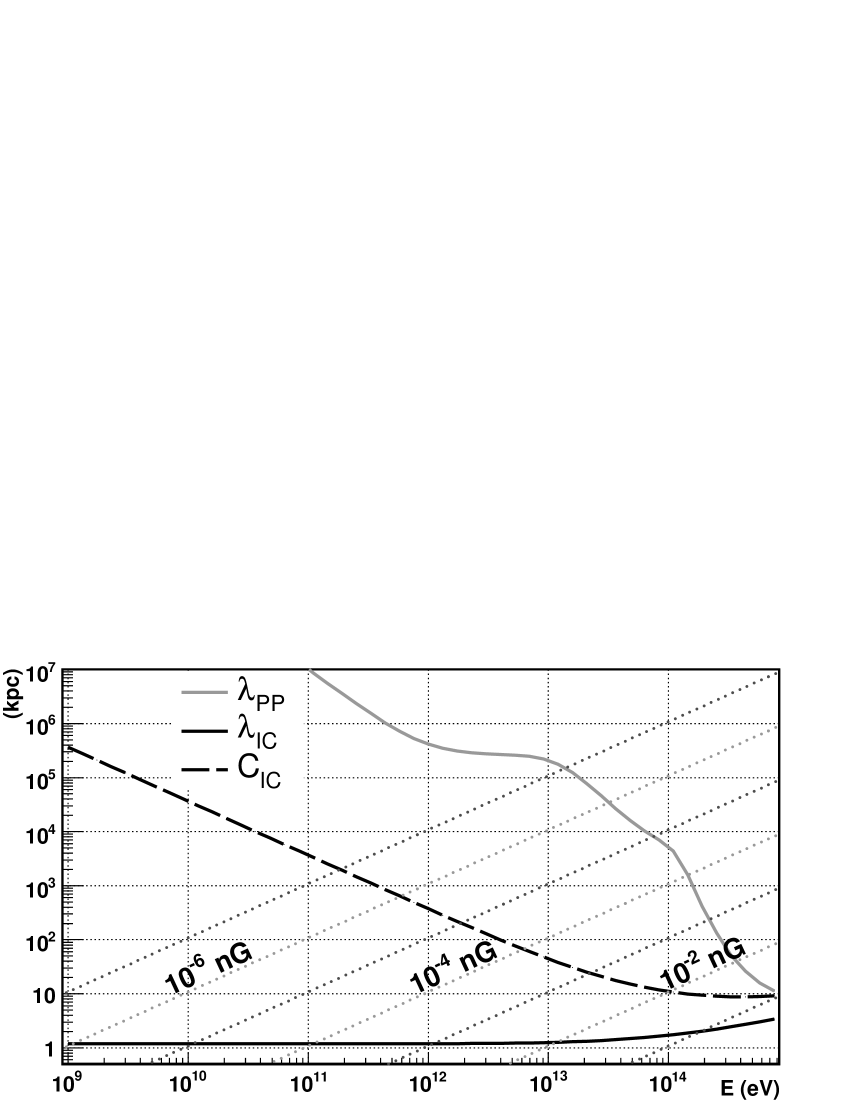
The created pairs can be deflected from the line-of-sight by an extragalactic magnetic field (EMF). Faraday rotation and synchrotron emission in radio yield estimates of magnetic fields in galaxies (roughly ), or in clusters () and even some super- clusters () (Kronberg 1994; Widrow 2002; Vallée 2004). The EMF outside these structures is unconstrained and may be as low as (Fan et al. 2003, and references therein). For such very weak EMFs, the deflection of electrons due to IC interactions is negligible and the cascade occurs along the line-of-sight with a short delay of the secondary emission (Plaga 1995; Cheng & Cheng 1996; Dai et al. 2002). Diffusion on a stronger EMF creates a halo around -ray sources and isotropizes the cascade emission (Aharonian et al. 1994). This occurs when the gyroradius of the pairs is much lower than their Compton cooling length . Since mostly CMB photons are upscattered, the minimum required to isotropise pairs of energy is . Much of the isotropic re-emission is lost to the observer and the pairs diffuse on a scale . For intermediate EMFs, the TeV electrons in the beamed relativistic jet are deflected by . Halo sizes could be resolved by -ray detectors and used to estimate the EMF intensity (Neronov & Semikoz 2006). Photons in 0.1∘ haloes have propagation times varying by years, averaging out any time variability (Fan et al. 2003). In the following, the cascade emission is assumed to be unresolved from the source and delays are not considered. The TeV emission detected by HESS from 1ES 1101-232 appears to be at a low flux level with no significant variability.
3 Cascade equations
The cascade is described by a set of two coupled equations involving the photon energy density and the electron (positron) energy density :
| (1) | ||||
| (2) | ||||
The first term in both equations is the sink term due to PP (Eq. 1) or IC losses (Eq. 2). and are the mean free path for each interaction. The second term is the source term corresponding to cascade emission (Eq. 1) or pair creation (Eq. 2, with a factor 2 for the pair). The cascade emission factor is when the EMF is ignored, and approximated to 0 when the electron population is considered isotropised. The pair production term is written in terms of , where is the differential cross-section and is the photon background energy density (EBL+CMB). The IC radiation term is defined similarly. The third term in Eq. 2 reflects IC cooling of electrons from higher energies. All of these terms are functions of .
The integrated cross-sections for PP and IC on isotropic target photons are taken from Gould & Schréder (1966) and Jones (1967). Analytic expressions of the differential cross- sections derived by Zdziarski (1988) for background densities in the form of blackbodies or power laws are used to calculate and . The cascade equations are solved numerically by combining and into a single vector defined on a logarithmic scale of energies , from =107 eV up to 1017 eV in 250 steps (Thus ). To ensure energy conservation, the integrals on and are calculated as
| (3) |
The cascade equations may then be rewritten as a matrix acting on the vector : ( is developed to the order in ). The terms in are of the order of or less, hence it is enough to take steps of size , updating the matrix every with and values for , and taken from WMAP (Peiris et al. 2003). Thus, at , .
4 Application to 1ES 1101-232
The SED of the attenuating EBL can be deconvolved from -ray observations of extragalactic sources (TeV blazars), given a priori knowledge on the intrinsic spectra. Modelling observed spectra as power-laws, the effect of PP is to soften the intrinsic spectral index, increasingly so with EBL intensity. Hence, using observations of the farthest TeV blazar and assuming the hardest possible intrinsic spectrum puts an upper limit on the EBL responsible for attenuation. Current theoretical understanding of shock acceleration limits the intrinsic particle distribution in blazars to a power-law of index no harder than a 1.5 and correspondingly, an intrinsic photon spectrum with 1.5 (Aharonian et al. 2006).
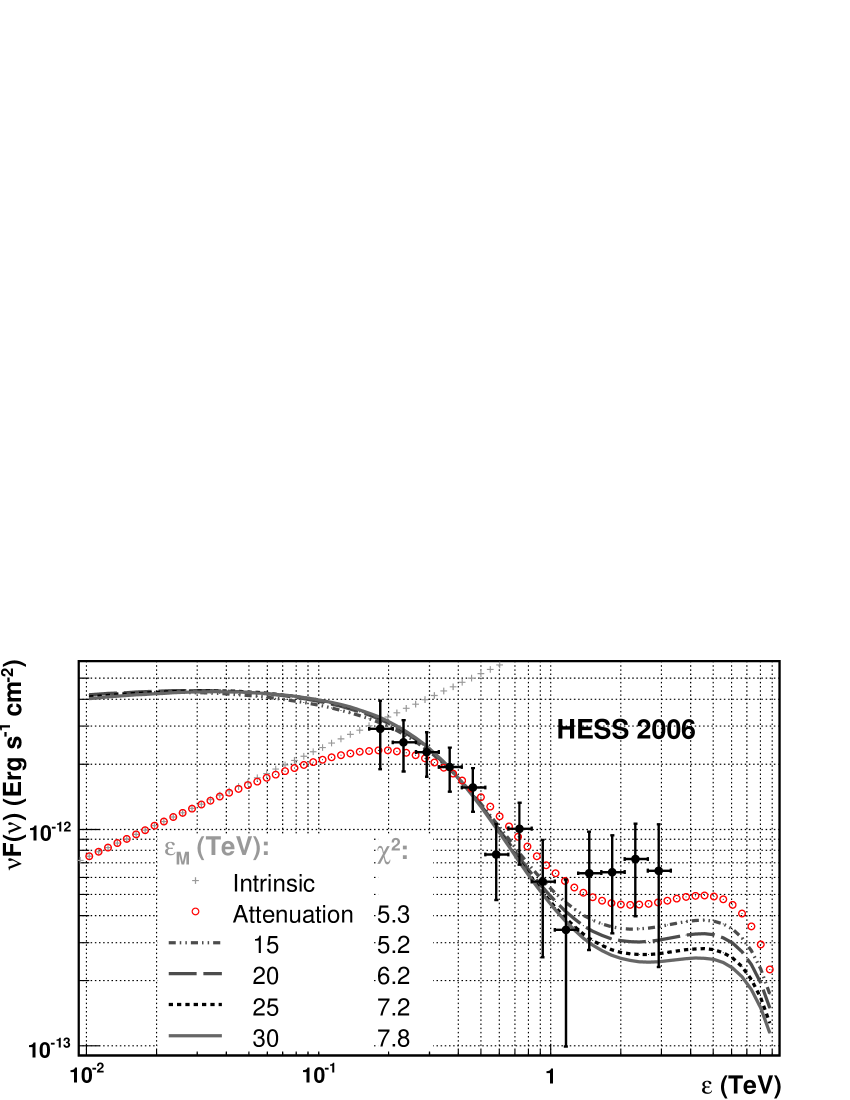
1ES 1101-232, at , is currently the farthest known TeV source and was used by the HESS collaboration to set an upper limit to the EBL corresponding to the HESS 2006 SED shown in Fig. 1. The comparison between a =1.5 power-law attenuated by the HESS 2006 EBL (without cascade, =0) and the data is shown in Fig. 3, reproducing the results of Aharonian et al. (2006). Attenuated spectra taking into account the full cascade emission with =1 (i.e. a null EMF) are also shown for various values of the maximum energy to which the intrinsic power-law extends. Since cascades initiated at higher energies increase the photon populations in lower ones, one might expect the final spectra to appear harder than for pure absorption. However, because IC occurs predominantly on the CMB, the cascade emission accumulates below , softening the spectrum between 100 GeV and 1 TeV. High values of lead to more cascading and more softening. The values suggest , although further observations, particularly above 1 TeV, would be necessary in order to confirm this. For such low values, not many photons initiate cascades. For higher , the softening is such that a lower EBL would be needed to match the data. Thus the HESS 2006 upper limit found by Aharonian et al. (2006) holds strong, even in this extreme limit where all the cascade emission is received by the observer.
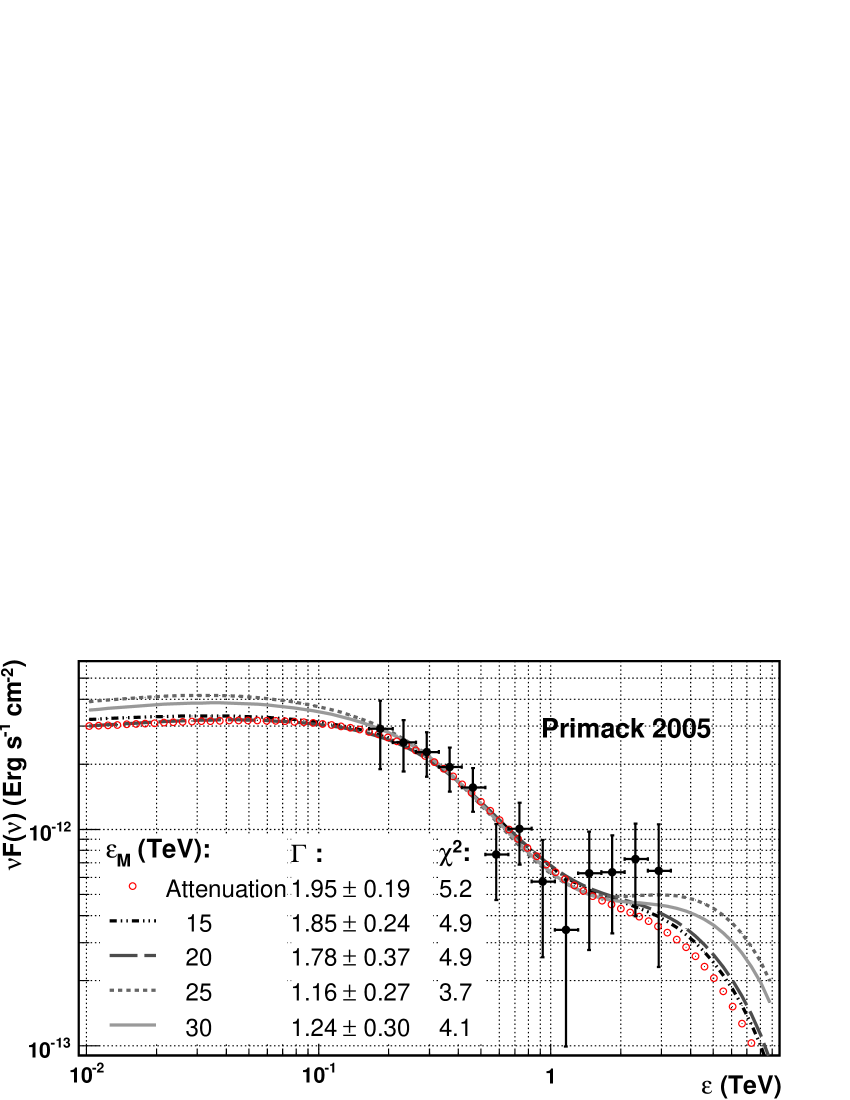
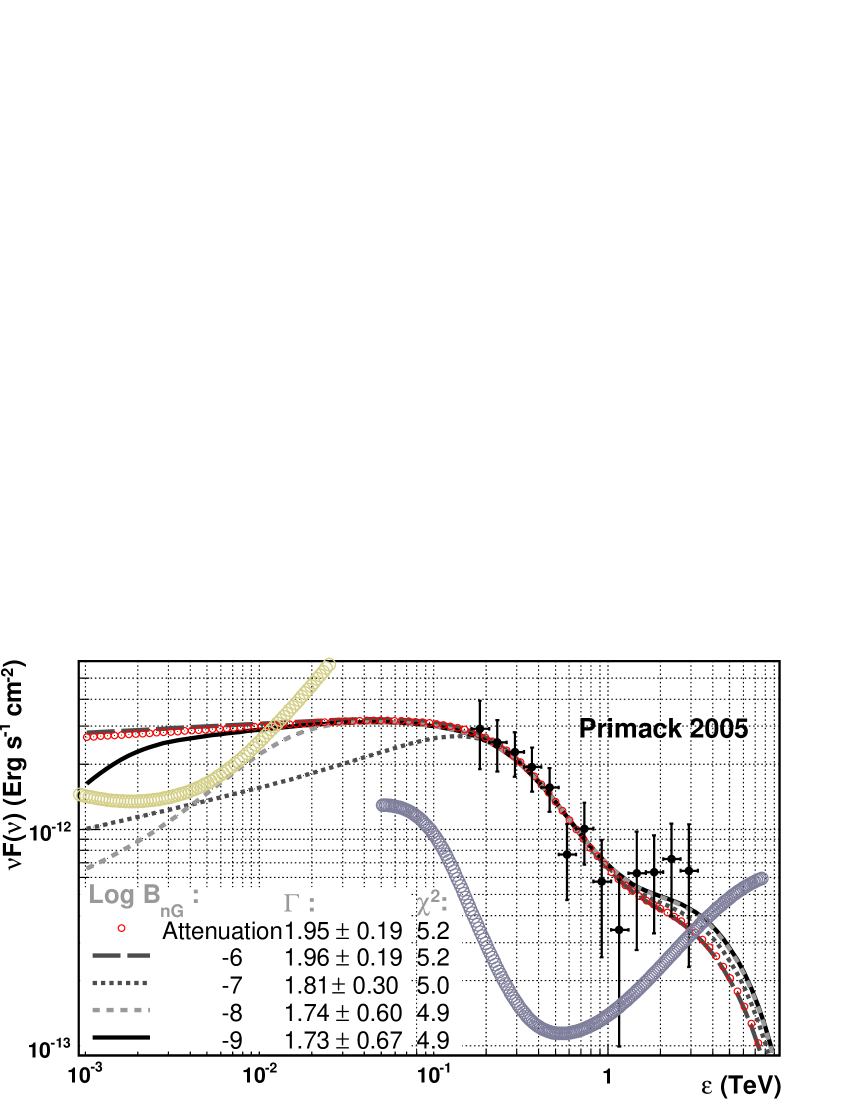
Inversely, the intrinsic -ray spectrum at the source can be obtained given some assumption on the intervening EBL. Using the lower limit on the EBL set by galaxy counts (Primack 2005 in Fig. 1) gives a limit on how soft the intrinsic spectrum can be. For pure absorption, the best fit has (Fig. 4). As expected, this is softer than the assumed above, yet still suggests that a good fraction of the -ray energy in 1ES 1101-232 is output above a TeV. A hard intrinsic spectrum is needed if cascade emission is to contribute significantly to the low-energy continuum (Aharonian et al. 2002). 1ES 1101-232 is the first blazar where the intrinsic spectrum is constrained to be hard enough for this, even in the minimal EBL limit.
Including cascade emission in the fit (Fig. 4) hardens even more the intrinsic spectrum as the cutoff increases and cascades contribute more and more to the observed spectrum. For higher , the best fit increases again to mitigate the pronounced softening from the strong cascading but the fit worsens. This also holds for (implausibly) high values of TeV, for which cascade emission largely dominates at a few TeV. The hard intrinsic spectra found here, assuming the Primack 2005 is indeed the minimum possible EBL, suggest either that is not greater than a few TeV, so that there is little cascade emission in the TeV range, or that a large part of the cascade emission is lost due to diffusion on the EMF.
As discussed in §2, the electron diffusion on the EMF depends on the ratio . The effect on the observed spectra is now taken into account by setting =0 when 300 (corresponding to a maximum deviation on the line-of-sight of 0.1°-0.2° equal to the best GLAST angular resolution) and =1 otherwise. For example, an EMF of means that emission from electrons of energy is suppressed. This will lead to low-energy cutoff in the cascade spectrum as only emission from pairs above a certain energy reaches the observer. The overall spectrum appears as a hump between (with the Lorentz factor of the electrons for which ) and 100 GeV (above which absorption dominates). Hence, a non-zero EMF leads to a reduction of the overall cascade emission seen by the observer (compared to Figs. 3-4) but can also lead to a well-defined signature above the continuum.
Figure 5 shows the observed spectra for a Primack 2005 EBL and for EMF intensities between and . The intrinsic power-law index was left free but its cutoff was fixed at either or . The best fit index is then found for each value of the EMF. In both cases, the spectra for an EMF nG are not much different from the pure absorption case as most of the cascade emission is isotropised and lost to the observer. With =10 TeV, the best-fit intrinsic slopes are flat in and the cascade emission is essentially indistinguishable from the GeV continuum for any value of the EMF. The intrinsic emission is assumed here to be a simple power-law over the whole energy range. More realistic modelling would result in a curved intrinsic Compton component. The cascade emission might then be more readily identifiable over an intrinsic continuum rising from GeV to TeV energies.
Stronger cascading, as a result of a higher cutoff energy and/or a higher EBL density, makes the hump apparent for the same reason. The intrinsic spectrum is then necessarily much harder, enabling the contribution from the cascade to stand out over the continuum. The bottom panel of Fig. 5 shows that EMF intensities of 10-9– nG can be identified using GLAST and HESS-2 if =20 TeV. Cascade emission is not diluted for EMF intensities weaker than nG and there is no spectral feature to measure the EMF. Surprisingly, in most cases 1ES 1101-232 is only slightly above the GLAST one-year detection limit. Unless they become active and flaring, low flux state blazars detected by HESS such as 1ES 1101-232 are likely to be difficult to detect with GLAST, illustrating the advantage provided by the large collecting area of ground-based Cherenkov arrays (but at higher energy thresholds). Similar results are obtained by keeping at 10 TeV but using the stronger HESS 2006 EBL. However, in this case, the fitted intrinsic slopes are very hard () when the EMF intensities are lower than nG.
The softest values of , which are the most plausible given the present knowledge on blazars, favour values of the EMF higher than and/or a cutoff energy below 20 TeV. VHE emission from nearby, little-attenuated blazars can be investigated for evidence of cutoffs at energies TeV — although it should be noted that e.g. HESS observations of Mkn 421 () taken at a high flux actually measure an exponential cutoff at 3 TeV (Aharonian et al. 2005). EMF intensities nG are consistent with measures inside clusters and super-clusters. Such structures may reach 10–50 Mpc in size, which is greater than the attenuation length for -rays above . Furthermore, the largest voids, where the EMF is expected to be very small, have a size (20 Mpc, Patiri et al. 2006), smaller than the distance to 1ES 1101-232. Hence, cascades are likely to be initiated inside walls. As is only of the order of , such cascades reemit most of their energy within the confines of the clusters, and thus are subject to diffusion. In this case, the cascade emission can only be detected by resolving the faint halo surrounding the -ray source.
5 Conclusion
The impact of extragalactic cascade emissions on the GeV-TeV spectrum of 1ES 1101-232 has been investigated and shown to soften the observed spectrum in the TeV range compared to pure absorption. This occurs because most of the cascade emissions occurs at and below. As a result, the upper limits on the EBL determined by HESS are strengthened in the sense that taking cascades into account would lead to harder intrinsic spectra than judged plausible, or to a reduced EBL upper limit. Inversely, using lower limits on the EBL coming from galaxy counts, the intrinsic spectrum of 1ES 1101-232 is found to have , with very hard values if there is an important contribution from cascade emission. This is at odds with current theoretical and observational understanding of blazars. A cutoff TeV in the intrinsic spectrum would limit the cascade contribution. This contribution would also be quenched if the EMF intensity is greater than nG, as expected away from voids. A lower EMF increases the amount of cascade emission reaching the observer in the GeV band, with a signature in the GLAST band for intensities nG — but at the price of a hard intrinsic spectrum so as to fit the HESS observations.
References
- Aharonian et al. (2005) Aharonian, F., Akhperjanian, A. G., Aye, K.-M., et al. 2005, A&A, 437, 95
- Aharonian et al. (2006) Aharonian, F., Akhperjanian, A. G., Bazer-Bachi, A. R., et al. 2006, Nature, 440, 1018
- Aharonian et al. (1994) Aharonian, F. A., Coppi, P. S., & H.J., V. 1994, ApJ, 423, L5
- Aharonian et al. (2002) Aharonian, F. A., Timokhin, A. N., & Plyasheshnikov, A. V. 2002, A&A, 384, 834
- Biller (1995) Biller, S. D. 1995, Astroparticle Physics, 3, 385
- Cheng & Cheng (1996) Cheng, L. X. & Cheng, K. S. 1996, ApJ, 459, L79
- Dai et al. (2002) Dai, Z. G., Zhang, B., Gou, L. J., Mészáros, P., & Waxman, E. 2002, ApJ, 580, L7
- Dole et al. (2006) Dole, H., Lagache, G., Puget, J.-L., et al. 2006, A&A, 446
- Fan et al. (2003) Fan, Y. Z., Dai, Z. G., & Wei, D. M. 2003, A&A, 13
- Gould & Schréder (1966) Gould, R. J. & Schréder, G. 1966, Phys. Rev. Lett., 16, 252
- Jones (1967) Jones, F. C. 1967, Phys. Rev., 167, 1159
- Kronberg (1994) Kronberg, P. P. 1994, Reports of Progress in Physics, 57, 325
- Lagache et al. (2003) Lagache, G., Dole, H., & Puget, J.-L. 2003, MNRAS, 338, 555
- Neronov & Semikoz (2006) Neronov, A. & Semikoz, D. V. 2006, ArXiv Astrophysics e-prints
- Patiri et al. (2006) Patiri, S. G., Betancort-Rijo, J. E., Prada, F., Klypin, A., & Gottlöber, S. 2006, MNRAS, 369, 335
- Peiris et al. (2003) Peiris, H. V., Komatsu, E., Verde, L., et al. 2003, ApJS, 148, 213
- Plaga (1995) Plaga, R. 1995, Nature, 374, 430
- Primack (2002) Primack, J. 2002, in COSPAR, Plenary Meeting
- Primack et al. (2005) Primack, J. R., Bullock, J. S., & Somerville, R. S. 2005, in AIP Conf. Proc. 745: High Energy Gamma-Ray Astronomy, ed. F. A. Aharonian, H. J. Völk, & D. Horns, 23–33
- Primack et al. (1999) Primack, J. R., Bullock, J. S., Somerville, R. S., & MacMinn, D. 1999, Astroparticle Physics, 11, 93
- Protheroe (1986) Protheroe, R. J. 1986, MNRAS, 221, 769
- Protheroe & Stanev (1993) Protheroe, R. J. & Stanev, T. 1993, MNRAS, 264, 191
- Stecker et al. (1992) Stecker, F. W., de Jager, O. C., & Salamon, M. H. 1992, ApJ, 390, L49
- Vallée (2004) Vallée, J. P. 2004, New A Rev., 48, 763
- Widrow (2002) Widrow, L. M. 2002, Reviews of Modern Physics, 74, 775
- Xu et al. (2001) Xu, C., Lonsdale, C. J., Shupe, D. L., O’Linger, J., & Masci, F. 2001, ApJ, 562, 179
- Zdziarski (1988) Zdziarski, A. A. 1988, ApJ, 335, 786