2) Max-Planck-Institut für Radioastronomie, Auf dem Hügel 69, 53121 Bonn, Germany
11email: muzic@ph1.uni-koeln.de
First proper motions of thin dust filaments at the Galactic Center
Abstract
Context. L’-band (3.8 m) images of the Galactic Center show a large number of thin filaments in the mini-spiral, located west of the mini-cavity and along the inner edge of the Northern Arm. One possible mechanism that could produce such structures is the interaction of a central wind with the mini-spiral. Additionally, we identify similar features that appear to be associated with stars.
Aims. We present the first proper motion measurements of the thin dust filaments observed in the central parsec around SgrA* and investigate possible mechanisms that could be responsible for the observed motions.
Methods. The observations have been carried out using the NACO adaptive optics system at the ESO VLT. The images have been transformed to a common coordinate system and features of interest were extracted. Then a cross-correlation technique could be performed in order to determine the offsets between the features with respect to their position in the reference epoch.
Results. We derive the proper motions of a number of filaments and 2 cometary shaped dusty sources close (in projection) to SgrA*. We show that the shape and the motion of the filaments does not agree with a purely Keplerian motion of the gas in the potential of the supermassive black hole at the position of SgrA*. Therefore, additional mechanisms must be responsible for their formation and motion. We argue that the properties of the filaments are probably related to an outflow from the disk of young mass-losing stars around SgrA*. In part, the outflow may originate from the black hole itself. We also present some evidence and theoretical considerations that the outflow may be collimated.
Key Words.:
Galaxy:center – infrared:ISM1 Introduction
At a distance of 8 kpc (Reid 1993; Eisenhauer et al. 2003, 2005) the center of the Milky Way shows a broad variety of structures. Near-infrared diffraction limited imaging over the past 10 years (Eckart & Genzel 1996; Genzel et al. 1997; Ghez et al. 1998; Genzel et al. 2000, 2003; Ghez et al. 2000; Eckart et al. 2002; Schödel et al. 2003; Ghez et al. 2005) has resulted in convincing evidence for a 3.6106M⊙ black hole being located at the center of a dense stellar cluster. This finding is supported by the discovery of a variable X-ray and NIR source at the position of SgrA* (Baganoff et al. 2001, 2003; Eckart et al. 2004).
High angular resolution spectroscopic observations have confirmed the presence of a dense clumpy molecular ring (also called circum nuclear disk, CND) of warm dust (Zylka et al. 1995) and neutral gas (Güsten et al. 1987; Jackson et al. 1993; Wright et al. 2001; Herrnstein & Ho 2002) surrounding a short-lived central cavity of much lower mean gas density. The central cavity is about 3 pc in diameter (see Rieke et al. 1989; Chan et al. 1997; Scoville et al. 2003) and contains the so-called mini-spiral, mainly composed of ionized gas and dust. Vollmer & Duschl (2000) have re-examined the mini-spiral gas dynamics traced by the [Ne II] line emission (=12.8m; Lacy et al. 1991) and the H92 radio emission data (Roberts & Goss 1993) and discuss the kinematic structure of the inner 34 pc of the Galaxy. Vollmer & Duschl (2000) derive a three-dimensional kinematic model of gas streams that describes the bulk gas motion in three different planes. Most of the material is located in a main plane which is connected to the inner edge of the CND.
Paumard et al. (2004) observed the mini-spiral with integral field spectroscopy at 2.06m (He I) and 2.16m (Br ) covering roughly 40” 40” around SgrA*. They analyze the kinematics of the mini-spiral and describe nine distinguishable structures. From their analysis, the Northern Arm consists of a weak, continuous, triangular-shaped surface, drawn out into a narrow stream in the vicinity of SgrA* where it shows a strong velocity gradient, and a bright western rim.
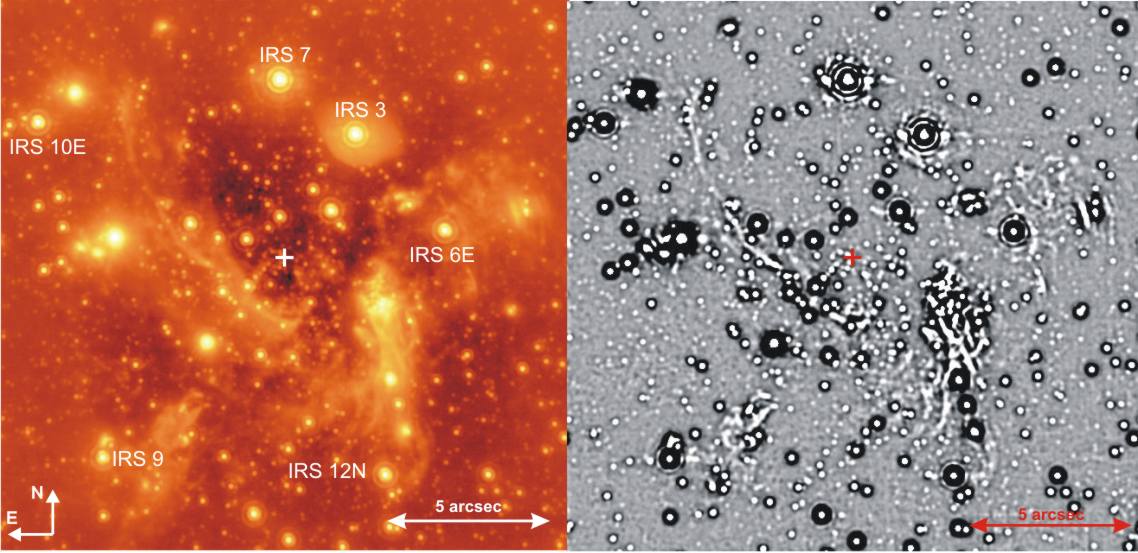
In the previously published observations of the mini-spiral, a number of narrow, filamentary structures have been reported. The observations include high-resolution radio data (Zhao & Goss 1998; Yusef-Zadeh et al. 1998) and NIR Pa (Scoville et al. 2003), Br (Morris 2000) and He I (Paumard et al. 2001) emission line maps. Here we present L’-band (3.8 m; see Fig. 1) observations of the Galactic Center performed with the NACO adaptive optics system at the ESO VLT UT4 111Based on observations collected at the European Southern Observatory, Chile. These data allow us not only to identify features as narrow as the 100 mas angular resolution of the observations and in much larger number than in any previous dataset, but also to measure them clearly with high precision. Some of the filaments, particularly those associated with the Northern Arm and one detected stellar bow shock, have earlier been reported by Clénet et al. (2004) from observations at the same wavelength.
The L’-band flux from the mini-spiral is primarily coming from the thermal dust emission, which is confirmed by the observations at mid-infrared wavelengths (Viehmann et al. 2006). The detection of some of the filaments in Pa and Br tells us that the emission is as well associated with the ionized gas component of the ISM. In the L’-band, there is probably no significant contribution of the emission from the light scattered by dust grains. In this case one would expect to observe a significant amount of the polarized emission also at the shorter wavelength K-band - which is not observed (Eckart et al. 1995; Ott et al. 1999). Furthermore, there is no bright NIR source at the Galactic Center that could be identified as the source of large amounts of scattered light. Polarized emission from the mini-spiral observed at longer infrared wavelengths is due to thermal emission from elongated dust grains (Aitken et al. 1991, 1998).
The central parsec of the Milky Way harbours a cluster of massive stars (Blum et al. 1995; Krabbe et al. 1995; Genzel et al. 1996, 2000; Eckart et al. 1999; Clénet et al. 2001; Paumard et al. 2006) that supply 310-3M⊙ yr-1 of gas in the form of stellar winds to the center (Najarro et al. 1997). The amount of gas available for accretion onto SgrA* at the Bondi radius is estimated to be 10-5 M⊙ yr-1 (Quataert 2003; Baganoff et al. 2003). The actual mass accreted onto SgrA* is up to 2 orders of magnitude lower, as determined by the linear polarization measurements at 230 GHz (Bower et al. 2003; Marrone et al. 2006). We can see that about 99% of the material from stellar winds does not even get close to the Bondi radius and must therefore escape the central arcseconds in form of a wind. Blandford & Begelman (1999) point out that for accretion rates well below the Eddington rate most of the gas accretes with positive energy and may escape. Therefore they propose a solution (ADIOS; adiabatic inflow-outflow solution) in which most of the gas is lost through winds and only a small fraction of the gas is actually accreted onto the black hole. This is also in agreement with the RIAF theory (radiatively inefficient accretion flow; see e.g. Yuan 2006) that postulates strong outflows from SgrA*. The outflow may be partially collimated in form of a jet. Jet and shock models (see Markoff & Falcke 2003; Melia & Falcke 2001) as well as accretion from an in-falling wind due to the surrounding cluster of mass-losing hot stars (e.g. Coker et al. 1999; Yuan et al. 2002) are discussed to explain the radio to X-ray properties of SgrA*.
There is some observational evidence for outflows in the central parsec as well. The ”mini-cavity” region 3.5” southwest of the compact radio source SgrA* was first pointed out on cm-radio maps by Yusef-Zadeh et al. (1990). The strong Fe[III] line emission seen toward that region (Eckart et al. 1992; Lutz et al. 1993) is consistent with gas excited by a collision with a fast (1000 km s-1) wind from a source within the central few arcseconds (Yusef-Zadeh & Wardle 1993; Yusef-Zadeh & Melia 1992). Most recently Schödel et al. (2007) present an extinction map of the central parsec. In this map an extended region of low extinction, centered on SgrA* runs in NE-SW direction across SgrA* and is continued in the mini-cavity. It supports the assumption of an outflow from the central arcseconds. For one of the most prominent dust embedded sources, IRS 3, Viehmann et al. (2005) find that the extended L- and M-band continuum emission has a characteristic bow-shock shape. A possible explanation for its asymmetric appearance is that IRS 3 consists of a mass-losing star surrounded by a very thick, extended dust shell, which is pushed northwest by a wind from the direction of the IRS 16 cluster and SgrA* (Pott et al. 2007). Similarly to the north, the mass-losing envelope of IRS 7 appears to be influenced by a strong central wind (Yusef-Zadeh & Melia 1992).
The narrow filaments observed in the L’-band are the main concern of this paper: we identify them, present proper motion measurements, discuss their nature and present an interpretation in the light of the postulated outflow from the center. In section 2 we present the observations. In section 3 we identify thin filaments and explain proper motion measurements in detail. In sections 4 and 5 we describe the proper motions and discuss the nature of the detected thin filaments. In order to validate our proper motion results we compare the K-band and L’-band stellar proper motions in appendix A. In section 6 we present the probable wind sources in the central few arcseconds. In appendix C we present the outflow model and discuss the overall 3-dimensional orientation. The summary and conclusions are given in section 7.
2 Observations
The L’ (3.8 m) and KS-band (2.1 m) images were taken with the NAOS/CONICA adaptive optics assisted imager/spectrometer (Lenzen et al. 1998; Rousset et al. 1998; Brandner et al. 2002) at the UT4 (Yepun) at the ESO VLT. The L’-band data set includes images from 5 epochs (2002.660, 2003.356, 2004.320, 2005.364 and 2006.408) with a resolution of 100 mas. The KS-band data set includes the images from epochs 2002.339, 2003.356, 2004.512, 2004.521 and 2006.413 with a resolution of 56 mas. Data reduction (bad pixel correction, sky subtraction, flat field correction) and formation of final mosaics was performed using the DPUSER software for astronomical image analysis (T. Ott; see also Eckart & Duhoux 1990).
The absolute positions of sources in our AO images were derived by comparison to the VLA positions of IRS 10EE, 28, 9, 12N, 17, 7 and 15NE as given by Reid (1993). The radio positions and the positions in the L’-band image agree to within less than a single 27 mas pixel i.e. a quarter of the beam. However, our proper motion measurements were based on relative astrometry between frames in order to avoid errors that may arise from uncertainties of the absolute positions.
3 Data analysis
3.1 Identification of the thin filaments
The L’-band images (Fig. 1, left) clearly show stars, bright dust embedded sources as well as the emission of the mini-spiral. In addition, one can distinguish a number of previously unknown thin filaments. In order to highlight these structures we produced high-pass filtered maps (Fig. 1, right) by subtracting a smoothed version of the images from themselves, and then smoothing the final images. As a smoothing function in both cases we used a 4 pixel Gaussian (1 pixel corresponds to 0.027”). This procedure enhances all structures that have significant power at spatial frequencies that correspond to the diffraction limited beam size.
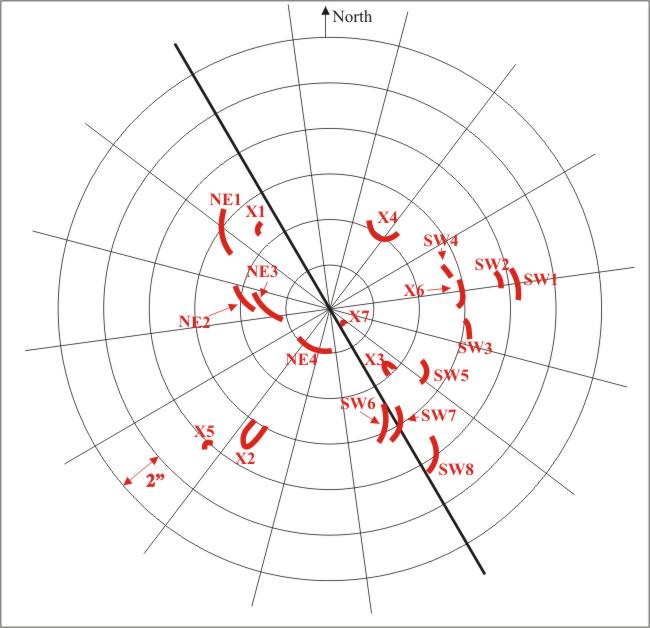
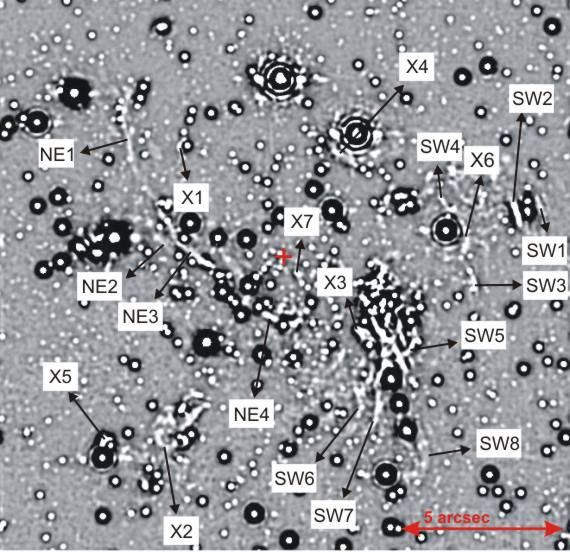
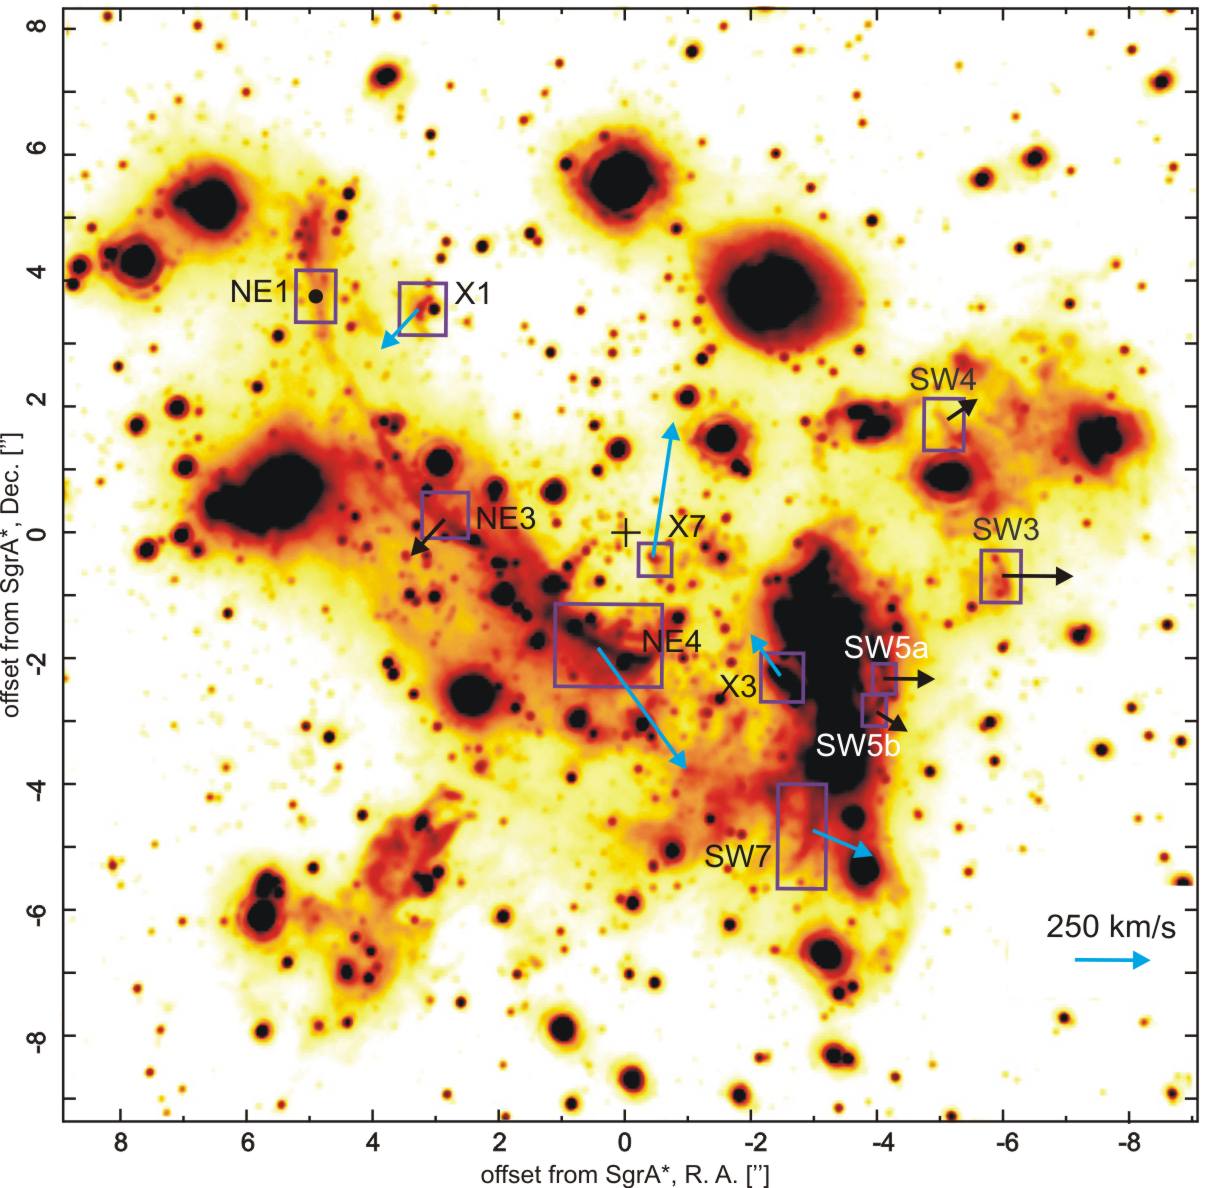
The thin filaments that are apparent in the L’-band maps are located close to the mini-cavity, along the inner edge of the Northern Arm and, in some cases, in the vicinity of stars. The width of the filaments is 100 mas, the diffraction limit of NACO L’-band images. Fig. 2 shows a schematic representation of the thin features in the central parsec of the Milky Way as derived from the data shown in the right panel of Fig. 1.
According to their appearance we can divide the filaments in two classes: the first class represents features most probably associated with stars (denominated with X); the second class features are more elongated and associated with the mini-spiral. Those located west and south from SgrA* are denominated SW and those associated with the Northern Arm and located east from SgrA* we label NE. They cannot be associated with stars in a straightforward way. We find that the second class of filaments to the east and northeast of SgrA* are located at the inner side of the Northern Arm and curved with their convex sides eastward, whereas filaments to the west and southwest of SgrA* are curved with their convex sides westward and elongated almost perpendicularly to the Bar. Several of the more luminous filaments to the west and southwest are located on the western side of the mini-cavity close (in projection) to the IRS13/IRS2 complex or just south of it (most prominent are SW5, SW6, SW7, SW8). One can also notice that some of these filaments are located up to about 5” SSW of SgrA*, almost opposite to and approximately at the same distance as the most distant filament in the Northern Arm. Concerning the X features, we notice no preferred direction towards which they are curved. We discuss their possible nature in section 4.1.
3.2 Methods for proper motion measurements
In order to measure the positional offsets of a feature at different epochs, entire image frames had to be transformed to a common coordinate system. This was done using IDL image transformation routines. Transformation to second order was performed providing correction of all translations, rotations and possible distortions between two images. All the frames were transformed to the coordinate system of the 2003.356 epoch using a total of 34 stars to calculate the transformation matrix. The stars used for the transformation were chosen to be uniformly distributed across the field. The positions were corrected for the stellar proper motions as derived from the KS-band images. In order to validate our method and to demonstrate that reliable proper motions can be obtained from the lower resolution L’-band data we compare KS-band and L’-band stellar proper motions in appendix A.
In order to measure proper motions of the observed thin filaments we calculated offsets at all epochs with respect to the reference epoch (2003.356). First, we extracted an image section containing the entire feature, or the part of the feature that is not directly contaminated by stars. The position of the center and dimensions of the image sections are given in Table 1. Then we re-binned those image sections by a factor of 10 (since all the offsets are on sub-pixel scale), masked residual stars if present in the frame, and finally subtracted the background. The resulting small frames were cross-correlated with a reference frame in order to calculate the offset of the feature with respect to the reference position. We computed the inverse of the sum of the squares of the difference between overlapping pixel values. This resulted in a 2D cross-correlation function which was then fitted with a 2D Gaussian to determine the exact position of the peak that represents the best overlap of two features. There are two main sources of error that occur during the determination of the offset. The first is caused by the uncertainties due to the cross-correlation method. In order to determine this uncertainty for each feature and epoch, we shift it by different known sub-pixel offsets in all directions, run the cross-correlation routine and then calculate the standard deviation obtained from the imposed and derived shifts. The second is resulting from the frame transformation procedure. From the initial sample of 34 stars we have randomly chosen 50 different sub-samples of 20 stars each. For all sub-samples we then repeated the transformation of all frames and calculated the positional uncertainty. The error bars in diagrams in Fig. 6 contain contributions of both sources of uncertainty.
It is important to note that the extraction of stars from our images via PSF fitting leaves significant residuals at the positions of the brightest stars. Thus, our approach was to extract sub-images containing the filaments from the original L’-band images if possible. Due to the presence of a large number of stars in L’-band images, some of the identified features could not be extracted at all to perform the cross-correlation (e. g. SW6, SW8, NE2). In some cases we were only able to extract one part of the filament, rather then the entire structure. Besides the proximity of stellar sources, there is another reason for this: Many of the filaments are parts of more extended structures and could not be completely isolated. This means that the positional data along the feature do not result in a measurable proper motion. Therefore, the velocities of all NE and SW features, except that of the compact features SW7 and NE4, are measured approximately perpendicular to their extent. Some of the features are very faint in the L’-band and therefore unsuitable for the extraction. They can be more clearly identified in the smooth-subtracted images (features SW7, SW1, X4 and X6). In this case, only the SW7 appearance is sharp enough to give reliable results. On the other hand, some of the features are very bright (X5 and SW2) and may be associated with embedded stellar sources.
Using the Starfinder code for stellar field analysis (Diolaiti et al. 2000) we also produced low-pass images containing the background emission. The result of the point source extraction largely depends on the size of the box (in units of a FWHM of the PSF) used for the background estimate. For small values of the box size ( 10), the background estimate is still contaminated by stars, and for values larger than 15 the compact features become diffuse. The brightest of the Northern Arm filaments, NE4, has a high enough S/N to be clearly detected in the background images. The background image is free from stars and therefore allows us to extract the NE4 feature without confusion. However, other NE and SW filaments cannot be clearly defined against the smooth background. Thus, only for the NE4 filament we additionally give the proper motion component along the extent of the feature (see also appendix B). We performed the NE4 proper motion analysis for three different sizes of the box used for the background estimate (10, 13 and 15). The values given in Table 1 represent the average of the obtained results and the corresponding diagram in Fig 6 shows only the result for the box with a width of 13 PSF FWHM values.
4 Results
4.1 Nature of the X features
The features denominated with X are most probably associated with stars. The images clearly show that the features X1, X5, and X6 are curved, with stars at the approximate centers of their curvature - this suggests that they are associated with these stars. X1, X5 and possibly X6 could be formed due to interaction between a stellar wind, probably in combination with the stellar motion, and the interstellar medium. They could be similar to the Northern Arm stellar bow-shocks discussed in Tanner et al. (2005), but associated with less massive sources. Feature X1 was already reported by Clénet et al. (2004). The authors interpret it as a bow-shock. For feature X5 no significant proper motion was detected, but taking into account the significantly higher brightness of this feature with respect to the other filamentary structures, we suppose that there is an embedded or background star at the same position. The feature X4 is associated with IRS 3, whose bow-shock appearance was discussed in Viehmann et al. (2005).
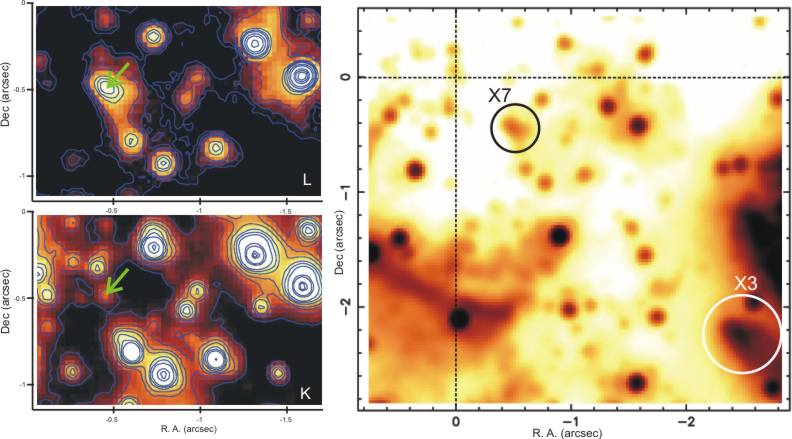
Along the line that connects SgrA* and the feature X3 ( 3.3” southwest from SgrA*) at the position (-0.56”, -0.55”) from SgrA*, one can notice feature X7, with a shape similar to that of X3. The faint star at this position in the KS-band image is represented by a much more extended structure in the L’-band image (Fig. 4). Both X3 and X7 are approximately aligned (in projection) with SgrA*. The line of symmetry of the X7 ”V”-shape is oriented 40o east of north and to within less than 5o it is passing through the position of SgrA*. The line of symmetry of X3 is slightly displaced from the line that connects it with SgrA* (5o) and is oriented 37o east of north. The opening angle toward SgrA* is 20o for X7 and 10o for X3. The orientation of both sources towards SgrA* suggests an interaction with a possibly existing outflow from the central region (see section 6.1.2). They may represent bow-shock-like features pointing back to the position of SgrA* as a common origin of such an outflow.
| 222relative to SgrA*; position of the center of the box | \footreffn3 | 333velocities of all NE and SW features, except that of SW7 and NE4, are in a direction approximately perpendicular to the feature. Other proper motions are given both in R. A. and Dec. direction. In case of NE4 we additionally give the velocity along the feature and perpendicular to it. The positive sign in the velocity refers to the eastward motion in R.A. and northward in Dec. For the perpendicular component the positive sign marks the predominant eastward motion. The negative sign for the motion of the NE4 along the filament marks the predominant southward component. | 444the position angle of the velocity vector for the features with a proper motion measured in the direction perpendicular to the feature. The angle is measured east of north. | ||||
| (arcsec) | (arcsec) | (arcsecarcsec) | (km s-1) | (km s-1) | (∘) | (km s-1) | |
| NE1 | 4.76 | 3.42 | 0.320.46 | -29 | 16 | 90 | 368 |
| NE3 | 2.62 | -0.09 | 0.380.41 | 167 | 25 | 140 | 550 |
| SW3 | -6.08 | -0.77 | 0.350.35 | -229 | 19 | 270 | 360 |
| SW4 | -5.07 | 1.76 | 0.430.38 | -92 | 16 | 305 | 404 |
| SW5a | -4.20 | -2.31 | 0.350.11 | -165 | 15 | 270 | 407 |
| SW5b | -4.13 | -2.75 | 0.160.24 | -123 | 22 | 240 | 400 |
| NE4 (R.A.) | 0.50 | -1.63 | 2.511.97 | -386 | 76 | 682 | |
| NE4 (Dec.) | -280 | 55 | |||||
| NE4 (along) | -436 | 103 | 240 | ||||
| NE4 (perp.) | 194 | 11 | 150 | ||||
| SW7 (R.A.) | -3.07 | -5.10 | 0.731.22 | -186 | 17 | 365 | |
| SW7 (Dec.) | -80 | 21 | |||||
| X1 (R.A.) | 3.22 | 3.40 | 0.300.38 | 113 | 16 | 412 | |
| X1 (Dec.) | -78 | 21 | |||||
| X7 (R.A.) | -0.56 | -0.55 | 0.540.41 | -71 | 17 | 1006 | |
| X7 (Dec.) | 458 | 21 | |||||
| X3 (R.A.) | -2.45 | -2.37 | 0.460.43 | -78 | 18 | 483 | |
| X3 (Dec.) | 135 | 20 |
4.2 Proper motion results
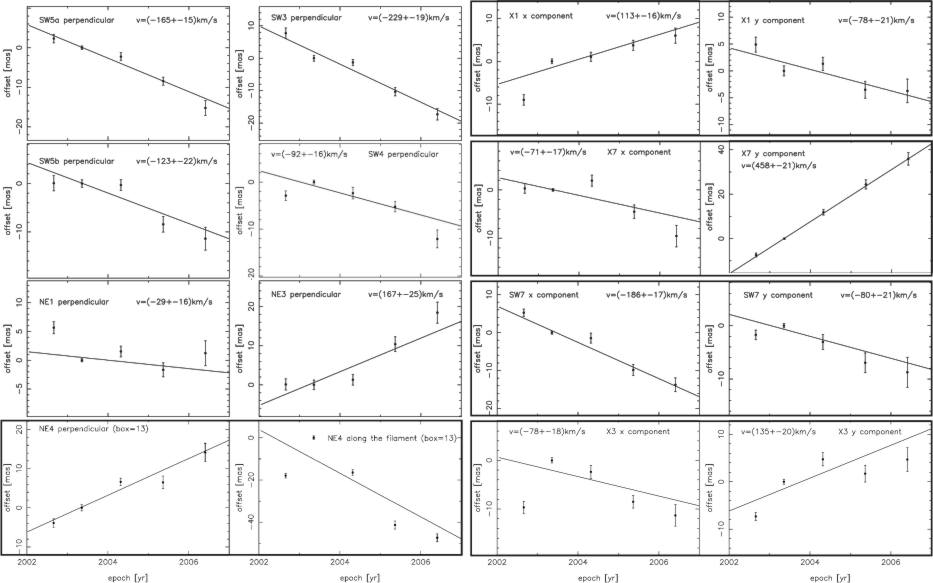
Table 1 summarizes the proper motions of thin filaments obtained in our study. The proper motions have been successfully determined in 11 regions. In order to transform the angular motions into velocities we assume a distance to SgrA* of 8 kpc.
Boxes in Fig. 5 mark the filaments that were analyzed. The directions of motion in the plane of the sky are represented by arrows. To emphasize that some of the motions shown in Fig. 5 do not contain the complete information about the motion in the plane of the sky, we represent them by different colors. The light blue arrows in Fig. 5 show the full proper motion of the corresponding feature, while the black ones represent only the component perpendicular to the feature of interest. A filled circle rather than an arrow at the position of the NE1 feature marks the insignificant motion of this feature. Note that for display purpose the dimensions of the boxes shown in Fig. 5 are different from those used for the extraction of the feature (as they are stated in Table 1). Diagrams in Fig. 6 contain detailed information about the results. The velocity difference in Table 1 represents the 1 uncertainty of the linear fit to the various epochs. Each offset is weighted by the corresponding uncertainty. The escape velocities were determined using the projected distance from SgrA* with a mass of 3.6106M⊙ .
Feature X1 is associated with a star located (2.95”, 3.46”) from SgrA*. The proper motion of the associated star is vR.A.=(24725) km s-1, vDec.=(-465) km s-1 as derived from our L’-band data. We find that the feature is moving approximately in the same direction as the star apparently associated with it - which confirmes the bow-shock interpretation of Clénet et al. (2004).
4.3 Comparison to Radio Measurements
Yusef-Zadeh et al. (1998) presented radio continuum observations at =2 cm and calculated proper motions of ionized gas at the Galactic Center. Although no thin filaments similar to those detected in NACO L’-band images are detected in the radio continuum images, some comparison can be done. The filamentary ionized structure connecting IRS 13 and IRS 2 (Box 11 in Yusef-Zadeh et al. 1998) coincides with the SW5 feature in our images (in this work divided in two parts, SW5a and SW5b, because of the presence of a star). A westward direction of motion is obtained from both measurements, but the value of this component obtained from the radio continuum is larger (vR.A.=(-32956) km s-1). The reason for this discrepancy is not clear. It is possible that at different wavelengths we are actually probing different material. Zhao & Goss (1998) also performed radio continuum observations at 7 and 13 mm and calculated proper motions of 57 compact H II components. As in the previous case, the only comparable structure is SW5 (”loop” in their notation), but the results are not in good agreement with ours. This feature, in the measurements of Zhao & Goss (1998), is divided in several non-consistently moving components, which is probably consequence of the granular substructure seen in the radio image (probably due to a low signal to noise ratio). In our IR continuum images the structure is well defined.
Yusef-Zadeh et al. (1998) report an anomalous high-velocity feature, so-called ”bullet”, at the offset (-3.39”, 2.065”) from SgrA* in the 1990 epoch. Approximately at this position in the L’-band images one can notice a dusty feature (see Fig. 5). However, given the high velocity quoted for the bullet it should have moved by (, ) = (0.30”, 0.34”) to the northwest from 1990 to 2006, which is the epoch of the image in Fig. 5. No similar feature can be found at the corresponding position in the 2006 epoch, or close to it. Although the feature we see in the L’-band cannot be disentangled from the rest of the material and therefore we are not able to measure its proper motion, a simple inspection of images at different epochs shows that it does not seem to have a significant velocity compared to the bullet. Therefore, we cannot identify this feature as the bullet.
5 Discussion
5.1 Orbits of the diffuse gas
The overall kinematic properties of the Northern Arm and Bar section can be modeled as a single gas streamer orbiting SgrA*. Such a model can be constrained via the radial velocity information from the H92 (Roberts & Goss 1993) and [Ne II] line (Lacy et al. 1991; Vollmer & Duschl 2000) as well as the overall distribution of the gas and dust along these features. Proper motions of ionized gas were in detail studied by Yusef-Zadeh et al. (1998). They additionally give the radial velocities as measured by Roberts & Goss (1993) and Roberts et al. (1996). According to Yusef-Zadeh et al. (1998) the predominant component of the motion in the plane of the sky is from east to west. The flow of gas in the Northern Arm follows its elongated shape: from the north-east with slightly redshifted velocities it follows the orbital trajectory to the southwest as it crosses the plane of the sky. The ionized gas passes south of SgrA* before it moves to the northwest. The complex velocity structure of the mini-cavity, however, fails to be explained by such a simple model. Similar results are reported by Paumard et al. (2004) based on He I and Br observations. At the position of the NE1 filament the line emission is slightly red shifted (40-60 kms-1) while at the positions of the other Northern Arm filaments the radial velocity becomes negative. At the position of NE3 the line emission is blue shifted by 40-60 kms-1 and close to NE4 by more than 130 kms-1. The Bar material at the position of SgrA* and within few arcseconds south of it has radial velocities close to 0 kms-1. The emission becomes blue shifted as we move further to the west (where SW3 and SW4 are located).
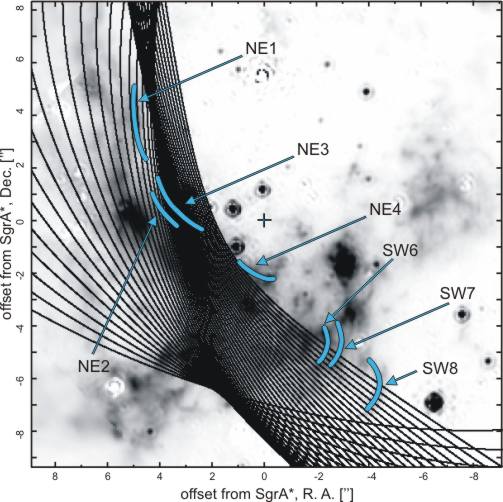
Paumard et al. (2004) analyzed the Northern Arm as a Keplerian system in the gravitational field of SgrA*. They fit a bundle of Keplerian orbits in order to model the full velocity field of the Northern Arm. The authors interpret the rim of the Northern Arm in terms of line-of-sight orbit crowding. The western edge facing SgrA* is the region that shows the highest density of crowded orbits (see Fig. 8 in Paumard et al. 2004). In order to construct Fig. 7 we used the part of the Fig. 8 in Paumard et al. (2004) having the same field of view as the L’-band images presented in this work.
5.2 Stability of the filamentary structures
The nature of the observed thin features, especially the SW and NE filaments, is unclear. One possible interpretation is that they are the consequence of the interaction of a central wind originating from the hot stars and/or possibly from SgrA*. While the origin and the mechanisms of such a wind will be discussed later in the text, here we concentrate on the effects it would have on the mini-spiral material in combination with the dominating gravitational potential of the central black hole.
We favor a scenario in which the proposed wind compresses gas and dust in the mini-spiral and forms the observed filaments. For the SW filaments this interaction could have taken place at the western edge of the mini-cavity. The thin Northern Arm filaments may have been generated by a wind in the opposite direction of the mini-cavity. For the mini-spiral Vollmer & Duschl (2001) quote a sound speed of vs=7.6 km s-1. This velocity is very small in comparison with the overall motion of the Northern Arm (Paumard et al. 2004; Yusef-Zadeh et al. 1998). Also, once formed, the filaments may still be influenced by wind from the central few arcseconds that may keep them confined. The magnetic field of the Northern Arm, as reported by Aitken et al. (1991) and Aitken et al. (1998), could also play a role in confining ionized gas and charged dust grains along the filaments.
If we assume a temperature of T=7000K for the mini-spiral material (Roberts & Goss 1993) then the average velocity of a hydrogen atom associated with thermal energy is v=(3kT/m)1/2 13 km s-1. At some position in the Northern Arm it takes approximately 250 yr for it to cross the distance equivalent to the width of a filament that we can resolve (100 mas). During this time the filament can drift 2.5” soutwards due to the motion of the mini-spiral material in the central gravitational potential. For dust particles it takes even longer to cross the equivalent width of a filament due to their thermal motion. This leads to the conclusion that a filament formed in the Northern Arm of the mini-spiral will have a lifetime that is long enough to drift to the southwest together with the gas stream. Once formed, the dominant source for their destruction will be the interaction with their surrounding turbulent medium. Judged from the line widths of the H92 emission (Roberts & Goss 1993) the velocity dispersion of the gas within the mini-spiral is of the order of 50 km s-1. Vollmer & Duschl (2000) assume a maximum value for the velocity dispersion of 40% of the Keplerian velocity.
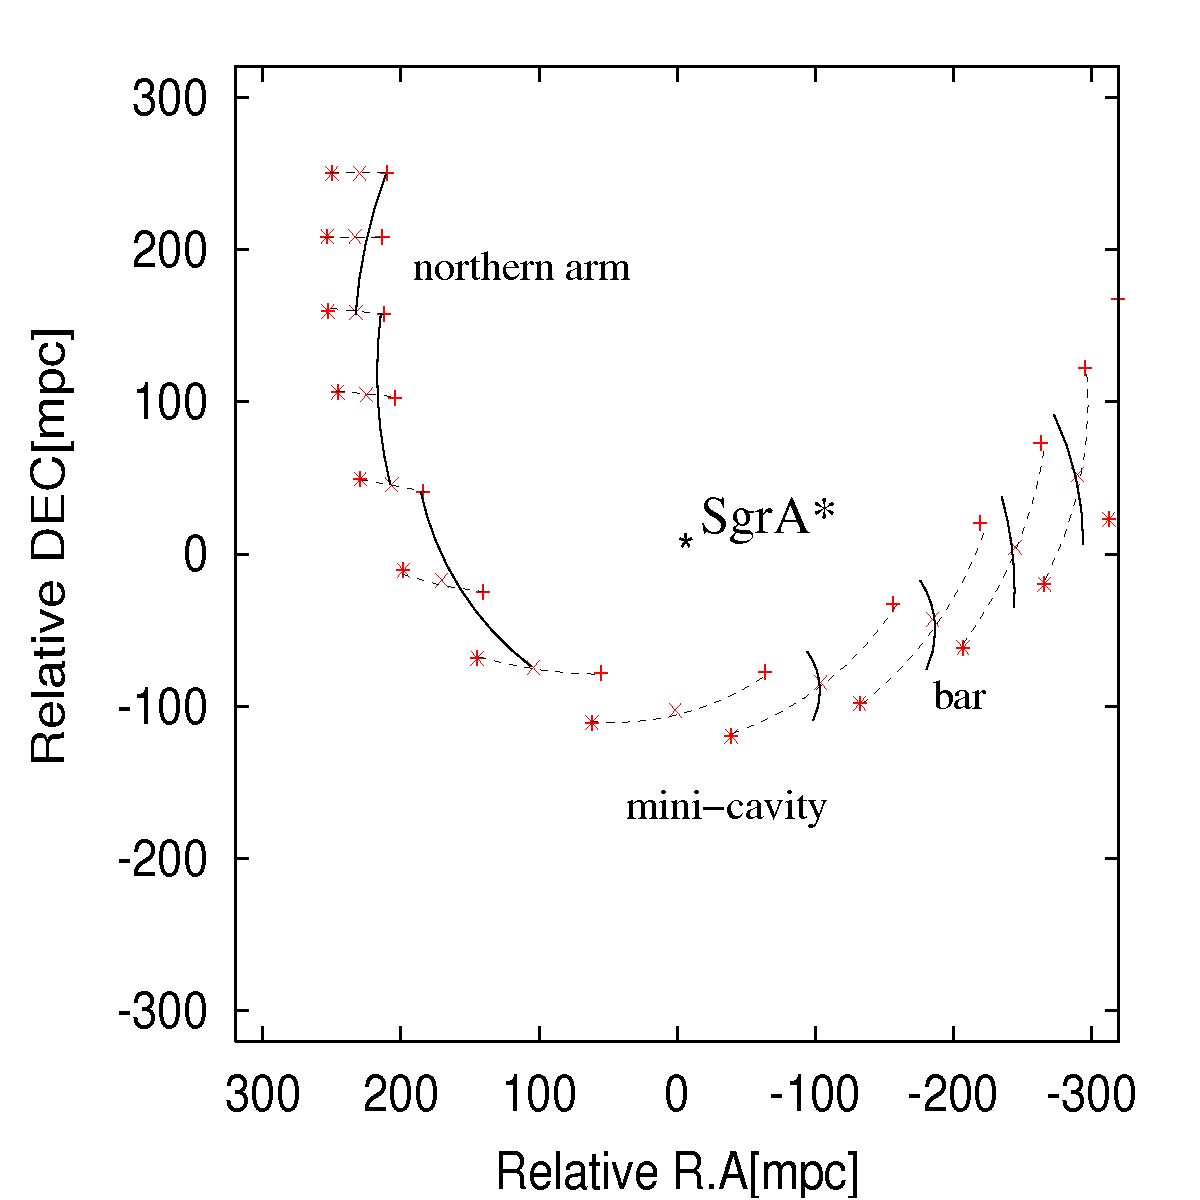
In order to investigate the kinematic behaviour of linear features formed in a central potential we carried out orbit simulations. We assumed a dominating central potential from a 3.6106M⊙ black hole at the position of SgrA*. Schödel et al. (2007) estimate that the gravitational field at the Galactic Center is dominated by the point mass of the black hole inside a projected radius of about 6”. Since all of the measured filaments are either inside or just at the border of this circle, we do not take into account the possible contribution of the stellar cluster to the gravitational potential. In agreement to similar calculations by Vollmer & Duschl (2000) and Paumard et al. (2004) we chose 3 test particles with velocities of = 20 km s-1, = -150 km s-1 and = -100 km s-1 launched from locations around = 220 mpc =5.6”, = 250 mpc = 6.4” and = 150 mpc (see Fig. 8). Here is the distance behind the plane of the sky including SgrA*. The corresponding orbits show that elongated thin features ”imprinted” into the Northern Arm are subject to a weak shear but to first order keep their original structure while drifting to the south. In our current picture Northern Arm filaments drift south (while being stretched by less than a factor of 2 within the Northern Arm) until they reach the mini-cavity region where they may be destroyed. Filaments created at the western edge of the mini-spiral drift westward along the Bar.
From Fig. 7 one can clearly see that the Northern Arm filaments cannot be simply explained as the consequence of orbit-crowding as suggested by Paumard et al. (2004). A comparison with the velocity field obtained from their model shows a good agreement for the perpendicular velocity component of the filaments NE1 and NE3 (within a 1 error for NE1 and 2 for NE3). This supports the assumption that the observed filaments are really drifting southwards together with the Northern Arm material. However, none of the orbits actually follows the shape of the filaments and therefore the proper motions of the gas as stated in Paumard et al. (2004) are not aligned with the extent of the filaments. Thus one needs to include an additional force that could form the filaments, keep them confined and prevent them from being destroyed by the bulk gas flow. This is especially valid for the filament NE3. The exact position of the filament NE4 does not coincide with any of the Keplerian orbits fitted by Paumard et al. (2004). They find that the Northern Arm is split into two layers as it reaches the mini-cavity. The mini-cavity itself is a part of the first layer, while the second layer is deflected northward from it and seems to contain the filament NE4. Concerning the SW filaments, our study shows that the proper motion components perpendicular to their extent are consistent with the motion in the dominating central potential, but we are still facing the question of their formation. As proposed earlier in this section, they could have been formed by an interaction at the western edge of the mini-cavity, and then drift westwards together with the rest of the mini-spiral material.
Concerning the possibility that the filaments are the consequence of an interaction between a fast wind and the mini-spiral material, we can try to predict the width of a shock using formula (8) in Hartigan et al. (1987). Assuming shock velocities 100-200 km s-1 and a density of the pre-shock medium 103cm-3, we get the cooling distance of the shock to be 30 AU 4 mas, much smaller then the resolution of the current observations.
Since the motions of the Northern Arm filaments fail to be completely explained simply by gravitational influence, one has to include additional forces that could drive the observed motions. In the next section we consider the winds at the Galactic Center as the main candidates.
6 Winds at the Galactic Center
As already discussed in the introduction, less than 1% of the material supplied by massive stars in the central parsec of the Galaxy is actually available for the accretion onto SgrA*. Most of the material never gets close to the BH, i.e. it must be blown away from the center and therefore can interact with the material of the mini-spiral.
6.1 Evidence for a central outflow
There is a body of observational evidence that supports the interaction of a wind with the local ISM as well as with stars in the central parsec. Some of those were already presented in the introduction (mini-cavity, IRS 3, IRS 7, low extinction region). Then, the features presented in this work: the narrow filaments could be the contact surfaces between the wind and the mini-spiral material. The ”V”-shaped sources X3 and X7 are supporting the SgrA* wind scenario (see section 6.1.2).
The main candidates for the source of the central outflow are the high-mass-losing stars at the center. Alternatively, the outflow could be due to a jet-like structure directly associated with the black hole at the position of SgrA*. Some of the theoretical models that successfully fit the observational data include such a jet (e.g. Falcke & Markoff 2000; Yuan et al. 2002). In appendix C we consider the possibility that the outflow could, in fact, be partially collimated.
6.1.1 Stars as the source of the outflow
Most of the above mentioned bright and massive He-stars are located within a single plane and most of them within a radius of 0.1 pc (2.5”) from SgrA* (Genzel et al. 2000, 2003; Levin & Beloborodov 2003), forming a disk of clockwise rotating stars (CWS). Paumard et al. (2006) largely expand the sample of stars belonging to the CWS disk, and also propose the existence of a second, less populated stellar disk containing counter-clockwise rotating stars (CCWS; see also Genzel et al. 2003). According to Paumard et al. (2006) most of the bright stars in the IRS 16 complex are part of the clockwise system, including IRS 16C and IRS 16SW. Since the bright He-stars in the CWS are also those that show clear indications for P Cygni profiles we assume that the stars in this disk are also the predominant source of mass loss in the central parsec. Since the geometry of the CWS plane is such that the rotational axis is inclined towards the observer, the bright He-stars to the north and northeast of SgrA* are located on the far side of the disk (i.e. IRS 16C, IRS 16CC, E29, E38; Beloborodov et al. 2006). Therefore they must be as close to the Northern Arm - which is passing by the IRS 16 cluster from behind - as the IRS 16 cluster is with respect to the mini-cavity. It is therefore likely that their stellar wind may have a similarly strong effect on the Northern Arm as it may have towards the mini-cavity.
6.1.2 Stellar probes of the wind from the direction of SgrA*
A particularly interesting feature in this context is feature X7. Despite the high velocity component to the northwest, the cometary or bow-shock-like shape of the feature is pointing approximately toward SgrA*. The wind from the direction of SgrA* could be responsible for this shape. If the star is moving within an area with no significant amounts of ISM then any supersonic wind from the direction of SgrA* could easily produce such a shape. If the amount of the ISM is not negligible then the wind should have a much higher velocity than the observed velocity of the feature. Taking into account the slight displacement of the line of symmetry of X7 from the line that connects it with SgrA*, a simple calculation tells us that the velocity of the wind from SgrA* should be at least one order of magnitude higher than the velocity of the feature. In addition, approximately along the same line that connects SgrA* and X7, lies the feature X3 with a same type of a cometary appearance (see Fig. 4). The alignment of X3 and X7 with SgrA*, and the shape of both features, give a strong support to the central outflow hypothesis. Recent VLT NACO KS-band polarization measurements (Meyer et al. 2006b) have shown that source X7 is also polarized by 305% along a position angle of -34o10o. Assuming that the polarization is due to Mie scattering of a non-spherical dust distribution then an overall direction of the bow-shock’s symmetry axis is 56o10o. This includes the direction towards SgrA* (see the description of data acquisition and calibration in Eckart et al. 2006 and Meyer et al. 2006b).
7 Summary and Conclusions
We have presented L’-band (3.8 m) adaptive optics observations of an approximately 1818 arcsec2 (0.70.7 pc2) region around SgrA* obtained with the NAOS/CONICA system at ESO VLT. The images reveal a large number of thin filaments associated with the mini-spiral, that could be due to the interaction of a fast wind with an ambient ISM. The previous detection of some of the filaments in the radio regime, as well as in Br and Pa lines, shows that the filaments are not only associated with the continuum emission by dust, but also with the ionized gas component of the ISM. High-resolution spectroscopy is needed that could show if there are shock-diagnostic lines coming primarily from the filaments in order to confirm our interpretation. However, there are a number of observational challenges involved (e. g. extinction, stellar contamination, resolution etc.) that may preclude a clear answer at this time.
We performed proper motion measurements of these features on the time basis of approximately 4 years. The filaments located west from SgrA* are curved with their convex sides westwards and show a significant proper motion to the west. The comparison with the Keplerian orbit fitting of the Northern Arm presented in Paumard et al. (2004), tells us that the process that drives the motion of the filaments cannot be purely due to the gravitational potential of the supermassive black hole at the center.
We propose the following scenario: An at least partially collimated outflow is emanating from a combination from the disk of high mass-losing He-stars and an outflow associated with the black hole at the position of SgrA*. This scenario represents a unified model that would explain the mini-cavity, the two cometary shaped sources X3 and X7, as well as the northern and southern lobes in the NIR emission (see appendix C). It would also be in agreement with the recent NIR polarization data that is indicative for a temporal accretion disk around SgrA* and would be supportive for a collimated outflow that is often invoked to explain the properties of SgrA*.
Appendix A L’- and KS-band stellar proper motion comparison
| 555data from Genzel et al. (2000) | |||||||||||||||
| r666relative to SgrA*; position in the 2003.356 epoch | \footreffn1 | \footreffn1 | |||||||||||||
| (arcsec) | (arcsec) | (arcsec) | |||||||||||||
| 1.05 | 0.80 | -0.68 | 426 | 14 | 431 | 31 | 410 | 80 | 23 | 12 | 9 | 11 | 50 | 100 | |
| IRS 16C | 1.21 | 1.10 | 0.50 | -285 | 9 | -336 | 22 | -330 | 39 | 268 | 11 | 222 | 6 | 353 | 34 |
| 1.45 | -1.35 | 0.52 | -52 | 9 | -53 | 37 | -58 | 95 | -181 | 10 | -212 | 29 | -116 | 62 | |
| 2.07 | 1.90 | -0.82 | 228 | 14 | 218 | 38 | 154 | 84 | 100 | 13 | 62 | 24 | 13 | 44 | |
| IRS 16CC | 2.07 | 1.99 | 0.55 | -48 | 9 | -55 | 22 | -58 | 35 | 183 | 10 | 174 | 7 | 234 | 27 |
| 2.18 | 1.85 | -1.15 | 254 | 9 | 248 | 23 | 255 | 28 | 20 | 10 | 47 | 8 | 113 | 23 | |
| IRS 33N | 2.20 | -0.05 | -2.20 | 103 | 9 | 131 | 31 | 70 | 48 | -309 | 10 | -339 | 14 | -243 | 28 |
| 2.66 | -2.63 | 0.42 | -326 | 14 | -285 | 62 | -178 | 15 | -149 | 44 | |||||
| 3.17 | 2.94 | -1.19 | 139 | 10 | 121 | 27 | 147 | 51 | 87 | 11 | 85 | 15 | 111 | 55 | |
| 3.20 | 0.66 | -3.13 | 230 | 7 | 262 | 25 | -154 | 9 | -147 | 14 | |||||
| 3.22 | 3.22 | -0.01 | 75 | 10 | 53 | 27 | -352 | 11 | -372 | 23 | |||||
| 3.39 | 1.66 | -2.96 | 0 | 10 | -27 | 31 | 58 | 11 | 52 | 6 | |||||
| 3.47 | 3.24 | -1.25 | -11 | 17 | -11 | 27 | -178 | 13 | -175 | 16 | |||||
| 3.84 | -1.26 | 3.63 | 204 | 11 | 206 | 46 | 148 | 12 | 124 | 18 | |||||
| 4.15 | -3.34 | 2.46 | -123 | 12 | -102 | 39 | 402 | 12 | 405 | 16 | |||||
| 4.19 | 4.19 | 0.11 | 181 | 12 | 177 | 29 | -13 | 11 | -26 | 25 | |||||
| 4.55 | 2.95 | 3.46 | 237 | 10 | 247 | 25 | -52 | 10 | -46 | 5 | |||||
| 4.99 | 2.20 | 4.48 | 248 | 12 | 248 | 22 | -120 | 12 | -118 | 6 | |||||
| IRS 2L | 5.95 | -3.68 | -4.67 | -118 | 11 | -89 | 22 | -252 | 12 | -288 | 14 | ||||
| 6.30 | 2.85 | -5.62 | 229 | 12 | 239 | 32 | 4 | 11 | 26 | 30 | |||||
| 6.62 | 0.94 | -6.55 | -55 | 11 | -57 | 39 | -48 | 11 | -59 | 18 | |||||
| 6.90 | 5.09 | 4.66 | 102 | 18 | 108 | 37 | -154 | 15 | -148 | 20 | |||||
| IRS 1NE | 7.26 | 7.02 | 1.84 | 209 | 9 | 187 | 18 | -45 | 10 | -12 | 7 | ||||
| IRS 1SE | 7.51 | 7.50 | -0.45 | 150 | 9 | 110 | 17 | -80 | 10 | -85 | 25 | ||||
| 7.84 | -5.51 | -5.57 | -32 | 10 | -59 | 20 | 198 | 11 | 193 | 21 | |||||
| IRS 30E | 8.00 | -5.69 | 5.62 | 87 | 10 | 117 | 31 | 60 | 60 | 149 | 10 | 105 | 19 | 75 | 30 |
| 8.30 | 3.95 | -7.30 | 98 | 10 | 108 | 32 | -374 | 11 | -337 | 30 |
In Section 3.2 we explain how L’-band image frames from different epochs have been transformed to the coordinate system of a reference frame using IDL image transformation routines. In order to validate our method and to demonstrate that reliable proper motions can be obtained from the lower resolution L’-band data and that the resulting transformed images therefore are indeed astrometric and suitable for the measurements conducted in this work, we compare KS-band and L’-band stellar proper motions. The PSF fitting was done using the StarFinder code (Diolaiti et al. 2000). While the L’-band positions were obtained from transformed images we derived the KS-band positions from the original image frames and applied the corresponding transformation to the resulting lists. So the basic difference between two sets of proper motions is in the transformation of data to the reference coordinate system.
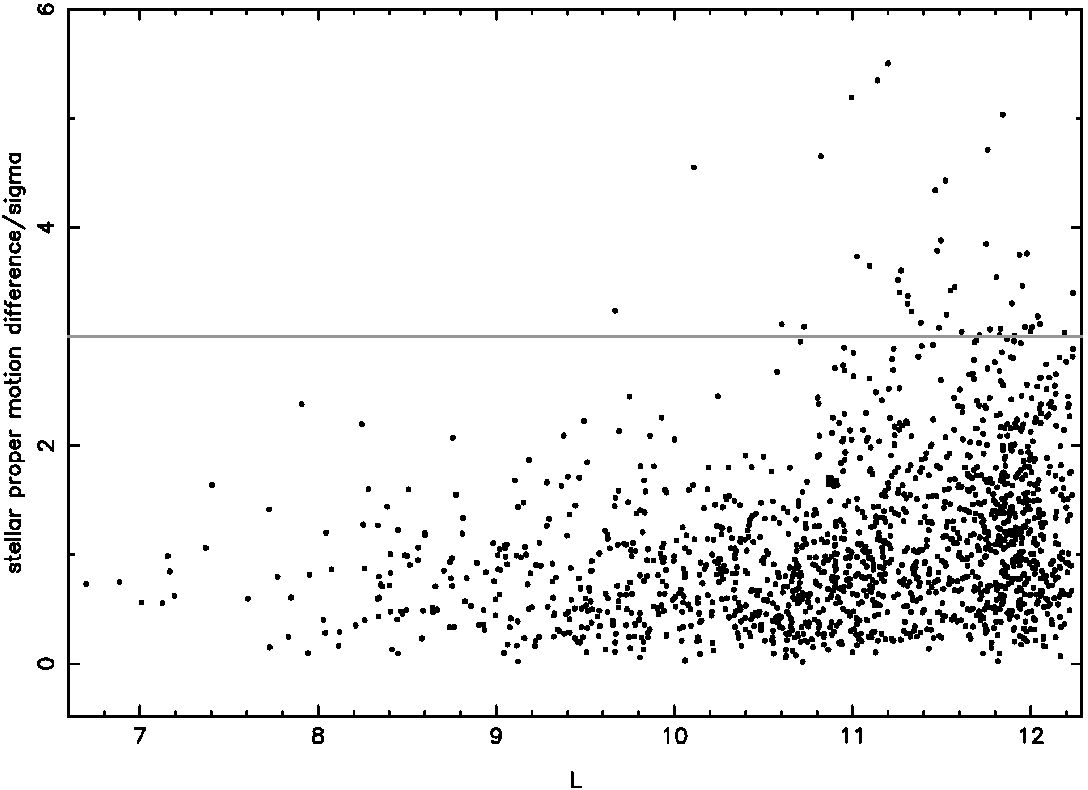
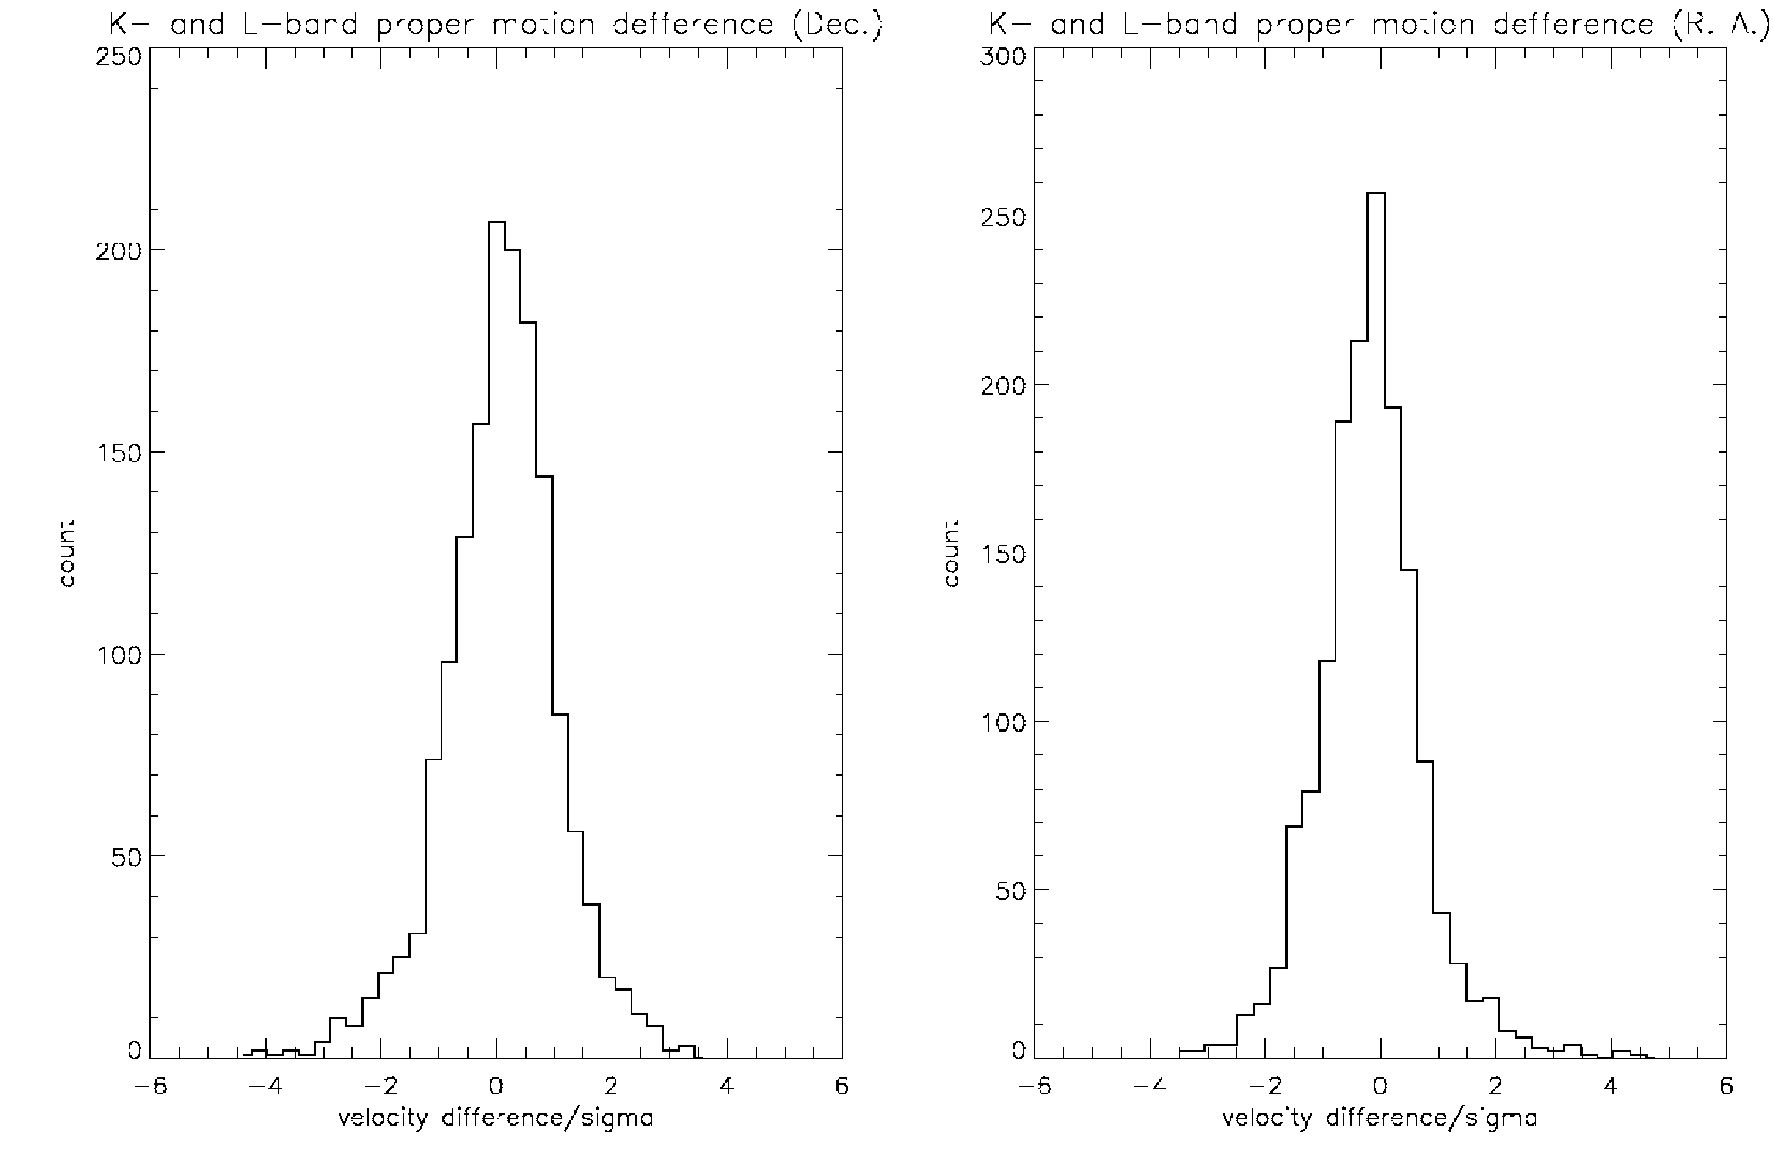
As can be seen from Fig. 9, 97 of our KS- and L’-band stellar proper motion results are in agreement to within 3. Also, there is no systematic offset between proper motion difference when projected in R. A. and Dec. (see histograms in Fig. 10). This demonstrates that the L’-band image transformation we used produces astrometric frames. As an example, we list in Table A.1. proper motions for some of the sources in the central parsec obtained in our study (KS- and L’). We also add the values published in Genzel et al. (2000). The uncertainties of the proper motions represent the 1 deviation of the linear fit.
Appendix B Proper motion of the filament NE4
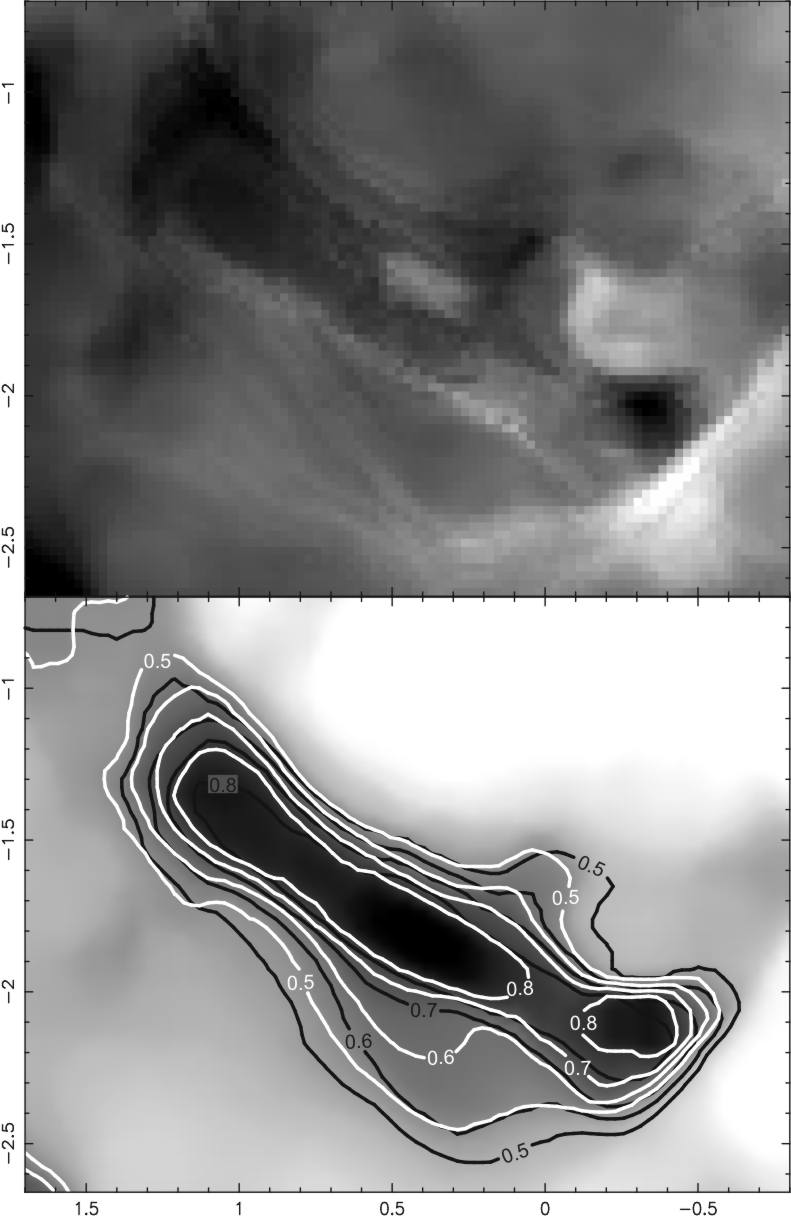
The proper motion of the extended filament NE4 was derived from images of the fitted background flux density which are free of contaminating flux contributions from stars. Here we show, that the motion towards the south west can already be seen but is hard to quantify from the difference image (Fig. 11). From a comparison of contour plots the motion can be estimated to first order (Fig. 11). The actual value of the proper motion was derived using the cross-correlation method described in the main text.
Appendix C A partially collimated outflow?
C.1 H2 emission from the CND lobes
Gatley et al. (1984, 1986); Burton & Allen (1992) and Yusef-Zadeh et al. (2001) report H2(1-0) S(1) molecular hydrogen line emission from the CND that is concentrated on the northern and southern lobes. Based on HST NICMOS and ground based data and adopting a lower limit to the extinction toward the lobes of AK=3 (Scoville et al. 2003), Yusef-Zadeh et al. (2001) derive the extinction-corrected peak line intensity from the lobes as approximately to be about a factor =3-4 higher than the mean surface brightness of the CND. The source of excitation of the H2 emission associated with the CND is unclear. Most commonly it is assumed that the 70o inclination of the 0.5 pc thick CND torus toward the line of sight will produce the north and south lobes by limb brightening of the 0.5 pc torus (e.g. Gatley et al. 1986; Burton & Allen 1992; Yusef-Zadeh et al. 2001). As summarized by Yusef-Zadeh et al. (2001), neither the intense UV filed combined with the high densities, nor the shock processes due to isotropic wind originating from the hot stars at the central parsec, can explain such a high intensity of molecular hydrogen emission on the CND lobes. The latter consideration shows that the ram pressure of an isotropic wind from IRS 16 cluster would be at least a factor =5 too low compared to what is required.
C.2 Model
In this section we consider the possibility that the outflow originating from the central part of the Galaxy, presumably from the cluster of high mass losing stars, with a possible contribution from the massive black hole itself, might actually be partially collimated. In the case of the existence of a wind from SgrA*, the collimation would have to be seen as a consequence of the yet unexplained accretion process onto the black hole but could be linked to the plane in which the mass-losing He-stars are moving in. This motion within a single plane implies that the viscous friction of gas being blown into that plane is larger than that for gas being blown out perpendicular to it. On the one hand that results in a pressure gradient perpendicular to the plane, on the other hand it will result in an accretion flow within that plane onto the central black hole and may give rise to a corresponding outflow perpendicular to it. So both the ordered motion of the mass-losing stars as well as the resulting structured accretion flow may result in a combined, possibly collimated outflow.
This scenario would also explain the bow shock ”tail” of the IRS 7 and the northern and southern lobes within the CND to be associated with the outflow. If we assume that the H2 line emission from the lobes is dominated by the interaction with a collimated wind rather than an approximately isotropic stellar wind from the central few arcseconds then - due to the limited size of the two lobes in the CND - a geometrical concentration of the outflow over an isotropic flow by a factor 50 has to be taken into account. We note that such an outflow could also have a grazing incident onto the CND (see Fig. 13). In this case the opening angle could be larger and the compression factor smaller. We also infer the lower limit on the collimated outflow velocity from the fact that NE1, the northern most filament, has an insignificant proper motion perpendicular to its extent and that filaments NE3 and NE4 which are likely to be more affected by the IRS 16 cluster wind have proper motion velocities of 150 km s-1. When generated in the Northern Arm at angular distances of 3 to 7 arcseconds from the IRS 16 cluster or SgrA* and taking as an upper limit of the proper motion inferred by a collimated outflow, then a lower limit to the velocity of that flow with a total opening angle of =20o-30o may be of the order of /tan() 500-900 km s-1. The total required mass-loss carried by the collimated outflow is then
| (1) |
This implies that such an outflow can easily be driven from the mass loss wind of the stellar cluster, that is blown away from the stellar disk or SgrA* itself, rather than being accreted onto SgrA*.
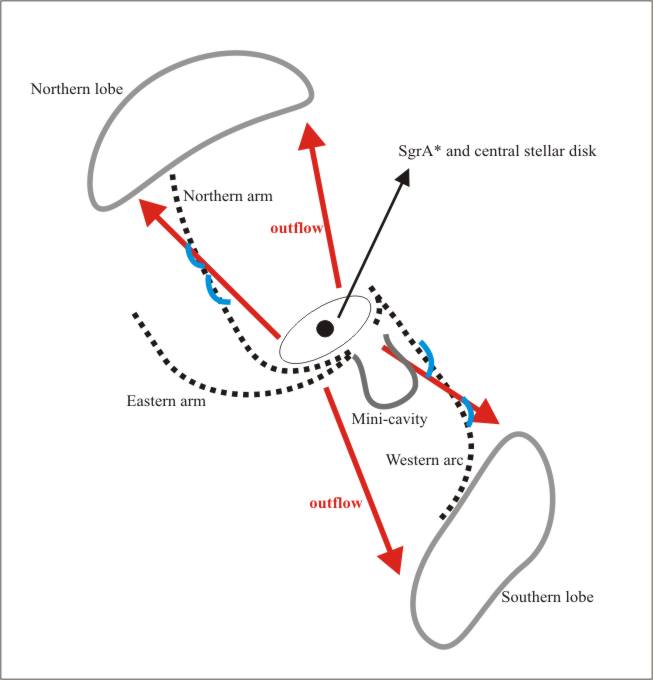
Whether in the presence of the deep central potential provided by the 3.6106M⊙ black hole the wind contribution is dominated by the stars or by SgrA* has to be investigated via detailed hydro-dynamical model calculations. In the context of the mini-cavity such calculations have been carried out by Melia et al. (1996) and most recently by Cuadra et al. (2006). The authors have shown that the structure, kinematics, and luminosity of the mini-cavity are consistent with a model in which a few 106M⊙ black hole interacts with an ambient 500-700 km s-1 Galactic Center wind originating within the IRS 16 cluster. It accretes a small portion of it and then may expel the rest in form of a collimated flow toward the mini-spiral streamer (Melia et al. 1996). The filaments along the Northern Arm presented here, the shape of the Northern Arm, as well as the approximate alignments between the rotation axis of the He-star disk and the connecting line between the northern and southern lobes in the CND (see references given above) present evidence for a similar collimated flow to the northeast.
C.3 3-Dimensional Orientation
In the following we discuss the space orientation of the main structures at the Galactic Center, as well as the orientation of the proposed outflow.
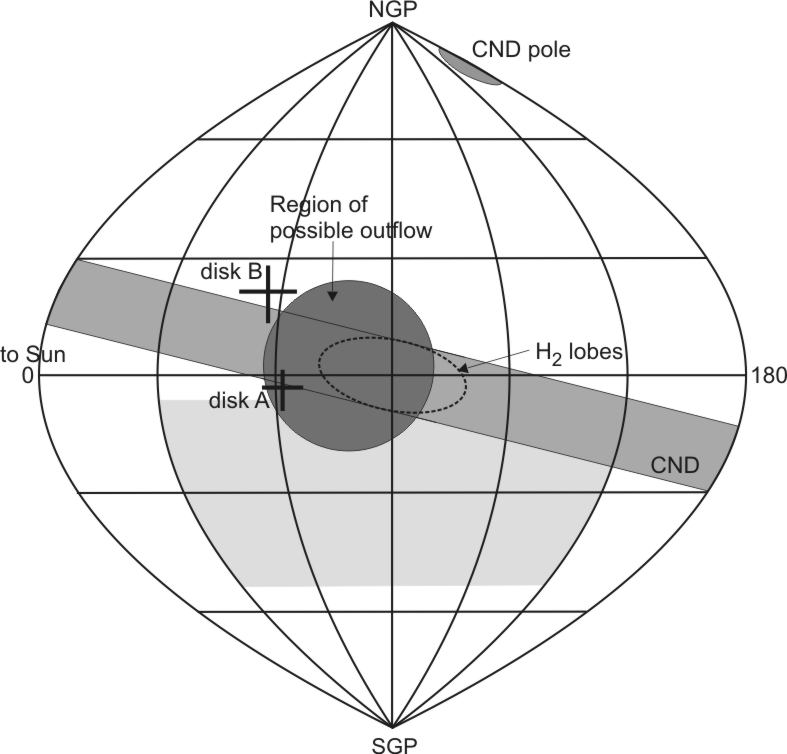
The observed geometry in the plane of the sky is such that the Northern Arm filaments and the mini-cavity are on almost opposite sides and on a well defined connection line through SgrA*. This line also coincides with the strip of low extinction presented by Schödel et al. (2007). The wind that we consider responsible for the filaments along the Northern Arm and the formation of the mini-cavity as well, is strongly interacting with the gas in the gas disk presented by Vollmer & Duschl (2000). This disk contains the Northern Arm and the part of the Bar, and connects well with the CND at an inclination of 30o to the line of sight. The disk is inclined 25o to the line of sight and has the position angle of 28o on the sky (N to E). Both CND and the Northern Arm are at a relatively low inclination to the plane of the Galaxy (Vollmer & Duschl 2000; Paumard et al. 2004). Thus we conclude that the wind could in fact be collimated with an opening angle of the order of 30o or less. Another indication for an outflow to the northeast comes from the wavy structure of the Northern Arm. Here Yusef-Zadeh & Wardle (1993) already noted that the distortions of the arm are produced by ram pressure of the wind incident on the surface of the arm and inducing there Rayleigh-Taylor or Kelvin-Helmholtz instabilities.
The position angle of the outflow projected on the sky is close to that of the galactic plane. This would also be in good agreement with the extent of the northern and southern lobes in the H2 emission of the CND. These lobes are located at the outer tips of the projected ellipse of the rotating CND. Therefore the lobes must be located approximately within the plane of the sky and within the Galactic plane.
This comparison also shows that the rotation axis of the hot He-stars (Genzel et al. 2000, 2003; Levin & Beloborodov 2003; Paumard et al. 2006) and the axis of the outflow may in fact be aligned to within less then 30o. Both results for the disk of clockwise-moving stars from Levin & Beloborodov 2003 (disk A) and Paumard et al. 2006 (disk B) are shown in the Fig. 13. The rotational axis of the disk A is closer to the direction of the postulated outflow than the axis of the disk B. The reason for this behavior could be the choice of the stellar sample in both measurements. The sample in Levin & Beloborodov (2003) includes 10 of the 13 brightest brightest He stars, most of them designated as Ofpe/WN9 stars by Paumard et al. (2006). Disk A therefore contains the largest number of heavily mass-loosing stars.
Eckart et al. (2006) obtained polarization measurements of SgrA* at two observing epochs (July 2005 and June 2004) and report the mean position angle of the E-vector to be about 60o with a swing in polarization angle of up to 40-50o. Meyer et al. (2006a) find that the inclination of the possible accretion disk around SgrA* has a lower limit of about 30o. It is interesting to point out that the range over which polarization angle varies on the plane of the sky, centered on SgrA* (see Fig. 8 in Eckart et al. 2006), approximately coincides with the opening angle of the central outflow proposed in this work. These two phenomena could be connected under the assumption that the accretion disk, or the possible jet, may be polarized and the E-vector is positioned perpendicularly to the accretion disk, or along the jet (see the discussion in Eckart et al. 2006 and Meyer et al. 2006a). Fig 13 shows the orientations of the discussed structures for an observer at the center of the Galaxy.
Acknowledgements.
We thank P. Pejovic for providing his K-band stellar proper motion measurements. Part of this work was supported by the (DFG) via SFB 494. K. Mužić and L. Meyer were supported for this research through a stipend from the International Max Planck Research School (IMPRS) for Radio and Infrared Astronomy at the Universities of Bonn and Cologne.References
- Aitken et al. (1991) Aitken, D. K., , Gezari, D., et al. 1991, ApJ, 380, 419
- Aitken et al. (1998) Aitken, D. K., Smith, C. H., Moore, T. J. T., & Roche, P. F. 1998, MNRAS, 299, 743
- Baganoff et al. (2001) Baganoff, F. K., Bautz, M. W., Brandt, W. N., et al. 2001, Nature, 413, 45
- Baganoff et al. (2003) Baganoff, F. K., Maeda, Y., Morris, M., et al. 2003, ApJ, 591, 891
- Beloborodov et al. (2006) Beloborodov, A. M., Levin, Y., Eisenhauer, F., et al. 2006, ApJ, 648, 405
- Blandford & Begelman (1999) Blandford, R. & Begelman, M. 1999, MNRAS, 303, L1
- Blum et al. (1995) Blum, R. D., DePoy, D. L., & Sellgren, K. 1995, ApJ, 441, 603
- Bower et al. (2003) Bower, G. C., Wright, M. C. H., Falcke, H., & Backer, D. C. 2003, ApJ, 588, 331
- Brandner et al. (2002) Brandner, W., Rousset, G., Lenzen, R., et al. 2002, Messenger, 107, 1
- Burton & Allen (1992) Burton, M. & Allen, D. 1992, PASAu, 10, 55
- Chan et al. (1997) Chan, K.-W., Moseley, S. H., Casey, S., et al. 1997, ApJ, 483, 798
- Clénet et al. (2004) Clénet, Y., Rouan, D., Gendron, E., et al. 2004, A&A, 417, L15
- Clénet et al. (2001) Clénet, Y., Rouan, D., Gendron, E., et al. 2001, A&A, 376, 124
- Coker et al. (1999) Coker, R., Melia, F., & Falcke, H. 1999, ApJ, 523, 642
- Cuadra et al. (2006) Cuadra, J., Nayakshin, S., Springel, V., & Di Matteo, T. 2006, MNRAS, 366, 358
- Diolaiti et al. (2000) Diolaiti, E., Bendinelli, O., Bonaccini, D., et al. 2000, A&AS, 147, 335
- Eckart et al. (2004) Eckart, A., Baganoff, F. K., Morris, M., et al. 2004, A&A, 427, 1
- Eckart & Duhoux (1990) Eckart, A. & Duhoux, P. R. M. 1990, in ASP Confrence Series, Volume 14, Astrophysics with Infrared Arrays (San Francisco: ASP), ed. R. Elston, 336
- Eckart & Genzel (1996) Eckart, A. & Genzel, R. 1996, in ASP Confrence Series, Volume 102, The Galactic Center, ed. R. Gredel, 196
- Eckart et al. (1995) Eckart, A., Genzel, R., Hofmann, R., Sams, B. J., & Tacconi-Garman, L. E. 1995, ApJ, 445, L23
- Eckart et al. (1992) Eckart, A., Genzel, R., Krabbe, A., et al. 1992, Nature, 355, 526
- Eckart et al. (2002) Eckart, A., Genzel, R., Ott, T., & Schödel, R. 2002, MNRAS, 331, 917
- Eckart et al. (1999) Eckart, A., Ott, T., & Genzel, R. 1999, A&A, 352, L22
- Eckart et al. (2006) Eckart, A., Schödel, R., Meyer, L., et al. 2006, A&A, 455, 1
- Eisenhauer et al. (2005) Eisenhauer, F., Genzel, R., Alexander, T., et al. 2005, ApJ, 628, 246
- Eisenhauer et al. (2003) Eisenhauer, F., Schödel, R., Genzel, R., et al. 2003, ApJ, 597, L121
- Falcke & Markoff (2000) Falcke, H. & Markoff, S. 2000, A&A, 362, 113
- Gatley et al. (1984) Gatley, I., Beattie, D., Lee, T., Jones, T., & Hyland, A. 1984, MNRAS, 210, 565
- Gatley et al. (1986) Gatley, I., Jones, T., Hyland, A., Wade, R., & Geballe, T. 1986, MNRAS, 222, 299
- Genzel et al. (1997) Genzel, R., Eckart, A., Ott, T., & Eisenhauer, F. 1997, MNRAS, 291, 219
- Genzel et al. (2000) Genzel, R., Pichon, C., Eckart, A., Gerhard, O. E., & Ott, T. 2000, MNRAS, 317, 348
- Genzel et al. (2003) Genzel, R., Schödel, R., Ott, T., et al. 2003, ApJ, 594, 812
- Genzel et al. (1996) Genzel, R., Thatte, N., Krabbe, A., Kroker, H., & Tacconi-Garman, L. E. 1996, ApJ, 472, 153
- Ghez et al. (1998) Ghez, A. M., Klein, B. L., Morris, M., & Becklin, E. E. 1998, ApJ, 509, 678
- Ghez et al. (2000) Ghez, A. M., Morris, M., Becklin, E. E., Tanner, A., & Kremenek, T. 2000, Nature, 407, 349
- Ghez et al. (2005) Ghez, A. M., Salim, S., Hornstein, S. D., et al. 2005, ApJ, 620, 744
- Güsten et al. (1987) Güsten, R., Genzel, R., Wright, M. C. H., et al. 1987, ApJ, 318, 124
- Hartigan et al. (1987) Hartigan, P., Raymond, J., & Hartmann, L. 1987, ApJ, 316, 323
- Herrnstein & Ho (2002) Herrnstein, R. & Ho, P. 2002, ApJL, 579, L83
- Jackson et al. (1993) Jackson, J. M., Geis, N., Genzel, R., et al. 1993, ApJ, 402, 173
- Krabbe et al. (1995) Krabbe, A., Genzel, R., Eckart, A., et al. 1995, ApJ, 447, L95
- Lacy et al. (1991) Lacy, J. H., Achtermann, J. M., & Serabyn, E. 1991, ApJL, 380, L71
- Lenzen et al. (1998) Lenzen, R., Hofmann, R., Bizenberger, P., & Tusche, A. 1998, in Proc. SPIE Vol. 3354, Infrared Astronomical Instrumentation, ed. A. M. Fowler, 606
- Levin & Beloborodov (2003) Levin, Y. & Beloborodov, A. 2003, ApJL, 590, L33
- Lutz et al. (1993) Lutz, D., Krabbe, A., & Genzel, R. 1993, ApJ, 418, 244
- Markoff & Falcke (2003) Markoff, S. & Falcke, H. 2003, Astron.Nachr., 324, 3
- Marrone et al. (2006) Marrone, D. P., Moran, J. M., Zhao, J.-H., & Rao, R. 2006, ApJ, 640, 308M
- Melia et al. (1996) Melia, F., Coker, R., & Yusef-Zadeh, F. 1996, ApJL, 460, L33
- Melia & Falcke (2001) Melia, F. & Falcke, H. 2001, A.R.A & A., 39, 309
- Meyer et al. (2006a) Meyer, L., Eckart, A., Schödel, R., et al. 2006a, A&A, 460, 15
- Meyer et al. (2006b) Meyer, L., Schödel, R., Eckart, A., et al. 2006b, A&A, 458, 25
- Morris (2000) Morris, M. & Maillard, J.-P. 2000, in ASP Confrence Series, Volume 195, Imaging the Universe in Three Dimensions: Astrophysics with Advanced Multi-Wavelenght Imaging Devices., ed. W. van Breugel & J. Bland-Hawthorn, 196
- Najarro et al. (1997) Najarro, F., Krabbe, A., Genzel, R., et al. 1997, A&A, 325, 700
- Ott et al. (1999) Ott, T., Eckart, A., & Genzel, R. 1999, ApJ, 523, 248
- Paumard et al. (2006) Paumard, T., Genzel, R., Martins, F., et al. 2006, ApJ, 643, 1011
- Paumard et al. (2004) Paumard, T., Maillard, J.-P., & Morris. 2004, A&A, 426, 81
- Paumard et al. (2001) Paumard, T., Maillard, J.-P., Morris, M., & Rigaut, F. 2001, A&A, 366, 466
- Pott et al. (2007) Pott, J.-U., Eckart, A., Glindemann, A., et al. 2007, submitted to A & A
- Quataert (2003) Quataert, E. 2003, Astron. Nachr., 324, 3
- Reid (1993) Reid, M. J. 1993, A.R.A & A, 31, 345
- Rieke et al. (1989) Rieke, G. H., Rieke, M. J., & Paul, A. E. 1989, ApJ, 336, 752
- Roberts & Goss (1993) Roberts, D. A. & Goss, W. M. 1993, ApJ.Suppl., 86, 133
- Roberts et al. (1996) Roberts, D. A., Yusef-Zadeh, F., & Goss, W. M. 1996, ApJ, 459, 627
- Rousset et al. (1998) Rousset, G., Lacombe, F., Puget, P., et al. 1998, in Proc. SPIE Vol. 3353, Adaptive Optical System Technologies, ed. D. Bonaccini, 516
- Schödel et al. (2007) Schödel, R., Eckart, A., Alexander, T., et al. 2007, astro-ph/0703178, accepted by A & A
- Schödel et al. (2003) Schödel, R., Ott, T., Genzel, R., et al. 2003, ApJ, 596, 1015
- Scoville et al. (2003) Scoville, N. Z., Stolovy, S. R., Rieke, M., Christopher, M., & Yusef-Zadeh, F. 2003, ApJ, 594, 294
- Tanner et al. (2005) Tanner, A., Ghez, A. M., Morris, M. R., & Christou, J. C. 2005, ApJ, 624, 742
- Viehmann et al. (2005) Viehmann, T., Eckart, A., Schödel, R., et al. 2005, A&A, 433, 117
- Viehmann et al. (2006) Viehmann, T., Eckart, A., Schödel, R., Pott, J.-U., & Moultaka, J. 2006, ApJ, 642, 861
- Vollmer & Duschl (2000) Vollmer, B. & Duschl, W. 2000, New Astronomy, 4, 581
- Vollmer & Duschl (2001) Vollmer, B. & Duschl, W. 2001, A&A, 367, 72
- Wright et al. (2001) Wright, M., Coil, A., McGary, R., Ho, P., & Harris, A. 2001, ApJ, 551, 254
- Yuan (2006) Yuan, F. 2006, in Journal of Physics: Conference Series, Volume 54, Issue 1, ed. D. Bonaccini, 427
- Yuan et al. (2002) Yuan, F., Markoff, S., & Falcke, H. 2002, A&A, 383, 854
- Yusef-Zadeh & Melia (1992) Yusef-Zadeh, F. & Melia, F. 1992, ApJL, 385, L41
- Yusef-Zadeh et al. (1990) Yusef-Zadeh, F., Morris, M., & Ekers, R. D. 1990, Nature, 348, 45
- Yusef-Zadeh et al. (1998) Yusef-Zadeh, F., Roberts, D. A., & Biretta, J. 1998, ApJL, 499, L159
- Yusef-Zadeh et al. (2001) Yusef-Zadeh, F., Stolovy, S. R., Burton, M., Wardle, M., & Ashley, M. C. B. 2001, ApJ, 560, 749
- Yusef-Zadeh & Wardle (1993) Yusef-Zadeh, F. & Wardle, M. 1993, ApJ, 405, 584
- Zhao & Goss (1998) Zhao, J.-H. & Goss, W. 1998, ApJL, 499, L163
- Zylka et al. (1995) Zylka, R., Mezger, P., Ward-Thompson, D., Duschl, W. J., & Lesch, H. 1995, A&A, 297, 83