B. Aubert
M. Bona
D. Boutigny
Y. Karyotakis
J. P. Lees
V. Poireau
X. Prudent
V. Tisserand
A. Zghiche
Laboratoire de Physique des Particules, IN2P3/CNRS et Université de Savoie, F-74941 Annecy-Le-Vieux, France
J. Garra Tico
E. Grauges
Universitat de Barcelona, Facultat de Fisica, Departament ECM, E-08028 Barcelona, Spain
L. Lopez
A. Palano
Università di Bari, Dipartimento di Fisica and INFN, I-70126 Bari, Italy
G. Eigen
B. Stugu
L. Sun
University of Bergen, Institute of Physics, N-5007 Bergen, Norway
G. S. Abrams
M. Battaglia
D. N. Brown
J. Button-Shafer
R. N. Cahn
Y. Groysman
R. G. Jacobsen
J. A. Kadyk
L. T. Kerth
Yu. G. Kolomensky
G. Kukartsev
D. Lopes Pegna
G. Lynch
L. M. Mir
T. J. Orimoto
M. T. Ronan
K. Tackmann
W. A. Wenzel
Lawrence Berkeley National Laboratory and University of California, Berkeley, California 94720, USA
P. del Amo Sanchez
C. M. Hawkes
A. T. Watson
University of Birmingham, Birmingham, B15 2TT, United Kingdom
T. Held
H. Koch
B. Lewandowski
M. Pelizaeus
T. Schroeder
M. Steinke
Ruhr Universität Bochum, Institut für Experimentalphysik 1, D-44780 Bochum, Germany
D. Walker
University of Bristol, Bristol BS8 1TL, United Kingdom
D. J. Asgeirsson
T. Cuhadar-Donszelmann
B. G. Fulsom
C. Hearty
N. S. Knecht
T. S. Mattison
J. A. McKenna
University of British Columbia, Vancouver, British Columbia, Canada V6T 1Z1
A. Khan
M. Saleem
L. Teodorescu
Brunel University, Uxbridge, Middlesex UB8 3PH, United Kingdom
V. E. Blinov
A. D. Bukin
V. P. Druzhinin
V. B. Golubev
A. P. Onuchin
S. I. Serednyakov
Yu. I. Skovpen
E. P. Solodov
K. Yu Todyshev
Budker Institute of Nuclear Physics, Novosibirsk 630090, Russia
M. Bondioli
S. Curry
I. Eschrich
D. Kirkby
A. J. Lankford
P. Lund
M. Mandelkern
E. C. Martin
D. P. Stoker
University of California at Irvine, Irvine, California 92697, USA
S. Abachi
C. Buchanan
University of California at Los Angeles, Los Angeles, California 90024, USA
S. D. Foulkes
J. W. Gary
F. Liu
O. Long
B. C. Shen
L. Zhang
University of California at Riverside, Riverside, California 92521, USA
H. P. Paar
S. Rahatlou
V. Sharma
University of California at San Diego, La Jolla, California 92093, USA
J. W. Berryhill
C. Campagnari
A. Cunha
B. Dahmes
T. M. Hong
D. Kovalskyi
J. D. Richman
University of California at Santa Barbara, Santa Barbara, California 93106, USA
T. W. Beck
A. M. Eisner
C. J. Flacco
C. A. Heusch
J. Kroseberg
W. S. Lockman
T. Schalk
B. A. Schumm
A. Seiden
D. C. Williams
M. G. Wilson
L. O. Winstrom
University of California at Santa Cruz, Institute for Particle Physics, Santa Cruz, California 95064, USA
E. Chen
C. H. Cheng
F. Fang
D. G. Hitlin
I. Narsky
T. Piatenko
F. C. Porter
California Institute of Technology, Pasadena, California 91125, USA
G. Mancinelli
B. T. Meadows
K. Mishra
M. D. Sokoloff
University of Cincinnati, Cincinnati, Ohio 45221, USA
F. Blanc
P. C. Bloom
S. Chen
W. T. Ford
J. F. Hirschauer
A. Kreisel
M. Nagel
U. Nauenberg
A. Olivas
J. G. Smith
K. A. Ulmer
S. R. Wagner
J. Zhang
University of Colorado, Boulder, Colorado 80309, USA
A. M. Gabareen
A. Soffer
W. H. Toki
R. J. Wilson
F. Winklmeier
Q. Zeng
Colorado State University, Fort Collins, Colorado 80523, USA
D. D. Altenburg
E. Feltresi
A. Hauke
H. Jasper
J. Merkel
A. Petzold
B. Spaan
K. Wacker
Universität Dortmund, Institut für Physik, D-44221 Dortmund, Germany
T. Brandt
V. Klose
M. J. Kobel
H. M. Lacker
W. F. Mader
R. Nogowski
J. Schubert
K. R. Schubert
R. Schwierz
J. E. Sundermann
A. Volk
Technische Universität Dresden, Institut für Kern- und Teilchenphysik, D-01062 Dresden, Germany
D. Bernard
G. R. Bonneaud
E. Latour
V. Lombardo
Ch. Thiebaux
M. Verderi
Laboratoire Leprince-Ringuet, CNRS/IN2P3, Ecole Polytechnique, F-91128 Palaiseau, France
P. J. Clark
W. Gradl
F. Muheim
S. Playfer
A. I. Robertson
Y. Xie
University of Edinburgh, Edinburgh EH9 3JZ, United Kingdom
M. Andreotti
D. Bettoni
C. Bozzi
R. Calabrese
A. Cecchi
G. Cibinetto
P. Franchini
E. Luppi
M. Negrini
A. Petrella
L. Piemontese
E. Prencipe
V. Santoro
Università di Ferrara, Dipartimento di Fisica and INFN, I-44100 Ferrara, Italy
F. Anulli
R. Baldini-Ferroli
A. Calcaterra
R. de Sangro
G. Finocchiaro
S. Pacetti
P. Patteri
I. M. Peruzzi
Also with Università di Perugia, Dipartimento di Fisica, Perugia, Italy
M. Piccolo
M. Rama
A. Zallo
Laboratori Nazionali di Frascati dell’INFN, I-00044 Frascati, Italy
A. Buzzo
R. Contri
M. Lo Vetere
M. M. Macri
M. R. Monge
S. Passaggio
C. Patrignani
E. Robutti
A. Santroni
S. Tosi
Università di Genova, Dipartimento di Fisica and INFN, I-16146 Genova, Italy
K. S. Chaisanguanthum
M. Morii
J. Wu
Harvard University, Cambridge, Massachusetts 02138, USA
R. S. Dubitzky
J. Marks
S. Schenk
U. Uwer
Universität Heidelberg, Physikalisches Institut, Philosophenweg 12, D-69120 Heidelberg, Germany
D. J. Bard
P. D. Dauncey
R. L. Flack
J. A. Nash
M. B. Nikolich
W. Panduro Vazquez
Imperial College London, London, SW7 2AZ, United Kingdom
P. K. Behera
X. Chai
M. J. Charles
U. Mallik
N. T. Meyer
V. Ziegler
University of Iowa, Iowa City, Iowa 52242, USA
J. Cochran
H. B. Crawley
L. Dong
V. Eyges
W. T. Meyer
S. Prell
E. I. Rosenberg
A. E. Rubin
Iowa State University, Ames, Iowa 50011-3160, USA
A. V. Gritsan
Z. J. Guo
C. K. Lae
Johns Hopkins University, Baltimore, Maryland 21218, USA
A. G. Denig
M. Fritsch
G. Schott
Universität Karlsruhe, Institut für Experimentelle Kernphysik, D-76021 Karlsruhe, Germany
N. Arnaud
J. Béquilleux
M. Davier
G. Grosdidier
A. Höcker
V. Lepeltier
F. Le Diberder
A. M. Lutz
S. Pruvot
S. Rodier
P. Roudeau
M. H. Schune
J. Serrano
V. Sordini
A. Stocchi
W. F. Wang
G. Wormser
Laboratoire de l’Accélérateur Linéaire, IN2P3/CNRS et Université Paris-Sud 11, Centre Scientifique d’Orsay, B. P. 34, F-91898 ORSAY Cedex, France
D. J. Lange
D. M. Wright
Lawrence Livermore National Laboratory, Livermore, California 94550, USA
C. A. Chavez
I. J. Forster
J. R. Fry
E. Gabathuler
R. Gamet
D. E. Hutchcroft
D. J. Payne
K. C. Schofield
C. Touramanis
University of Liverpool, Liverpool L69 7ZE, United Kingdom
A. J. Bevan
K. A. George
F. Di Lodovico
W. Menges
R. Sacco
Queen Mary, University of London, E1 4NS, United Kingdom
G. Cowan
H. U. Flaecher
D. A. Hopkins
P. S. Jackson
T. R. McMahon
F. Salvatore
A. C. Wren
University of London, Royal Holloway and Bedford New College, Egham, Surrey TW20 0EX, United Kingdom
D. N. Brown
C. L. Davis
University of Louisville, Louisville, Kentucky 40292, USA
J. Allison
N. R. Barlow
R. J. Barlow
Y. M. Chia
C. L. Edgar
G. D. Lafferty
T. J. West
J. I. Yi
University of Manchester, Manchester M13 9PL, United Kingdom
J. Anderson
C. Chen
A. Jawahery
D. A. Roberts
G. Simi
J. M. Tuggle
University of Maryland, College Park, Maryland 20742, USA
G. Blaylock
C. Dallapiccola
S. S. Hertzbach
X. Li
T. B. Moore
E. Salvati
S. Saremi
University of Massachusetts, Amherst, Massachusetts 01003, USA
R. Cowan
P. H. Fisher
G. Sciolla
S. J. Sekula
M. Spitznagel
F. Taylor
R. K. Yamamoto
Massachusetts Institute of Technology, Laboratory for Nuclear Science, Cambridge, Massachusetts 02139, USA
S. E. Mclachlin
P. M. Patel
S. H. Robertson
McGill University, Montréal, Québec, Canada H3A 2T8
A. Lazzaro
F. Palombo
Università di Milano, Dipartimento di Fisica and INFN, I-20133 Milano, Italy
J. M. Bauer
L. Cremaldi
V. Eschenburg
R. Godang
R. Kroeger
D. A. Sanders
D. J. Summers
H. W. Zhao
University of Mississippi, University, Mississippi 38677, USA
S. Brunet
D. Côté
M. Simard
P. Taras
F. B. Viaud
Université de Montréal, Physique des Particules, Montréal, Québec, Canada H3C 3J7
H. Nicholson
Mount Holyoke College, South Hadley, Massachusetts 01075, USA
G. De Nardo
F. Fabozzi
Also with Università della Basilicata, Potenza, Italy
L. Lista
D. Monorchio
C. Sciacca
Università di Napoli Federico II, Dipartimento di Scienze Fisiche and INFN, I-80126, Napoli, Italy
M. A. Baak
G. Raven
H. L. Snoek
NIKHEF, National Institute for Nuclear Physics and High Energy Physics, NL-1009 DB Amsterdam, The Netherlands
C. P. Jessop
J. M. LoSecco
University of Notre Dame, Notre Dame, Indiana 46556, USA
G. Benelli
L. A. Corwin
K. K. Gan
K. Honscheid
D. Hufnagel
H. Kagan
R. Kass
J. P. Morris
A. M. Rahimi
J. J. Regensburger
R. Ter-Antonyan
Q. K. Wong
Ohio State University, Columbus, Ohio 43210, USA
N. L. Blount
J. Brau
R. Frey
O. Igonkina
J. A. Kolb
M. Lu
R. Rahmat
N. B. Sinev
D. Strom
J. Strube
E. Torrence
University of Oregon, Eugene, Oregon 97403, USA
N. Gagliardi
A. Gaz
M. Margoni
M. Morandin
A. Pompili
M. Posocco
M. Rotondo
F. Simonetto
R. Stroili
C. Voci
Università di Padova, Dipartimento di Fisica and INFN, I-35131 Padova, Italy
E. Ben-Haim
H. Briand
G. Calderini
J. Chauveau
P. David
L. Del Buono
Ch. de la Vaissière
O. Hamon
Ph. Leruste
J. Malclès
J. Ocariz
A. Perez
Laboratoire de Physique Nucléaire et de Hautes Energies, IN2P3/CNRS, Université Pierre et Marie Curie-Paris6, Université Denis Diderot-Paris7, F-75252 Paris, France
L. Gladney
University of Pennsylvania, Philadelphia, Pennsylvania 19104, USA
M. Biasini
R. Covarelli
E. Manoni
Università di Perugia, Dipartimento di Fisica and INFN, I-06100 Perugia, Italy
C. Angelini
G. Batignani
S. Bettarini
M. Carpinelli
R. Cenci
A. Cervelli
F. Forti
M. A. Giorgi
A. Lusiani
G. Marchiori
M. A. Mazur
M. Morganti
N. Neri
E. Paoloni
G. Rizzo
J. J. Walsh
Università di Pisa, Dipartimento di Fisica, Scuola Normale Superiore and INFN, I-56127 Pisa, Italy
M. Haire
Prairie View A&M University, Prairie View, Texas 77446, USA
J. Biesiada
P. Elmer
Y. P. Lau
C. Lu
J. Olsen
A. J. S. Smith
A. V. Telnov
Princeton University, Princeton, New Jersey 08544, USA
E. Baracchini
F. Bellini
G. Cavoto
A. D’Orazio
D. del Re
E. Di Marco
R. Faccini
F. Ferrarotto
F. Ferroni
M. Gaspero
P. D. Jackson
L. Li Gioi
M. A. Mazzoni
S. Morganti
G. Piredda
F. Polci
F. Renga
C. Voena
Università di Roma La Sapienza, Dipartimento di Fisica and INFN, I-00185 Roma, Italy
M. Ebert
H. Schröder
R. Waldi
Universität Rostock, D-18051 Rostock, Germany
T. Adye
G. Castelli
B. Franek
E. O. Olaiya
S. Ricciardi
W. Roethel
F. F. Wilson
Rutherford Appleton Laboratory, Chilton, Didcot, Oxon, OX11 0QX, United Kingdom
R. Aleksan
S. Emery
M. Escalier
A. Gaidot
S. F. Ganzhur
G. Hamel de Monchenault
W. Kozanecki
M. Legendre
G. Vasseur
Ch. Yèche
M. Zito
DSM/Dapnia, CEA/Saclay, F-91191 Gif-sur-Yvette, France
X. R. Chen
H. Liu
W. Park
M. V. Purohit
J. R. Wilson
University of South Carolina, Columbia, South Carolina 29208, USA
M. T. Allen
D. Aston
R. Bartoldus
P. Bechtle
N. Berger
R. Claus
J. P. Coleman
M. R. Convery
J. C. Dingfelder
J. Dorfan
G. P. Dubois-Felsmann
D. Dujmic
W. Dunwoodie
R. C. Field
T. Glanzman
S. J. Gowdy
M. T. Graham
P. Grenier
C. Hast
T. Hryn’ova
W. R. Innes
J. Kaminski
M. H. Kelsey
H. Kim
P. Kim
M. L. Kocian
D. W. G. S. Leith
S. Li
S. Luitz
V. Luth
H. L. Lynch
D. B. MacFarlane
H. Marsiske
R. Messner
D. R. Muller
C. P. O’Grady
I. Ofte
A. Perazzo
M. Perl
T. Pulliam
B. N. Ratcliff
A. Roodman
A. A. Salnikov
R. H. Schindler
J. Schwiening
A. Snyder
J. Stelzer
D. Su
M. K. Sullivan
K. Suzuki
S. K. Swain
J. M. Thompson
J. Va’vra
N. van Bakel
A. P. Wagner
M. Weaver
W. J. Wisniewski
M. Wittgen
D. H. Wright
A. K. Yarritu
K. Yi
C. C. Young
Stanford Linear Accelerator Center, Stanford, California 94309, USA
P. R. Burchat
A. J. Edwards
S. A. Majewski
B. A. Petersen
L. Wilden
Stanford University, Stanford, California 94305-4060, USA
S. Ahmed
M. S. Alam
R. Bula
J. A. Ernst
V. Jain
B. Pan
M. A. Saeed
F. R. Wappler
S. B. Zain
State University of New York, Albany, New York 12222, USA
W. Bugg
M. Krishnamurthy
S. M. Spanier
University of Tennessee, Knoxville, Tennessee 37996, USA
R. Eckmann
J. L. Ritchie
A. M. Ruland
C. J. Schilling
R. F. Schwitters
University of Texas at Austin, Austin, Texas 78712, USA
J. M. Izen
X. C. Lou
S. Ye
University of Texas at Dallas, Richardson, Texas 75083, USA
F. Bianchi
F. Gallo
D. Gamba
M. Pelliccioni
Università di Torino, Dipartimento di Fisica Sperimentale and INFN, I-10125 Torino, Italy
M. Bomben
L. Bosisio
C. Cartaro
F. Cossutti
G. Della Ricca
L. Lanceri
L. Vitale
Università di Trieste, Dipartimento di Fisica and INFN, I-34127 Trieste, Italy
V. Azzolini
N. Lopez-March
F. Martinez-Vidal
D. A. Milanes
A. Oyanguren
IFIC, Universitat de Valencia-CSIC, E-46071 Valencia, Spain
J. Albert
Sw. Banerjee
B. Bhuyan
K. Hamano
R. Kowalewski
I. M. Nugent
J. M. Roney
R. J. Sobie
University of Victoria, Victoria, British Columbia, Canada V8W 3P6
J. J. Back
P. F. Harrison
T. E. Latham
G. B. Mohanty
M. Pappagallo
Also with IPPP, Physics Department, Durham University, Durham DH1 3LE, United Kingdom
Department of Physics, University of Warwick, Coventry CV4 7AL, United Kingdom
H. R. Band
X. Chen
S. Dasu
K. T. Flood
J. J. Hollar
P. E. Kutter
Y. Pan
M. Pierini
R. Prepost
S. L. Wu
Z. Yu
University of Wisconsin, Madison, Wisconsin 53706, USA
H. Neal
Yale University, New Haven, Connecticut 06511, USA
Abstract
Using 385 fb-1 of collisions,
we study the amplitudes of the singly Cabibbo-suppressed decay . We
measure the strong phase difference between the and decays to
to be (stat)
(syst), and their amplitude ratio to be 0.599 0.013 (stat) 0.011
(syst). We observe contributions from the and scalar and
vector amplitudes, and analyze their angular moments. We find no evidence for
charged , nor for higher spin states. We also
perform a partial-wave analysis of the system in a limited mass
range.
pacs:
13.25.Ft, 12.15.Hh, 11.30.Er
The amplitudes describing meson weak decays into three-body final states
are dominated by intermediate resonances that lead to highly nonuniform
intensity distributions in the available phase space. Analyses of these
distributions have led to new insights into the role of the light-meson
systems produced motivation . The systems from the decay
note1 can provide information on the S-wave
(spin-0) amplitude in the mass range 0.6–1.4 , and hence on the
possible existence of the , reported to date only in the neutral
state () kappa . If the has isospin
, it should be observable also in the charged states. Results of the
present analysis can be an input for extracting the -violating phase
of the quark mixing matrix by exploiting interference structure in the Dalitz
plot from the decay abi ; myGamma .
Singly Cabibbo-suppressed decays are also important because they might be
sensitive to direct violation in charm decays kagan , the
discovery of which might indicate physics beyond the Standard Model.
We perform the present analysis on 385 fb-1 of
collision data collected at and around 10.58 GeV center-of-mass (CM) energy
with the BABAR detector detector at the PEP-II storage ring.
We distinguish from by reconstructing
the decays and . The
event-selection criteria are the same as those used in our measurement of
the branching ratio of the decay mybr . In particular, we
require that the CM momentum of candidate be greater than
2.77 , and that , where
refers to a reconstructed invariant mass. To minimize uncertainty
from background shape, we choose a sample of very high purity ()
using , and find signal events.
We estimate the signal efficiency for each event as a function of its
position in the Dalitz plot using simulated events from
decays, generated uniformly in the available phase space. To
correct for differences in particle-identification rates
in data and simulation, we determine the ratio of these for each track, and
apply an event-by-event correction factor.
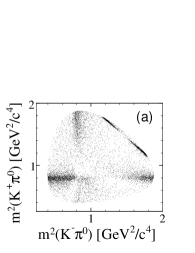
Neglecting violation in meson decays, we define the
() decay amplitude ()
in the Dalitz plot of Fig. 1, as:
(1)
(2)
The complex quantum mechanical amplitude is a coherent sum of all relevant
quasi-two-body isobar model isobar resonances,
. Here , and is the
resonance amplitude. We obtain coefficients and from
a likelihood fit. The probability density function for signal events
is . We model incoherent background empirically using
events from the lower sideband of the mybr distribution.
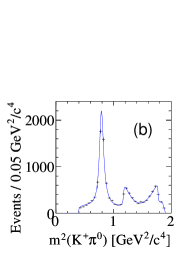
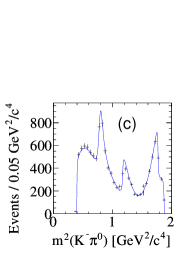
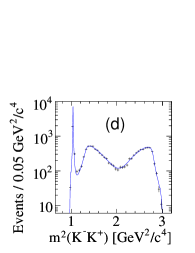
Figure 1: (Color online) Dalitz plot for note1
data (a), and the corresponding squared invariant mass projections (b–d).
The three-body invariant mass of the candidate is constrained to the
nominal value. In plots (b–d), the dots (with error bars, black) are data
points and the solid lines (blue) correspond to the best isobar fit models.
For decays to spin-1 (P-wave) and spin-2 states, we
use the Breit-Wigner amplitude,
(3)
(4)
where () is the resonance mass (width) pdg ,
is the angular momentum quantum number, is the momentum of either
daughter in the resonance rest frame, and is the value of when s =
. The function is the Blatt-Weisskopf barrier
factor bw : = 1, =
, and =
, where we take the meson radial parameter
to be 1.5 GeV-1valR . We define the spin part of the amplitude,
, as: = , =
-2 , and = [
]
, where is the nominal mass, and
is the 3-momentum of particle in the resonance rest frame.
For decays to S-wave states, we consider three
amplitude models. One model uses the LASS amplitude for
elastic scattering LASS ,
(5)
(6)
where () refers to the mass
(width), GeV, and
GeV. The unitary nature of Eq. 5 provides a good
description of the amplitude up to 1.45 (i.e.,
threshold). In Eq. 6, the first term is a nonresonant contribution
defined by a scattering length and an effective range , and the
second term represents the resonance. The phase space factor
converts the scattering amplitude to the invariant amplitude.
Our second model uses the E-791 results for the S-wave
amplitude from an energy-independent partial-wave analysis in the
decay brian . The third model uses a coherent
sum of a uniform nonresonant term, and Breit-Wigner terms for the
and resonances.
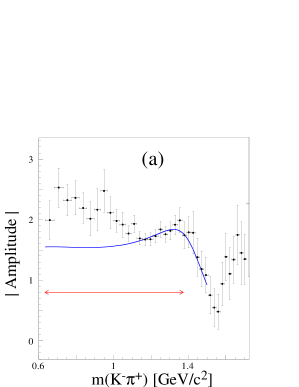
In Fig. 2 we compare the S-wave amplitude
from the E-791 analysis brian to the LASS amplitude of
Eqs. 5–6. For easy comparison, we have normalized the
LASS amplitude in Fig. 2a approximately to the E-791 measurements
with , and have reduced the LASS phase, ,
in Fig. 2b by . We then observe good agreements in the
mass dependence of amplitude and phase for . As the
mass decreases from 1.15 , the E-791 amplitude increases while the LASS
amplitude decreases, with the ratio finally reaching 1.7 at threshold.
At the same time, their phase difference increases to at
threshold. This behavior might be due to the form factor describing decay to a S-wave system and a bachelor . Since no
centrifugal barrier is involved, such an effect should be more significant
for S-wave than for higher spin waves because of the larger overlap
between the initial and final state wave functions. However, the inverse
momentum of the system in the rest frame increases
from 0.27 Fermi at threshold to 0.48 Fermi at 1.15 , therefore
any form factor effect would decrease with increasing mass. If the
effect is essentially gone by 1.15 , similar mass dependence of
amplitude and phase in decay and scattering would be observable
at higher mass values, in agreement with Fig. 2. In the present
analysis, we make an attempt to distinguish between the two rather different
S-wave mass dependences in the region below 1.15 .
In each case, we also allow the fit to determine the strength and phase of
these amplitudes relative to the reference.
Figure 2: (Color online) LASS (solid line, blue) and E-791 (dots with error
bars) S-wave amplitudes (a), in arbitrary units, and
phase (b). The double headed arrow (red) indicates the mass range available
in the decay .
We describe the decay to a S-wave state by a
coupled-channel Breit-Wigner amplitude for the and
resonances, with their respective couplings to , and
, final states flatte ,
(7)
Here represents Lorentz invariant phase space, .
For the , we use the BES bes parameter values
96510 , 16518 MeV2/c4, and
4.210.33. For the , we use the Crystal
Barrel crystalbarrel values 9992 ,
32415 , and 1.030.14.
Only the high mass tails of and are observable, as
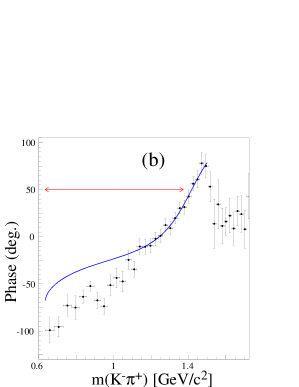
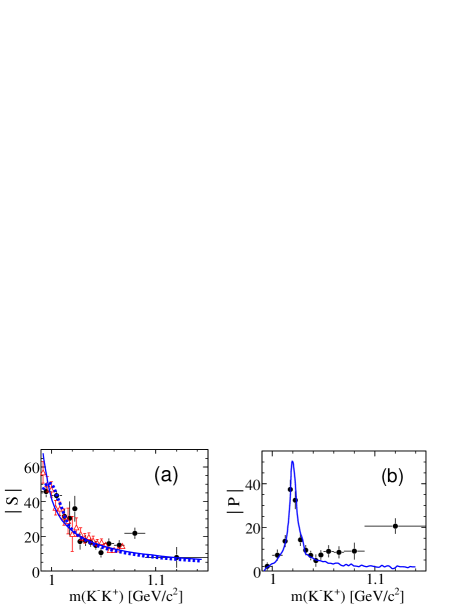
shown in Fig. 3a. They are similar, so we try a model for each as a
description of the S-wave amplitude. In Fig. 3b we
show, in the same mass range, the P-wave amplitude
parametrized by the meson.
Figure 3: (Color online) The phase-space-corrected S- and
P-wave amplitudes, and
respectively, in arbitrary units, as functions of the invariant
mass. (a) Lineshapes for (solid line, blue) , and (broken line,
blue) , derived from Eq. 7. (b) Lineshape for
(solid line, blue).
In each plot, solid circles with error bars correspond to values obtained from
the model-independent analysis for
and using Eq. 8.
In (a), the open triangles (red) correspond to values obtained from the decay
(see text).
Table 1: The results obtained from the Dalitz plot
fit. We define amplitude coefficients, and , relative to those
of the . The errors are statistical and systematic,
respectively. We show the contribution, when it is included in
place of the , in square brackets. We denote the
S-wave states here by . We use LASS amplitude
to describe the S-wave states in both the isobar models
(I and II).
Model I
Model II
State
Amplitude,
Phase, (∘)
Fraction,
(%)
Amplitude,
Phase, (∘)
Fraction, (%)
1.0 (fixed)
0.0 (fixed)
45.20.80.6
1.0 (fixed)
0.0 (fixed)
44.40.80.6
2.290.370.20
86.712.09.6
3.71.11.1
1.760.360.18
-179.821.312.3
16.33.42.1
3.660.110.09
-148.02.02.8
71.13.71.9
0.690.010.02
-20.713.69.3
19.30.60.4
0.700.010.02
18.03.73.6
19.40.60.5
0.510.070.04
-177.513.78.6
6.71.41.2
0.640.040.03
-60.82.53.0
10.51.11.2
[0.480.080.04]
[-154.014.18.6]
[6.01.81.2]
[0.680.060.03]
[-38.54.33.0]
[11.01.51.2]
1.110.380.28
-18.719.313.6
0.080.040.05
0.6010.0110.011
-37.01.92.2
16.00.80.6
0.5970.0130.009
-34.11.92.2
15.90.70.6
2.630.510.47
-172.06.66.2
4.81.81.2
0.700.270.24
133.222.525.2
2.71.40.8
0.850.090.11
108.47.88.9
3.90.91.0
To fit the Dalitz plot, we try several models incorporating
various combinations of intermediate states.
In each fit, we include the and measure the complex amplitude
coefficients of other states relative to it.
As a check on the quality of each fit, we compare the number of
events observed in bins in the Dalitz plot with the number predicted
by the fit. We compute residuals and statistical uncertainties
to form a , and take (where is the number
of bins less number of variable parameters) as a figure of merit. We also
compare the distributions of angular moments (described later) predicted
by the fit and actually observed in the data.
The LASS S-wave amplitude gives the best agreement
with data and we use it in our nominal fits (see next paragraph).
The S-wave modeled by the combination of (with
parameters taken from Ref. kappa ), a nonresonant term and
has a smaller fit probability ( probability 5%).
The best fit with this model ( probability 13%) yields a charged
of mass (870 30) , and width (150 20) ,
significantly different from those reported in Ref. kappa for the
neutral state. This does not support the hypothesis that production of a
charged, scalar is being observed. The E-791 amplitude brian
describes the data well, except near threshold ( probability 23%).
Though our data favor the LASS parametrization for ,
the insensitivity of the fit to small variations in amplitude at these masses
does not allow an independent S-wave measurement with the present
data sample. Therefore, we use the E-791 amplitude to estimate systematic
uncertainty in our results.
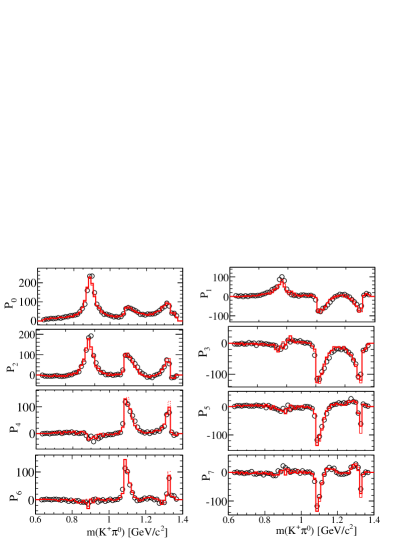
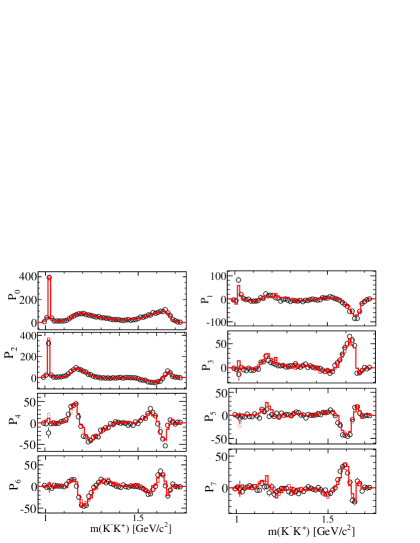
Figure 4: (Color online) The mass dependence of the spherical harmonic moments
of after efficiency corrections and background subtraction:
(columns I, II) and (columns III, IV). The circles with
error bars are data points and the curves (red) are derived from the fit
functions (see text). For the sake of visibility, we do not show error bars on
the curves.
We find that two different isobar models describe the data well. Both
yield almost identical behavior in invariant mass
(Fig. 1b–1d) and angular distribution (Fig. 4).
We use LASS amplitude to describe the S-wave amplitudes in
both the isobar models (I and II).
We summarize the results of the best fits (Model I: ,
probability 61.9%; Model II: , probability 47.3%)
in Table 1. We also list the fit fraction for each resonant
process , defined as
,
where , in Table 1.
Due to interference among the contributing amplitudes, the do
not sum to one in general. We find that the S-wave is not in
phase with the P-wave at threshold as it was in the LASS scattering
data. For Model I (II), the S-wave phase relative to the
is for the positive charge and
for the negative charge.
We have also considered the possible contributions from other resonant
states such as: , , , and . We
find that none of them is needed to describe the Dalitz plot, they all provide
small contributions and lead to smaller probabilities.
Angular distributions provide a more detailed information on specific
features of the amplitudes used in the description of the Dalitz plot. We
define the helicity angle for the decay as the
angle between the momentum of in the rest frame and the momentum of
in the rest frame. The moments of , defined as the
efficiency-corrected and background-subtracted invariant mass distributions
of events weighted by spherical harmonic functions,
,
where the are Legendre polynomials of order , are shown in
Fig. 4 for the and channels, for . The
moments are similar to those for .
The mass dependent S- and P-wave complex
amplitudes can also be obtained directly from our data in a model-independent
way in a limited mass range around 1 . In a region of the Dalitz plot
where S- and P-waves in a single channel dominate, their
amplitudes are given by the following Legendre polynomial moments,
(8)
using .
Here and are, respectively, the
magnitudes of the S- and P-wave amplitudes, and
is the relative phase between
them. We use these relations to evaluate
and , shown in Fig. 3, for the
channel in the mass range . The measured
values of agree well with those obtained in the analysis
of the decay antimo . They also agree well with
either the or the lineshape. The measured values of
are consistent with a Breit-Wigner lineshape for
. Results for and are shown in
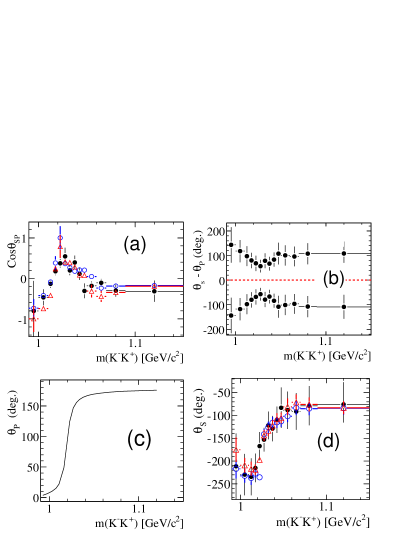
Figs. 5a–5b. A twofold ambiguity in the
sign of exists, as shown in Fig. 5b. It is, however,
straightforward to choose the physical solution. In this region, the
meson (P-wave) has a very rapidly rising phase, while
we expect the S-wave phase to be relatively slowly varying. Thus, the
upper solution, in which is rapidly falling, is
the physical solution. We take the Breit-Wigner phase of , shown
in Fig. 5c, to be a good model for and obtain ,
as plotted in Fig. 5d. These results show little variation in
S-wave phase up to about 1.02–1.03 , then a rapid rise above
that. Also, in Fig. 3b, we observe that follows
the curve well up to about the same mass, with a significant
deviation above that. The behavior observed matches well to that obtained
from the isobar model I or II. No distinction between them appears possible
from this analysis. The partial-wave analysis described above is valid, in
the absence of higher spin states, only if no interference
occurs from the crossing channels. The behavior observed in both
S- and P-waves above 1.03 can, therefore, be
attributed to high mass tails of the and low mass tails of
possible higher resonances.
Figure 5: (Color online) Results of the partial-wave analysis of the
system using Eq. 8 described in the text. (a) Cosine of relative
phase , (b) two solutions for
, (c) P-wave phase taken from
Eqs. 3–4 for the meson, and (d)
S-wave phase derived from the upper solution in (b). Solid bullets
are data points, and open circles (blue) and open triangles (red) correspond,
respectively, to isobar models I and II. The number of simulated events used
for the two models is 10 times larger than data. Errors for
quantities from the isobar models arise from Monte Carlo statistical
limitations, and differ from errors derived from Eq. 8.
Systematic uncertainties in quantities in Table 1
arise from experimental effects, and also from uncertainties in the nature
of the models used to describe the data. We determine these
separately and add them in quadrature. In both cases, we assign the
maximum deviation in the observed quantities (i.e., , , and
) from the central value as a systematic uncertainty, taking
correlations among fit parameters into account. We characterize the
uncertainties due to S-wave amplitudes and resonance
mass-width values as model dependent. We estimate them conservatively taking
symmetric errors from the spread in results when either the LASS amplitude is
replaced by the E-791 amplitude, or the resonance parameters are changed by
one standard deviation (). Similarly, we estimate the experimental
uncertainty from the variation in results when either the signal
efficiency parameters are varied by 1, or the background shape is
taken from simulation instead of the data sideband, or
the ratio of particle-identification rates in data and
simulation is varied by 1. Model and experimental systematics
contribute almost equally to the total uncertainty.
As a consistency check,
we analyze disjoint data samples, in bins of reconstructed mass and
laboratory momentum, and find consistent results.
Neglecting violation, the strong phase difference, ,
between the and decays to state and their amplitude
ratio, , are given by
(9)
Combining the results of models I and II, we find =
(stat) (syst) and = 0.599
0.013 (stat) 0.011 (syst). These results are consistent with the
previous measurements cleo , = (stat)
(syst) and = 0.52 0.05 (stat) 0.04 (syst).
In conclusion, we have studied the amplitude structure of the decay
, and measured and . We find that two isobar models
give excellent descriptions of the data. Both models include
significant contributions from , and each indicates that
dominates over . This suggests that, in
tree-level diagrams, the form factor for coupling to is
suppressed compared to the corresponding coupling. While the measured
fit fraction for agrees well with a phenomenological
prediction theory based on a large SU(3) symmetry breaking, the
corresponding results for and the color-suppressed
decays differ significantly from the predicted values.
It appears from Table 1
that the S-wave amplitude can absorb any and
if those are not in the model. The other components are quite
well established, independent of the model.
The S-wave amplitude is consistent with that from
the LASS analysis, throughout the available mass range. We cannot, however,
completely exclude the behavior at masses below 1.15 observed in
the decay kappa ; brian . The
S-wave amplitude, parametrized as either or ,
is required in both isobar models. No higher mass states are found to
contribute significantly.
In a limited mass range, from threshold up to 1.02 , we measure this
amplitude using a model-independent partial-wave analysis. Agreement with
similar measurements from decay antimo , and
with the isobar models considered here, is excellent.
We are grateful for the excellent luminosity and machine conditions
provided by our PEP-II colleagues, and for the substantial dedicated effort
from the computing organizations that support BABAR. The collaborating
institutions wish to thank SLAC for its support and kind hospitality. This
work is supported by DOE and NSF (USA), NSERC (Canada), CEA and
CNRS-IN2P3 (France), BMBF and DFG (Germany), INFN (Italy), FOM (The
Netherlands), NFR (Norway), MIST (Russia), MEC (Spain), and PPARC (United
Kingdom). Individuals have received support from the Marie Curie EIF (European
Union) and the A. P. Sloan Foundation.
References
(1)
J.L. Rosner, Phys. Rev. D74, 076006 (2006);
M.R. Pennington, Int. J. Mod. Phys. A21, 5503 (2006);
D. V. Bugg, Phys. Lett. B632, 471 (2006).
(2)
Reference to the charge-conjugate decay is implied throughout. The initial
state referred to is , not .
(3)
E.M. Aitala et al. (E-791), Phys. Rev. Lett. 89, 121801 (2002).
(4)
A. Giri, Y. Grossman, A. Soffer, and J. Zupan,
Phys. Rev. D68, 054018 (2003).
(5)
B. Aubert et al. (BABAR), hep-ex/0703037, submitted to Phys. Rev. Lett.
(6)
Y. Grossman, A.L. Kagan, and Y. Nir, Phys. Rev. D75, 036008 (2007), and
references therein.
(7)
B. Aubert et al. (BABAR), Nucl. Instr. and
Methods A479, 1 (2002).
(8)
B. Aubert et al. (BABAR), Phys. Rev. D74, 091102 (2006).
(9)
S.J. Lindenbaum and R.M. Sternheimer, Phys. Rev. 105, 1874 (1957);
M.G. Olsson and G.V. Yodh, Phys. Rev. 145, 1309 (1966);
D.J. Herndon, P. Söding, and R.J. Cashmore, Phys. Rev. D11, 3165
(1975).
(10)
W. -M. Yao et al. (PDG), J. Phys. , 1 (2006).
(11)
J.M. Blatt and W.F. Weisskopf, Theoretical Nuclear Physics, John Wiley
& Sons, New York, 1952.
(12)
H. Albrecht et al. (ARGUS), Phys. Lett. B308, 435 (1993).
(13)
D. Aston et al. (LASS), Nucl. Phys. B296,
493 (1988); W.M. Dunwoodie, private communication.