Scaling properties of pyrex and silicon surfaces blasted with sharp particles
Abstract
The blasting of brittle materials with sharp particles is an important fabrication technology in many industrial processes. In particular, for micro-systems, it allows the production of devices with feature sizes down to few tens of microns. An important parameter of this process is the surface roughness of post-blasted surfaces. In this work the scaling properties of Pyrex glass and silicon surfaces after bombardment with alumina particles is investigated. The targets were bombarded at normal incidence using alumina particles with two different average sizes, and , respectively. This investigation indicates that the resulting surfaces have multifractal properties. Applying multifractal detrended fluctuation analysis (MFDFA) allowed us to determine the singularity spectrum of the surfaces. This spectrum did not depend on the target material or on the size of the particles. Several parameters quantifying relevant quantities were determined. We argue that for scales below , fracture processes are dominant while at large scales long range correlations are responsible for the multifractal behaviour.
I Introduction
Powder blasting technology is among several techniques used in the
micro-machining Slikkerveer et al. (2000); Belloy et al. (1999); Veenstra et al. (2001) of
devices on silicon and other materials. With such abrasive
techniques, one can achieve high erosion rates; higher than those
that can be obtained with conventional dry, or wet etching
processes; such as plasma etching or chemical etching. In the
field of micro-electromechanical-systems (MEMS), powder blasting
has already been used for the fabrication of inertial
sensorsBelloy et al. (1999), peristaltic micro-pumpsVeenstra et al. (2001)
and miniaturized capillary electrophoresis
chipsSchlautmann et al. (2001). Erosion with sharp particles is also
a widely used technique in aerospace and automotive industries.
Because of its involvement in many applications, it is important
to investigate the surface morphology of blasted surfaces resulting
from erosion since the performance of many devices will depend on the surface roughness. Such investigation will also give an insight into the physical
mechanisms at work during the bombardment of materials with particles. The mechanisms involved in the erosion of
brittle materials with sharp particles
have been the subject of several studies. Several
models have been developed Slikkerveer et al. (1998); Chen et al. (2005) that are based on simple static indentation theory. These
models empirically relate the erosion rate to the material’s properties such as the
fracture toughness, the hardness and the Young modulus of the material. These models simply state that an indentation force
is generated by the impact of bombarding particles which, in turn,
results in the formation of crack patterns. Some cracks penetrate
the material radially away from the surface into the bulk
material; others will nucleate and form a lateral ring parallel to
the surfaceLawn and Fuller (1975); Marshall et al. (1982); Cook and Pharr (1990). The radial cracking
process was extensively studied Evans and Wilshaw (1976); Lawn (1998) and was
used as a method for materials toughness
measurementEvans and Charles (1976). Lateral cracks are responsible for the removal of material
in abrasive and wear experiments on brittle
materialsHagan and Swain (1978); Finnie (1995); Lawn (1993).
In separate studies, substantial work was dedicated to
the understanding of fracture surfaces Bouchaud (1997) in
brittle materials. These studies focus on the scaling properties of fracture surfaces
resulting from an applied load on the
material. These surfaces are found to be
self-affine, i.e. the
root-mean-square surface fluctuations, averaged over a distance
follows the scaling relationFamily and Viscek (1991):
| (1) |
where the scaling exponent is often called the roughness
or the Hurst exponent. In a variety of materials, the
value of was found to be approximately 0.8 over two or three
decades of scaling range. For this reason, it was conjectured
to be universal i.e. independent of the material (ductile or
brittle), the fracture mode and the fracture
toughness Bouchaud (1997); Måløy et al. (1992); Schmittbuhl et al. (1994). However, this
universality was questioned since the discovery of a second
exponent at the nanometer scaleMilman et al. (1993, 1994); McAnulty et al. (1992). The value of this
second exponent is significantly smaller than 0.8 and close to
0.5. To explain this fact, it was proposed that the fracture
front could be imagined as a line moving through a random medium. Thus, the evolution of the
crack front can be described by a local nonlinear Langevin
equation Bouchaud et al. (1993); Ertas and Kardar (1992, 1993) which
predicts a crossover between two regimes corresponding to
at small scales and to at large scale.
In the framework of this model, the crossover length decreases
rapidly with the crack speed which was also predicted by numerical
simulationsNakano et al. (1995).
The present work is dedicated to the
study of the scaling properties of surfaces resulting from a
bombardment by sharp particles. Pyrex glass (borosilicate glass) and silicon were the materials used in this investigation.
We will investigate the effect of the material and the size of
the bombarding particles on those properties.
II Experiments
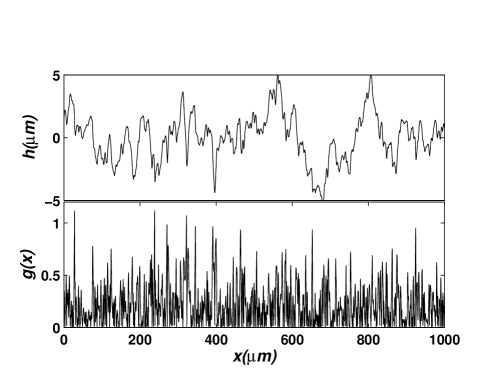
In the experiments carried out, surfaces are exposed to a directed particle jet, which results in mechanical material removal. The particles are accelerated towards the target with a high-pressure air flow through a circular nozzle (with a diameter of 1.5 ). The particles hit the target under normal incidence, with an average speed of 290 m/s, in a ventilated box. A lateral movement of the target ensures an evenly etched surface. The average diameter of the bombarding alumina particles was and , respectively. We performed measurements on one-dimensional cuts of blasted surface using a mechanical surface profiler(Sloan Dektak II), over a length of 1 mm. Each scanned profile is made of 8000 data points. Typical profiles obtained after blasting Pyrex and silicon surfaces by alumina particles are shown in figure 1.
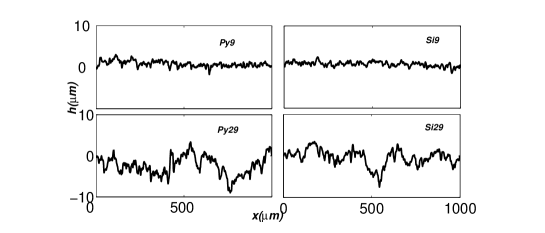
Note the difference in the roughness amplitude in the two cases corresponding to different particle sizes. Large amplitudes are obtained when the targets are blasted by large particles. The typical rms surface roughness is and for Pyrex and silicon respectively, when particles are used. In table 1, measured values of the surface rms roughness are shown, as a function of the bombarding particle sizes and the target material. Samples bombarded with particles having a diameter are denoted , where X denotes the material’s symbol. For example means silicon bombarded with particles having a diameter of .
| Particles size | ||
|---|---|---|
| Pyrex | ||
| Silicon |
III Scaling properties of blasted surfaces
III.1 Global scaling exponents
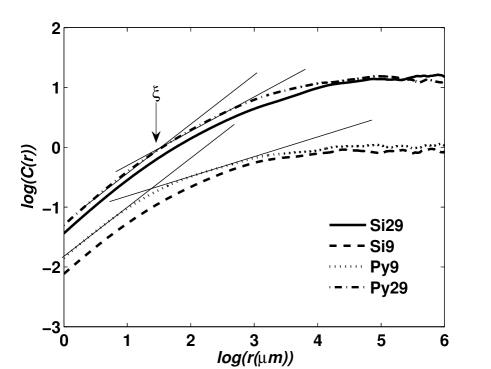
We first investigate the global scaling behaviour of the blasted surfaces by calculating the height-height correlation function defined as :
| (2) |
where the outer brackets mean the average over all positions and defines the surface profile. This function measures how correlated two points are on the profiles at a distance of each other. If the surface is self-affine then , over the scaling range. Here, is the roughness exponent to be determined. We computed for one dimensional cuts and averaged the result over a total of ten scanned profiles. In figure 2 we plot for . We notice the existence of a cross-over, occurring at a characteristic length scale , separating small and large scales with two different roughness exponents, i.e. for , and for , . The linear fit of vs in the scaling region, determines the value of the roughness exponent for small scales and at large scale. These values are summarized in table 2, along with the characteristic length scale .
| Sample | |||
|---|---|---|---|
| Si9 | 0.77 0.02 | 0.4 0.01 | 4.8 |
| Si29 | 0.81 0.01 | 0.55 0.002 | 4.7 |
| Py9 | 0.74 0.02 | 0.32 0.003 | 4.7 |
| Py29 | 0.8 0.02 | 0.53 0.04 | 5.2 |
III.2 Multifractal properties and singularity spectrum
The global analysis performed above can only reveal the existence of two roughness exponents. In many situations however, rough profiles exhibit a range of roughness exponents. Such profiles are called multifractal while profiles exhibiting a single roughness exponent are called monofractalCalvet et al. (unpublished). Our aim is to determine the full range of local roughness exponents for the blasted surfaces using multifractal analysis. To do so, we characterized the profiles by computing the so-called singularity spectrum, which determines the distribution of the whole range of local roughness exponents. We used the multifractal detrended fluctuation analysis (MFDFA) Kantelhardt et al. (2002). This method has become popular thanks to its simplicity and its easy computer implementation. Other methods exist such as the wavelet transform modulus maxima method(WTMM) Muzy et al. (1991) but the MFDFA has several advantages Oświȩcimka et al. (1992). The MFDFA is the extension of the detrended fluctuation(DFA) Peng et al. (1994) method which was used to compute the roughness exponent of monofractal signals and for the identification of long range correlations in non-stationary time series Kantelhardt et al. (2002). MFDFA is an efficient tool to eliminate undesirable trends in fluctuations. This method applied to our experimental data can be summarized as follow: Given a profile , , we compute the integrated profile,
| (3) |
where N is the number of data points and is the mean height of the profile. The the whole profile is subdivided into non-overlapping segments of length (here is the number of data points in each segment). Since is not always an integer, some data will be ignored during this procedure. To take them into account, the subdivision is performed from both ends of the profile, which results into segments. In each segment the polynomial trend is subtracted from the data. This polynomial is determined by a least square fit to the data in each segment. Polynomials of degrees higher than 1 can be used, corresponding to MFDFA2, MFDFA3, etc. After detrending in each segment, the variance of the result is calculated :
| (4) |
This expression is then averaged over all segments and the value of the qth-order fluctuation function is calculated Kantelhardt et al. (2002):
| (5) |
Here is a real number. For a fractal profile follows a power law relation at large scales i.e.:
| (6) |
The exponent is called the ”generalised Hurst exponent” Kantelhardt et al. (2002). For a monofractal profile, while for a multifractal profile is a function of . For positive values of , describes the scaling behaviour of the segments with large fluctuations, while for negative values of , describes the scaling behaviour of the segments with small fluctuations. The singularity spectrum is calculated by performing the Legendre TransformFeder (1988) of with , resulting in:
| (7) |
The spectrum can be interpreted as the fractal
dimension of a subset of points in the profile characterized by
the singularity strength (the local roughness exponent).
For a monofractal profile, and ,
where is the roughness exponent of the profile. The strength of the
multifractality of a profile can be characterized by the
difference between the maximum and minimum values of ,
i.e. .
Figure
3 shows the logarithm of the fluctuation function versus
the logarithm of the distance , where is the spatial increment of the profile, for Py29 sample. Also shown is
the linear regression fit at large scale for each value of .
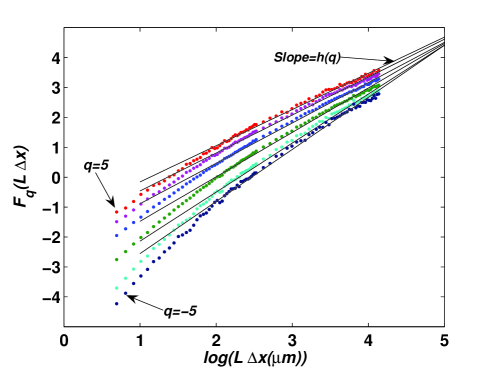
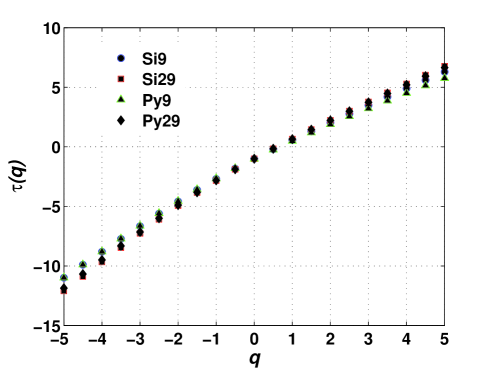
We used a detrended polynomial of degree 1( MFDFA1), but the result remains unchanged when polynomial of degree two and three were used(MFDFA2,MFDFA3). We can see clearly that at large scale, the fluctuation functions are straight lines in the double logarithmic plot, with different slopes indicating the presence of multifractality. In figure 4 the plot of versus is shown for the four samples Py9, Py29, Si9 and Si29. Note that for , the function coincides with its asymptotic form which is a linear function of q 111Note that the function defined in the MFDFA formalism, is equivalent to functions defined in standard multifractal formalism. For rigorous definitions and properties of see for example Calvet et al. (1997). . Hence, we choose . We notice clearly that is a concave function of function of , typical of multifractal profiles. From equations (III.2) we can estimate the singularity spectrum for the four samples as shown in figure 5. This spectrum is averaged over 12 profile containing 8000 points each.
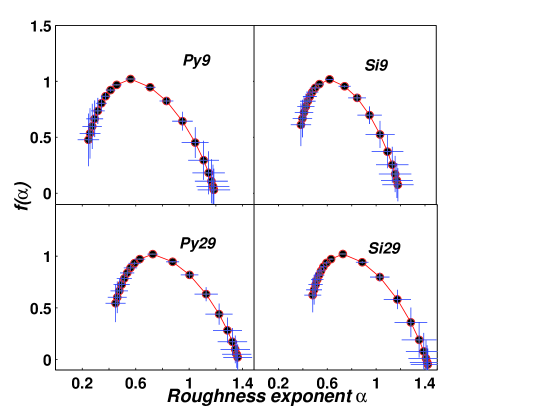
In table 3 we summarize the values of the strength of the multifractality for the four samples.
| Sample | Py9 | Si9 | Py29 | Si29 |
| 0.94 | 0.8 | 0.91 | 0.94 |
IV Discussion
The values of the two global roughness exponents were determined for
all four samples Py9, Py29, Si9 and Si29 using the height-height
correlation function. All samples show a crossover behavior
corresponding to two values of the roughness exponent
and shown in table 2. The value is, within the error range, independent of the material or the size of impacting particles.
For all analyzed samples, the small scale
value is consistent with the approximate universal value of found for
three dimensional
fracture of brittle materialsBouchaud et al. (1990); Måløy et al. (1992); Schmittbuhl et al. (1995). This provides evidence that at scales below the characteristic length , the
dominant mechanism in powder blasting is the fracture formation. This observation is in agreement with the static indentation
theoryLawn and Fuller (1975); Marshall et al. (1982); Cook and Pharr (1990) where the dynamic load of impacting particles creates a
local load which increases the local stress resulting in the
formation of lateral cracks, which are responsible for the
material removal. In general, the universal value of the roughness exponent
0.8 corresponding to three dimensional fracture surfaces is
observed at large length scales (from 0.1 to 1 , see reference Bouchaud (1997)). In contrast, the dynamic load of impacting particles induces a
cross over to smaller values of the global roughness exponent, above 5 (
see table 2) which are 0.4, 0.32, 0.55 and 0.53 for
Si9, Py9, Si29 and Py29, respectively. The large scale values of
the global roughness exponent obtained for Py9 and Si9 are smaller than
those obtained for Si29 and Py29. The effect of impacting particle’s size
is felt at large scales. Larger particles give larger roughness
exponents, independent of the material being Silicon or Pyrex
glass.
We also showed that the surface generated by particles blasting
share a common property of multifractality. The MFDFA method was
used to uncover this property and to determine the singularity
spectrum for each four samples. The strengths of multifractality represented by
, as displayed in table 3, are close to
each other regardless of the size of the particles and the
material. This multifractality could be interpreted in terms of spatial
intermittency. This concept was argued by Krug Krug (1994) to
describe the scaling of surfaces generated by epitaxial growth models
incorporating very limited atomic mobility leading to a
violent spatial intermittent effects and multifractal surfaces. This description was borrowed
from fluid turbulence owing the similarity between Galilean invariance of turbulent fluids and translational invariance of interfacesBohr et al. (1992).
In our case, we highlight large fluctuations by
considering the step size or the gradient
at the position , for a profile . This quantity is the analog of energy dissipation ,
where is the local velocity of a turbulent fluidFrisch (1995). Figure 6 shows the local gradient for Pyrex glass
bombarded by -size particles, showing large gradient
fluctuations which suggests spatial intermittency. In addition, we consider the distribution of the local gradient
in analogy with local velocity gradient in fully
developed turbulence, which is described by a stretched exponential
distributionBershadskii (1997); Kailasnath et al. (1992). A very similar behaviour is characteristic of
all four samples Py9, Py29, Si9 and Si29 as shown in figure
7, where the local gradient distribution fits very
well with the stretched exponential function:
| (8) |
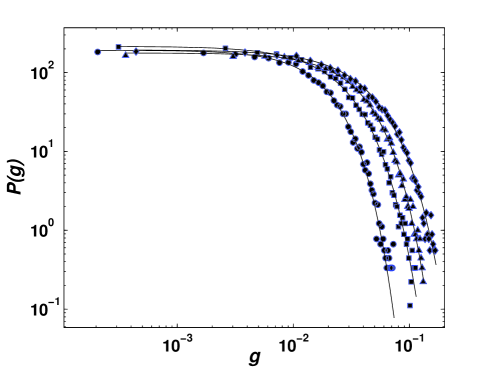
The fit of the local gradient distribution to equation (8) gives the values of the stretching exponent , which are , , and for Si9, Py9, Si29 and Py29 respectively. The form of the local gradient distribution suggests that non-linearities must be present at large scale, leading to symmetry breaking. Indeed, the skewness of the profiles for all samples are non-zero and have the values s -0.4, -0.35, -0.28 and -0.4 for Si9, Si29, Py9 and Py29 respectively. We can now ask the question: What is the origin of the observed multifractality? It well known that multiplicative cascades Mandelbrot (1969); Frisch (1995) models generate processes known to have intermittent behaviour and a multifractal character, mirroring the presence of intermittent fluctuations with long-range correlations. These long-range correlations are generated at large scale by features that hierarchically cascade their influence to smaller scales. To detect the presence of long range correlations in our surface profiles, we perform the following testIvanov et al. (1999): we generated a surrogate data set by shuffling the height data in each profile. The newly generated data set preserves the distribution of the height but destroys the long range correlations, which means that the surrogate profiles will exhibit a monofractal behavior, if the multifractality originates from the long-range correlations and not from the height distribution. We performed the MFDFA and found that the surrogate data set is monofractal with the roughness exponent for all for samples. Thus, the observed multifractal behaviour is a result of long range correlations since the shuffling procedure preserves the height distribution. The effect of long-range elastic interaction in developing long-range correlations was reported by some authors in the case of elastic chains driven in a quenched random pinning Tanguy et al. (1998), or during crack propagation Gao and Rice (1989). Undoubtedly a detailed theoretical investigation is needed in order to determine the origin of the long-range correlations in sharp particle’s bombardment of brittle materials.
V Conclusion
In conclusion we conducted a detailed scaling analysis of surfaces of two brittle materials, Silicon and Pyrex glass, after bombardment with alumina particles of two different sizes and . The bombardment results in multifractal surfaces. This multifractality is common to all samples regardless of the nature of the material or the size of the particles. We determined the corresponding singularity spectrum revealing a broad range of scaling exponents. We argued that for scales below , fracture processes are dominant while at large scales long range correlations are responsible for the observed multifractal behavior.
Acknowledgements.
The authors would like to thank E. Bouchaud for the useful discussions.References
- Slikkerveer et al. (2000) P. Slikkerveer, P. Bouten, and F. de Haas, Sensors. and Actuators 85, 296 (2000).
- Belloy et al. (1999) S. Belloy, E. Thurre, A. Walckiers, Sayah, and M. Gijs, Eurosensors XIII proceeding, the Hague, Holland p. 827 (1999).
- Veenstra et al. (2001) T. T. Veenstra, J. W. Berenschot, J. G. E. Gardeniers, R. G. P. Sanders, M. C. Elwenspoek, and A. van den Berg, J. Electrochem. Soc. 148, G68 (2001).
- Schlautmann et al. (2001) S. Schlautmann, H. Wensink, R. M. Schasfoort, M. Elwenspoek, and A. V. D. Berg, J. Micromech. Microeng. 11, 386 (2001).
- Slikkerveer et al. (1998) P. J. Slikkerveer, P. Bouten, F. in’t Veld, and H. Scholen, Wear 217, 237 (1998).
- Chen et al. (2005) X. Chen, J. W. Hutchinson, and A. G. Evans, J. Am. Ceram. Soc. 88, 1233 (2005).
- Lawn and Fuller (1975) B. R. Lawn and E. R. Fuller, J. Mater. Sci. 10, 2016 (1975).
- Marshall et al. (1982) D. B. Marshall, B. R. Lawn, and A. G. Evans, J. Am. Ceram. Soc. 65, 561 (1982).
- Cook and Pharr (1990) R. F. Cook and G. M. Pharr, J. Am. Ceram. Soc. 73, 787 (1990).
- Evans and Wilshaw (1976) A. G. Evans and T. R. Wilshaw, Acta Mater. 24, 939 (1976).
- Lawn (1998) B. R. Lawn, J. Am. Ceram. Soc. 81, 1977 (1998).
- Evans and Charles (1976) A. G. Evans and E. A. Charles, J. Am. Ceram. Soc. 59, 371 (1976).
- Hagan and Swain (1978) J. T. Hagan and M. V. Swain, J. Phys. D: Appl. Phys. 11, 2091 (1978).
- Finnie (1995) I. Finnie, Wear 186, 1 (1995).
- Lawn (1993) B. Lawn, Fracture of Brittle solids 2nd edn (Cambridge University Press, 1993).
- Bouchaud (1997) E. Bouchaud, J. Phys.: Condens. Matter 9, 4319 (1997).
- Family and Viscek (1991) F. Family and T. Viscek, Dynamics of Fractal Surfaces (World Scientific, Singapore,, 1991).
- Måløy et al. (1992) K. J. Måløy, A. Hansen, E. L. Hinrichsen, and S. Roux, Phys. Rev. Lett. 68, 213 (1992).
- Schmittbuhl et al. (1994) J. Schmittbuhl, S. Roux, and Y. Berthaud, Europhys. Lett. 28, 585 (1994).
- Milman et al. (1993) V. Y. Milman, R. Blumenfeld, N. A. Stelmashenko, and R. C. Ball, Phys. Rev. Lett. 71, 204 (1993).
- Milman et al. (1994) V. Y. Milman, N. A. Stelmashenko, and R. Blumenfeld, Prog. Mater. Sci. 38, 425 (1994).
- McAnulty et al. (1992) P. McAnulty, L. V. Meisel, and P. J. Cote, Phys. Rev. A 46, 3523 (1992).
- Bouchaud et al. (1993) J. P. Bouchaud, E. Bouchaud, G. Lapasset, and J. Plan s, Phys. Rev. Lett. 71, 2240 (1993).
- Ertas and Kardar (1992) D. Ertas and M. Kardar, Phys. Rev. Lett. 66, 929 (1992).
- Ertas and Kardar (1993) D. Ertas and M. Kardar, Phys. Rev. E 48, 1703 (1993).
- Nakano et al. (1995) A. Nakano, R. k. Kalia, and P. Vashishta, Phys. Rev. Lett. 75, 3138 (1995).
- Calvet et al. (unpublished) L. Calvet, A. Fisher, and B. B. Mandelbrot, Cowles Foundation paper 1164 (unpublished).
- Kantelhardt et al. (2002) J. W. Kantelhardt, S. A. Zschiegner, E. Koscielny-Bunde, S. Havlin, A. Bunde, and H. E. Stanley, Physica A 316, 87 (2002).
- Muzy et al. (1991) J. F. Muzy, E. Bacry, and A. Arneodo, Phys. Rev. Lett. 67, 3515 (1991).
- Oświȩcimka et al. (1992) P. Oświȩcimka, J. Kwapień, and S. Drożdż, Phys. Rev. A 46, 3523 (1992).
- Peng et al. (1994) C. K. Peng, S. V. Buldyrev, S. Havlin, M. Simons, H. E. Stanley, and A. L. Goldberger, Phys. Rev. E 49, 1685 (1994).
- Feder (1988) J. Feder, Fractals (Plenum Press, New York., 1988).
- Bouchaud et al. (1990) E. Bouchaud, G. Lapasset, and J. Planés, Europhys. Lett. 13, 73 (1990).
- Schmittbuhl et al. (1995) J. Schmittbuhl, F. Schmitt, and C. Scholz, J. Geophys. Res. 100, 5953 (1995).
- Krug (1994) J. Krug, Phys. Rev. Lett. 72, 2907 (1994).
- Bohr et al. (1992) T. Bohr, G. Grinstein, C. Jayaprakash, M. H. Jensen, J. Krug, and D. Mukamel, Physica A 59D, 177 (1992).
- Frisch (1995) U. Frisch, Turbulence : the legacy of A. N. Kolmogorov (Cambridge University Press, 1995).
- Bershadskii (1997) A. Bershadskii, Europhys. Lett. 39, 587 (1997).
- Kailasnath et al. (1992) P. Kailasnath, K. R. Sreenivasan, and G. Stolovitzky, Phys. Rev. Lett. 68, 2766 (1992).
- Mandelbrot (1969) B. Mandelbrot, On Intermittent Free Turbulence, Turbulence of Fluids and Plasmas (Interscience, New York, 1969).
- Ivanov et al. (1999) P. C. Ivanov, L. A. N. Amaral, A. L. Goldberger, S. Havlin, Michael, G. Rosenblum, Z. R. Struzikk, and H. E. Stanley, Nature 399, 461 (1999).
- Tanguy et al. (1998) A. Tanguy, M. Gounelle, and S. Roux, Phys. Rev. E 58, 1577 (1998).
- Gao and Rice (1989) H. Gao and J. R. Rice, J. Appl. Mech. 56, 828 (1989).
- Calvet et al. (1997) L. Calvet, A. Fisher, and B. B. Mandelbrot (1997), cowles Foundation Discussion Paper No. 1165.