On UHECR energy estimation algorithms based on the measurement of electromagnetic component parameters in EAS
Abstract
Model calculations are performed of extensive air shower (EAS) component energies using a variety of hadronic interaction parameters. A conversion factor from electromagnetic component energy to the energy of ultra-high energy cosmic rays (UHECRs) and its model and primary mass dependence is studied. It is shown that model dependence of the factor minimizes under the necessary condition of the same maximum position and muon content of simulated showers.
1 Introduction
UHECR particles hitting Earth atmosphere produce a cascade of secondary particles, the small part of which is detected on the ground with EAS array. The energy of the primary particle, , is distributed among the shower components. The most of the energy deposit is due to ionization and excitation of the air molecules caused by electromagnetic component.
The primary energy estimation algorithms are based mainly on the measurement of the shower parameters related to electromagnetic component energy, . Such an approach is realized in High Resolution Fly’s Eye (HiRes) [1], Pierre Auger Observatory (PAO) [2] and the Yakutsk array [3, 4] experiments. Future applications are planned in the Telescope Array and satellite projects.
In all these experiments a fraction of the primary energy cannot be measured because it is carried away by hadrons, muons etc., unobservable with array detectors. This ’missing energy’ and conversion factor can be calculated modeling a cascade in atmosphere, as was done in [4, 5, 6, 7]. However, only QGSJET and SIBYLL models have been applied in these simulations, setting aside the model dependence of the conversion factor.
In the present work the energies of air shower components are calculated using extremely different hadronic interaction models, but having the same maximum position and muon content of the resultant showers. It is shown that the model dependence of the ratio minimizes in this case. The variability of the ratio is estimated due to models and the primary nucleus mass. The experimental uncertainties in the electromagnetic component energy measurements are discussed. In particular, the energy spectra measured with the Yakutsk and HiRes arrays are shown to be coincident within experimental errors.
2 Basic experimental data
Relativistic electrons of the shower induce Vavilov-Cherenkov radiation (Cherenkov light) in the atmosphere. The total flux of light, , can be used as an estimator of the electromagnetic component energy in EAS. This method realized in the Yakutsk array experiment is based on the relation between and largely independent of the model [3, 8]. The energy fraction dissipated in the ground is estimated using the tail of cascade curve measurement in inclined showers.
Another method, namely fluorescence technique, is applied in HiRes and PAO/FD experiments where the fluorescence light emitted by wounded nitrogen molecules along the trajectory of the shower is collected by mirrors and received by photomultiplier pixels. The light intensity is proportional to the number of shower electrons, so the cascade curve, , is scanned by fired pixels and ionization in the atmosphere (ionization integral) can be estimated:
where is slant depth along the shower axis in units of radiation length (36.7 g/cm2 [9]); is the thickness of atmosphere; energies are in units of critical energy ( MeV). As it was shown in cascade theory [10], the electromagnetic component energy is equal to ionization integral ; that is why the energy is actually evaluated in these experiments.
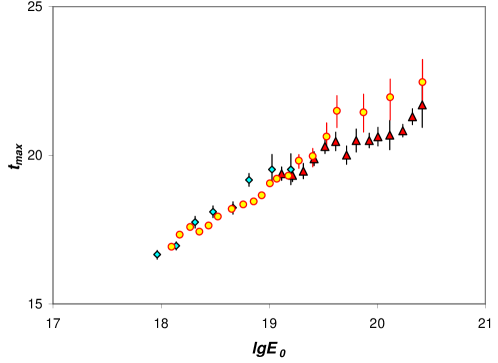
Measurements of the shower maximum position in the atmosphere as a function of the primary particle energy, , and the number of muons at observation level (usually as a ratio to the number of electrons, ) are the basic parameters to be guided by performing the cascade simulations in the UHE region. The only data available in the region are those given by the HiRes, AGASA and Yakutsk experiments [1, 3, 11]. In the HiRes case the position of the shower maximum is measured by stereo system of two Eyes. On the contrary, the Yakutsk array detectors are measuring the Cherenkov light, and the lateral distribution form of the light spot on the ground is used to derive in this case (Fig. 1).
The number of electrons and muons at the ground level is measured by scintillation detectors/proportional counters (shielded with Fe/concrete and ground to detect muons) of the Yakutsk and AGASA arrays (Fig. 2).
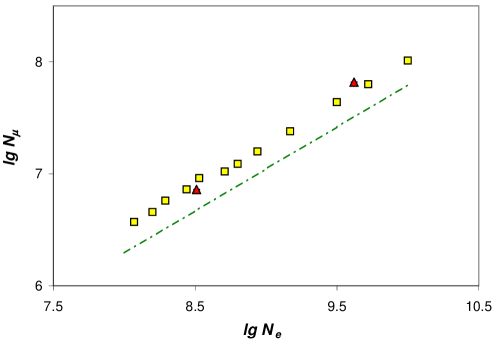
Experimental errors in measurement are to in the energy range eV; ratio differs up to times between Yakutsk and AGASA data while the difference in itself is around 25% [11]. The main source of the discrepancy is the total number of charged particles on the ground which is estimated using the particle density measured at the shower periphery in both experiments.
3 Modeling the cascade in atmosphere
As was shown in previous calculation of the energy balance of EAS components [4], the dependence of primary energy deposited in the atmosphere on hadronic interaction models (i.e. multiplicity of secondaries, cross sections, etc.) can be parameterized via the longitudinal shower development characteristics and . This is a consequence of the close connection between and the ionization integral. In this case (as far as other shower parameters are not concerned), we can go far beyond the bounds of conventional models.
Namely, we can use in very high energy region a variety of arbitrary extrapolations of accelerator data in order to apply hadronic interaction models with only restriction of the same resultant shower maximum and the muon content. It will allow to estimate the real limits of the ratio variations using distinctly different models in addition to ’standard’ models fitted to describe the same experimental data.
In this work three hadronic interaction models which are characterized by extremely different forms of the rapidity, , distribution of the ’sea’ secondaries in pionization region are used: i) Gauss model with normal rapidity distribution; ii) Delta model with equal rapidities of secondaries and iii) Flat distribution model with . All other parameters of the models are flexible in order to get and of the shower fitting experimental data within errors. In the Flat distribution model, for instance, the pionization region width and the fraction of secondary pions, kaons and nucleons in multiple production processes have been adjusted in addition to cross sections and fragmentation coefficients to get the output EAS observables desired.
Numerical solution of hadron transport equations is obtained using the resolvent of Volterra equation on the rectangular lattice [13]. To calculate the number of electrons in the shower at a depth , Greisen’s formula is employed. Electromagnetic component energy is assumed to be equal to the energy of neutral pions, the decay of which into gamma-quanta initiates the component. The muon and neutrino energy is calculated via the energy fraction taken from the decay of charged pions and kaons. The hadronic component energy is summed up at each layer .
It is well-known that is strongly fluctuating parameter of the shower. Monte Carlo simulations using CORSIKA code give RMS deviation and for the proton and Fe initiated showers of the same , correspondingly [14]. On the contrary, the primary energy fraction deposited in atmosphere is fluctuating much lesser because it is related to the integral along the shower trajectory.
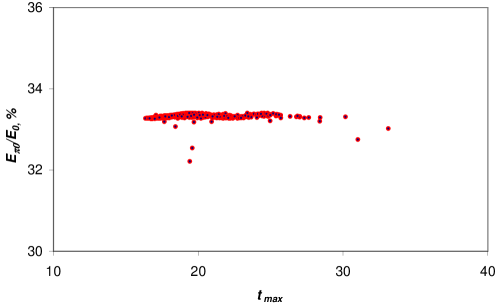
In order to estimate the influence of cascade fluctuations on the ionization integral, a leading fragment approximation in the simplest case of the primary nucleon is used - only fluctuations in inelasticity and interaction points of the EAS primary particle are considered, along suggestions given in [15]. Bearing in mind the isotopic invariance of multiple production processes and multiplicity distribution, we derive the ionization integral event-by-event distribution, with fixed , as a ( - fold) convolution of inelasticity fluctuations. Resultant distribution is a Gaussian with average energy fraction
where is an elasticity in nucleon interactions; is a projectile energy fraction carried out by neutral secondary pions. The RMS deviation is as illustrated in Fig. 3. We neglect fluctuations in the rest of distributed among the shower components because of averaging over the huge number of shower particles.
4 Results
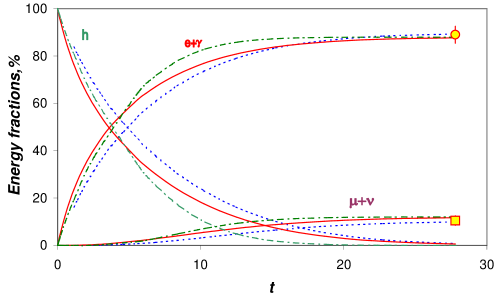
We are interested in the ionization integral and the energy deposited to muons+neutrinos in a shower. These values calculated for our models ( eV) are presented in Fig. 4. The hadronic component energy is less than at sea level.
Ionization in the atmosphere, , is closely related to the total air Cherenkov light flux on the ground [3, 4] and is measured with Cherenkov light detectors of the Yakutsk array. A point in Fig. 4 is given with experimental error in the aggregate of calibration, atmospheric extinction of light uncertainty, etc.
The energy of muons and neutrinos is estimated as a sum of measured on the ground and model calculation results giving the energy of neutrinos, ionization and decay of muons [17]. Absolute experimental uncertainty () is based on the difference between Yakutsk and AGASA measurements.
Another presentation of the results is given in Fig. 5. Electromagnetic component energy is , where is the energy of electrons and photons dissipated in the ground. To estimate it we need the total number of electrons at and its attenuation length: . The result based on the Yakutsk array data is shown in Fig. 5 by circles.
The Yakutsk array data are used to estimate the energy of muonic component. Energy remainder deposited to undetectable hadrons and neutrinos is estimated using the cascade modeling. In the HiRes case, the energy fraction is exclusively the product of model simulations because the only component measured is the fluorescence light. Since CORSIKA/QGSJET code is used to estimate the conversion factor to primary energy, triangles represent QGSJET model results. EAS simulation with SIBYLL model gives the ratio with difference less than [6].
The main feature of results given in Figs. 4,5 is that different models lead to approximate fractions of the primary energy assigned to electromagnetic component, if and are coincident. The model uncertainty is less than 3% in the interval eV where the experimental data are available; the energy dependence of is limited to per decade, while a spread at eV is within .
Additionally, the ionization integral and are varying with the primary particle mass, in spite of the same for different nuclei. We estimated the variance to be less than if the primary mass is . The sum of two uncertainties (from the model and primary mass) is . We have not considered here showers initiated by other primaries, such as photons, neutrinos or mini black holes, because their muon content is a subject of the alternate investigation.
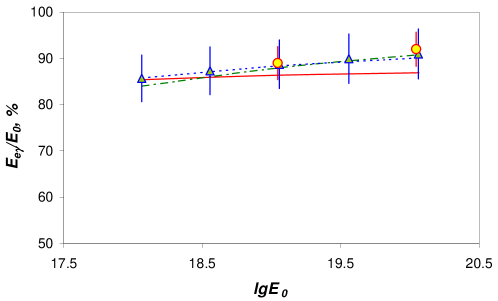
Due to the negligible fraction of hadronic component energy at sea level, the remainder of is transferred to muons and neutrinos. As a consequence, is nearly model independent, too, but the muon component energy measurable on the ground is more variable in different models.
5 Experimental uncertainties
The experimental errors in the shower maximum detection and the number of muons at lead to the uncertainty of calculated ratio (we will pass over considering it congruous). We have modeled this varying the multiplicity of secondaries and cross sections which result in the changes of and comparable to experimental uncertainties. Resultant turned out to be below in the case of depth variation , and for . So we have assumed the aggregate experimental uncertainty due to and measurement errors to be below .
The greatest uncertainty source is the ionization integral measurement itself. For the Yakutsk array data it comprises of errors due to Cherenkov light measurement and the number of charged particles on the ground [4, 8]: uncertainty in atmospheric transparency (15%); detector calibration (21%) and total light flux measurement (15%) errors; an uncertainty in the number of electrons reaches because the only measurable parameter is the particle density beyond hundred meters from the shower core. Resultant estimation uncertainty () is the sum of all these errors weighed with the shower component energies.
The HiRes group claims a systematic uncertainty [1] aggregated of errors in the absolute calibration of the photo-tubes (), the yield of the fluorescence process (), modeling of the atmosphere, and so on.
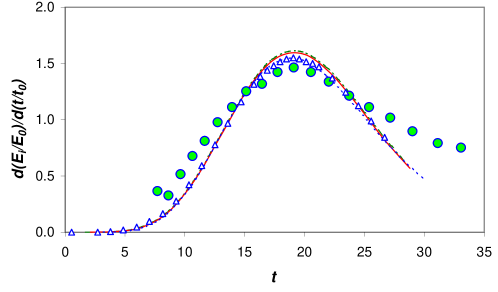
However, a comparison of model predictions with the HiRes/MIA measurement of the average cascade curve in the interval eV (Fig. 6) reveals a discrepancy between calculated and measured curves. Substantially, a contradiction in the cascade curve can be resolved using the attenuation length of electrons measured at sea level. Equal intensity cuts method gives the value in the interval for the Yakutsk array data [3], while the HiRes curve has . Models predict the length in agreement with the Yakutsk array data.
There may be an additional uncertainty up to in assignment due to inadequate fitting of the longitudinal shower profile detected with HiRes. This may be the result of increased measurement error of the faint fluorescence light far from the shower maximum, and/or the direct and scattered Cherenkov light contamination to the signal.
There is an alternative estimation method proposed in [7]. It is based on the relation between the number of electrons at the shower maximum, , and energy of gamma-quanta initiating electromagnetic sub-cascade: [10]. An advantage of the method is in avoidance of the cascade curve approximation; disadvantage consists in the asymmetric distribution of . On the whole, it seems to be the more reliable approach to the estimation of electromagnetic component energy in comparison with integration of the longitudinal shower profile, not only at energies above eV, as was concluded in [7].
Presumably, the overall experimental uncertainty in ionization integral estimation is for the Yakutsk array data, and for the HiRes measurements. Consequently, notwithstanding nearly the same conversion factor from to , the primary energy estimate may be distinctly different in these experiments due to systematic errors in evaluation.
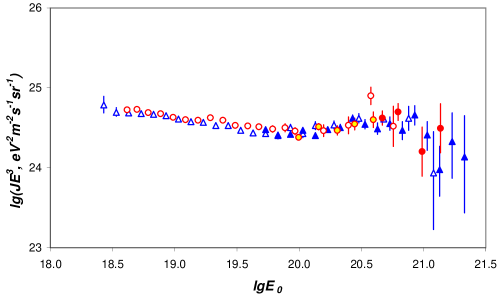
To provide an illustration, the differential energy spectra measured with the Yakutsk array [4] and HiRes [1] are shown in Fig. 7. The primary energy is decreased by for the former data, and increased by for the latter. Intensities are multiplied by in order to demonstrate the spectrum features - ’ankle’ around eV and steepening at eV (Greisen-Zatsepin-Kuzmin effect). The shape and intensity of the spectra derived from the data of the Yakutsk array and HiRes are consistent indicating a need for systematic correction (within experimental errors) to the ionization integral measured.
6 Conclusion
Extremely different hadronic interaction models lead to the resultant (electromagnetic component energy/EAS primary particle energy) ratio consistent within 7% if the model and primary mass guarantee the same maximum position in atmosphere and muon content of the shower:
.
The primary energy estimation algorithms based on ionization integral measurement rely on this ratio and the resultant uncertainty originates from experimental errors predominantly; model dependent one is minor in the presence of contemporary measurements of the longitudinal shower development parameters.
Acknowledgment
This work is partially supported by RFBR (grant #06-02-16973) and MSE (grant #7514.2006.2).
References
- [1] P. Sokolsky, Workshop ’The UHE Universe: a vision for the next decade’, June 2006, Rome, http://www.roma2.infn.it/uhe_workshop06/.
- [2] Pierre Auger Collaboration, Nucl. Instrum. Meth. A 523 (2004) 50.
- [3] M.N. Dyakonov et al., Cosmic Rays of Extremely High Energy Nauka, Novosibirsk, 1991 (in Russian).
- [4] V.P. Egorova et al., Nucl. Phys. B (Proc. Suppl.) 136 (2004) 3.
- [5] M. Risse and D. Heck, Astropart. Phys. 20 (2004) 661.
- [6] H. Barbosa et al., Astropart. Phys. 22 (2004) 159.
- [7] J. Alvarez-Muniz et al., Phys. Rev. D 69 (2004) 103003.
- [8] A.A. Ivanov et al., Nucl.Phys. B (Proc. Suppl.) 122 (2003) 226.
- [9] Particle Data Group, Eur. Phys. Journ. 3 (1998) 148.
- [10] S.Z. Belenky, Cascade processes in cosmic rays, OGIZ, Moscow, 1948 (in Russian).
- [11] M. Nagano and A.A. Watson, Rev. Mod. Phys. 72 (2000) 689.
- [12] T. Abu-Zayyad et al., Astropart. Phys. 16 (2001) 1.
- [13] A.A. Ivanov, Proc. 29th ICRC, Pune 7 (2005) 223.
- [14] S.S. Ostapchenko, Thesis, 1994, Moscow State University (in Russian).
- [15] L.G. Dedenko, Thesis, 1968, P.N. Lebedev Physical Institute (in Russian).
- [16] D. Heck et al., FZKA 6019, Forschungszentrum Karlsruhe (1998); T. Pierog et al., astro-ph/0411260.
- [17] A.D. Erlykin and A.W. Wolfendale, Astropart. Phys. 18 (2002) 151.
- [18] S.P. Knurenko et al., JETP Lett. 83 (2006) 473.