Helioseismic analysis of the solar flare-induced sunquake of 2005 January 15
Abstract
We report the discovery of one of the most powerful sunquakes detected to date, produced by an X1.2-class solar flare in active region 10720 on 2005 January 15. We used helioseismic holography to image the source of seismic waves emitted into the solar interior from the site of the flare. Acoustic egression power maps at 3 and 6 mHz with a 2 mHz bandpass reveal a compact acoustic source strongly correlated with impulsive hard X-ray and visible-continuum emission along the penumbral neutral line separating the two major opposing umbrae in the -configuration sunspot that predominates AR10720. At 6 mHz the seismic source has two components, an intense, compact kernel located on the penumbral neutral line of the -configuration sunspot that predominates AR10720, and a significantly more diffuse signature distributed along the neutral line up to 15 Mm east and 30 Mm west of the kernel. The acoustic emission signatures were directly aligned with both hard X-ray and visible continuum emission that emanated during the flare. The visible continuum emission is estimated at J, approximately 500 times the seismic emission of J. The flare of 2005 January 15 exhibits the same close spatial alignment between the sources of the seismic emission and impulsive visible continuum emission as previous flares, reinforcing the hypothesis that the acoustic emission may be driven by heating of the low photosphere. However, it is a major exception in that there was no signature to indicate the inclusion of protons in the particle beams thought to supply the energy radiated by the flare. The continued strong coincidence between the sources of seismic emission and impulsive visible continuum emission in the case of a proton-deficient white-light flare lends substantial support to the “back – warming” hypothesis, that the low photosphere is significantly heated by intense Balmer and Paschen continuum-edge radiation from the overlying chromosphere in white-light flares.
keywords:
Sun: helioseismology – Sun: flares – Sun: oscillations1 Introduction
Although most large solar flares appear to be acoustically inactive, certain energetic flares radiate intense seismic transients into the solar interior during the impulsive phase. These wave packets radiate thousands of kilometres from the flaring region into the solar interior, but most of this energy is refracted back to the solar surface within approximately 50 Mm of the source and within an hour of the beginning of the flare. The surface manifestation is a wave-packet of ripples accelerating outward from the general source region that is sometimes obvious in raw helioseismic observations. Kosovichev & Zharkova (1998) discovered the first known instance of seismic emission, from the X2-class flare of 1996 July 9 in AR7978, identifying the phenomenon by the name “sunquake.”
For a long time these events were thought to be an extremely rare phenomenon. However, with the advancement of local helioseismic techniques such as helioseismic holography (Lindsey and Braun, 2000), we have now detected numerous seismic sources of varying intensity produced by X- and high M-class flares (Donea, Braun & Lindsey, 1999; Donea & Lindsey, 2005; Donea et al., 2006).
A subsequent extensive survey of X-class solar flares (Besliu-Ionescu et al., in preparation) led to the discovery of more than a dozen seismic emission signatures from flares. Almost all of these have occurred in complex active regions. In this paper we report on the discovery of one of the most powerful flare seismic transients detected to date and compare the acoustic signatures of this sunquake with other supporting observations.
AR10720 was a complex active region that appeared on the solar disk on 2005 January 11 and soon became one of the largest and most active sunspot regions of the current solar cycle. In the period January 15 – 20, AR10720 produced 5 X-class solar flares, including an X7.1 on January 20, which produced an intense solar proton storm. However, helioseismic observations sufficient to show seismic emission were acquired only for the X1.2 flare of January 15. This flare was observed by numerous space and ground-based solar observatories, including the Michelson Doppler Imager (MDI) instrument on board the Solar and Heliospheric Observatory (SOHO), the Reuven Ramaty High-Energy Solar Spectroscopic Imager (RHESSI), the Geostationary Operational Environmental Satellite (GOES), the Transition Region and Coronal Explorer (TRACE), and the earth-based Global Oscillations Network Group (GONG). AR10720 itself was observed by the Imaging Vector Magnetograph (IVM) at the Mees Solar Observatory in the general time frame of the 15 January 2005 flare.
In Section 2 we present a brief description of the helioseismic observations we analyzed and in Section 3 we review the technique of computational seismic holography. Section 4 consists of our results and analysis, and finally in Section 5 we present a discussion and summary.
2 The Helioseismic Observations
The MDI data consist of full-disk Doppler images in the photospheric line Ni I 6768 Å, obtained at a cadence of 1 minute, in addition to approximately hourly continuum intensity images and line-of-sight magnetograms. The MDI data sets are described in more detail by Scherrer et al. (1995). For the flare of 2005 January 15, we analyzed a dataset with a period of four hours encompassing the flare. For the purpose of our analysis, the MDI images we obtained (Dopplergrams, magnetograms and intensity continuum) were remapped onto a Postel projection (DeForest, 2004) that tracks solar rotation, with the region of interest fixed at the centre of the projection. The nominal pixel separation of the projection was 0.002 solar radii (1.4 Mm) with a pixels field of view, thus encompassing a region of approximately Mm2 on the solar surface.
3 Helioseismic Holography
We briefly review the adaptation of computational seismic holography for applications in flare seismology. In general, helioseismic holography is the phase-coherent reconstruction of acoustic waves observed at the solar surface into the solar interior to render stigmatic images of subsurface sources that have given rise to the surface disturbance. Because the solar interior refracts down-going waves back to the surface, helioseismic holography can likewise use observations in one surface region, the pupil, to image another, the focus, a considerable distance from the pupil. We call this “seismic holography from the subjacent vantage” (see fig. 4 of Lindsey and Braun (2000)). The subjacent vantage renders the photosphere as viewed by an acoustic observer directly beneath it.
In general the acoustic reconstruction can be done either forward or backward in time. When it is backward in time, we call the extrapolated field the “acoustic egression.” In the case of subjacent vantage holography, this represents waves emanating from the surface focus downward into the solar interior. When the surface acoustic field at any point in the pupil is expressed as a complex amplitude for any given frequency , the acoustic egression can be expressed as
| (1) |
In this formalism, is a Green’s function that expresses the disturbance at the focus, r, due to a measured point source at surface point from which the acoustic wave is supposed to propagate backwards in time to the focus.
The relation between the complex amplitude, , of frequency appearing in equation (1) and the real acoustic field, , representing the surface acoustic field in the MDI observations as a function of time is expressed by the Fourier transform:
| (2) |
The same applies to the acoustic egression:
| (3) |
The “egression power”,
| (4) |
is used extensively in holography of acoustic sources and absorbers. Equation (4) is used to produce egression power maps, which show compact positive signatures in the spatial and temporal neighbourhoods of localized seismic transient emitters. The signature of a localized absorber illuminated by ambient acoustic noise is a similarly sharp deficit in egression power, appearing as a silhouette against a generally positive background when rendered graphically.
In this study is separately derived from computations of over 2 – 4 mHz and 5 – 7 mHz ranges of the spectrum. In practice, there are major diagnostic advantages to the 5 – 7 mHz spectrum, as it avoids the much greater quiet-Sun ambient noise at lower frequencies, which competes unfavourably with acoustic emission into the pupil from the flare. Due to a shorter wavelength, the high frequency band also provides us with waves that have a finer diffraction limit. These advantages come at some expense in temporal discrimination, as the egression power signatures that result are temporally smeared to a minimum effective duration of order
| (5) |
This smearing operates in both directions in time, meaning that the acoustic signature of the flare , once the computation is complete, will invariably commence several minutes before the actual onset of the flare and last for several minutes afterward even if the actual acoustic disturbance was instantaneous (and no seismic signature at all reached the pupil until nearly twenty minutes after the flare began).
4 Results and Analysis
4.1 The Seismic Signatures
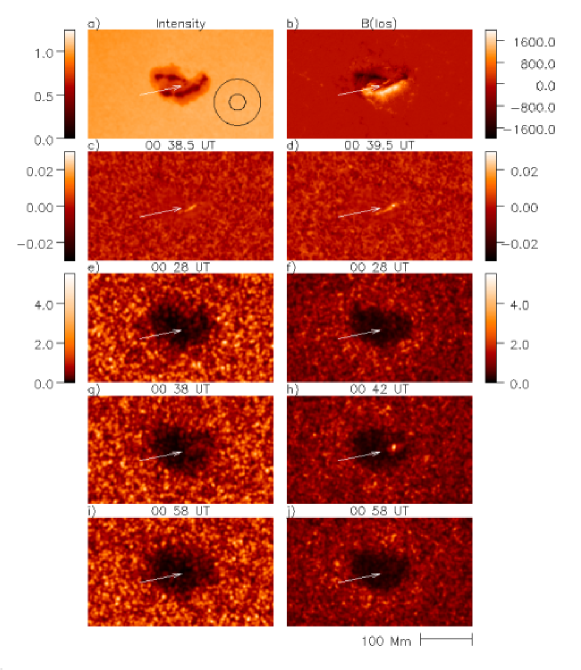
AR10720 was predominated by a single -configuration sunspot. The top row of Fig. 1 shows continuum intensity (left) and line-of-sight magnetic field (right) of the active region shortly before the flare. The 2005 January 15 solar flare in AR10720 was classified as X1.2, localized at N14E08 on the solar surface. The GOES satellite measured a Jm-2 X-ray flux in the 1-8 Å range integrated over the duration of the flare. Excess X-ray emission began at 00:22 UT, reaching a maximum at 00:43 UT, and ending at 01:02 UT. There was significant white-light emission with a sudden onset, as indicated by the intensity difference signatures shown in the second row of Fig. 1, and this coincided closely with hard X-ray (HXR) signatures indicating high-energy particles accelerated into the chromosphere. However, unlike the flares of 2003 October 28 – 29 (Donea & Lindsey, 2005), there were no signatures to indicate the inclusion of high-energy protons in these particle influxes.
To assess seismic emission from the flare, we computed the egression, , as prescribed by equation (3) over the neighbourhood of the active region at one-minute intervals in , mapping the egression power, , as prescribed by equation (4), for each value of . We call a map of evaluated at any single an egression power “snapshot.” From this point will refer to the 5 – 7 mHz bandpass simply as 6 mHz and to the 2 – 4 mHz bandpass as 3 mHz. Egression power snapshots before, during and after the flare are shown in the bottom three rows of Fig. 1 at 3 mHz (left column) and 6 mHz (right column). In these computations the pupil was an annulus of radial range 15 – 45 Mm centred on the focus (Fig. 1a).
All egression power snapshots mapped in Fig. 1 show considerably suppressed acoustic emission from the magnetic region, attributed to strong acoustic absorption by magnetic regions, discovered by Braun, Duvall & LaBonte (1988) (see also Braun (1995); Braun et al. (1998); Braun & Lindsey (1999a)). Furthermore, all 6 mHz egression power snapshots in Fig. 2 also show acoustic emission “halos,” i.e. significantly enhanced acoustic emission from the outskirts of complex active regions (Braun & Lindsey, 1999b; Donea, Braun & Lindsey, 1999).
A conspicuous seismic source is seen in the 6 mHz egression power snapshot at 00:42 UT, whose location is indicated by an arrow in all of the frames. A close examination of the source shows that it has two components. By far the most conspicuous component is an intense, compact kernel 10 Mm located on the penumbral neutral line of the -configuration sunspot. Somewhat more diffuse but clearly significant is a secondary, somewhat lenticular signature distributed along the neutral line out to 15 Mm east and 30 Mm west of the kernel. These signatures correspond closely with other compact manifestations of the flare. The kernel accounts for approximately 45 per cent of the egression power integrated over the region encompassing the flare signature, with the lenticular component outside of the kernel accounting for the rest.
The 3 mHz egression power snapshots shown in the left column of Fig. 1 actually show a considerably stronger seismic emission signature than the 6 mHz signature (right column). But, because of the much greater ambient acoustic emission at this frequency, the 3 mHz signature is not nearly as conspicuous or significant as the 6 mHz signature. It appears to have only a diffuse lenticular component and no conspicuous kernel to match the 6 mHz kernel.
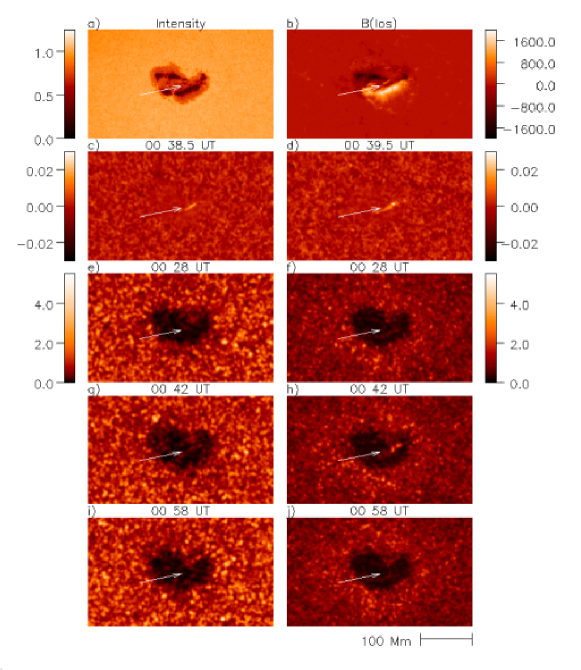
It is important to distinguish between the egression power, , and the local acoustic power, , which is the square modulus, , of the local wave amplitude at the focus, r. Each pixel in a local acoustic power map represents local surface motion as viewed directly from above the photosphere. Each pixel in the egression power map computed by subjacent vantage holography of the surface is a coherent representation of acoustic waves that have emanated downward from the focus, deep beneath the solar surface, and re-emerged into a pupil (see diagram of annulus in Fig. 1a) 15 – 45 Mm from the focus.
| Date | Class | 3 mHz | 6 mHz | 1 – 8 Å X-Rays | Visible |
|---|---|---|---|---|---|
| (ergs) | (ergs) | (ergs) | (ergs) | ||
| 1996 Jul 09 | X2.6 | ————– | |||
| 2001 Sep 09 | M9.5 | ||||
| 2003 Oct 28 | X17.2 | ————– | |||
| 2003 Oct 29 | X10.0 | ||||
| 2005 Jan 15 | X1.2 |
Fig. 2 shows local acoustic power snapshots of AR10720 at 3 mHz (left column) and 6 mHz (right column) before, during, and after the flare. As in the case of egression power (Fig. 1) all of the local acoustic power maps show a broad acoustic deficit marking the magnetic region. An enhanced local acoustic power halo surrounding the active region is clearly apparent in the 6 mHz snapshots. The acoustic signature of the flare is also clearly visible at 6 mHz. This appears to consist of a pair of kernels, a relatively stronger one nearly coinciding in location with, but slightly east of, the 6 mHz egression power kernel and a weaker one 10 Mm to west and slight north, lying on the neutral line along which the lenticular component of the 6 mHz egression power is distributed. As in the corresponding egression power snapshot, the 3 mHz local acoustic power snapshots show a stronger but still less conspicuous signature than that at 6 mHz due to a similarly much greater background acoustic power at 3 Mm.
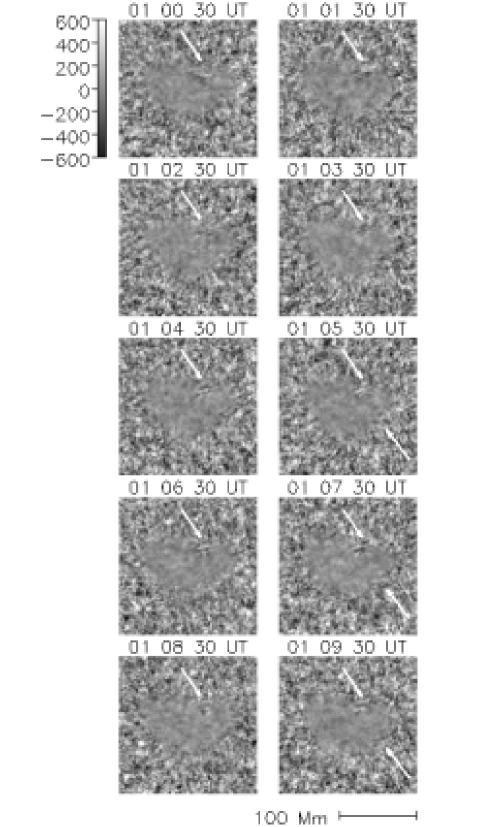
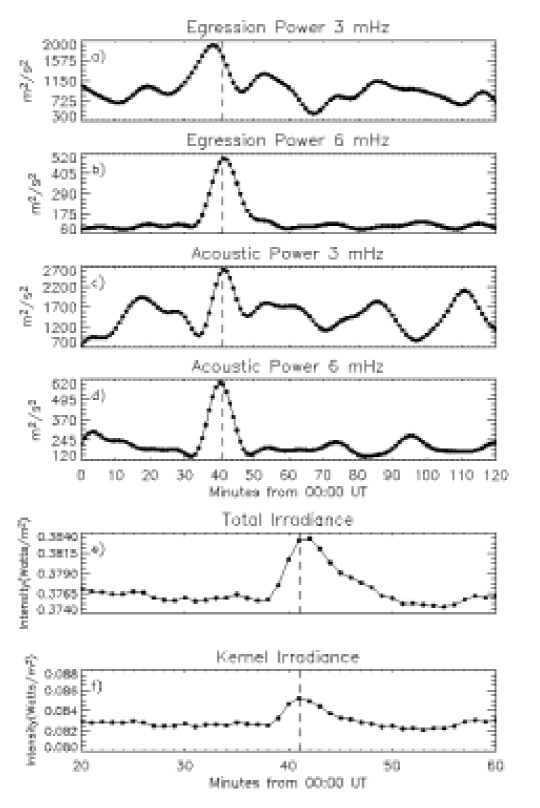
Fig. 3 shows plots of the egression and acoustic power time series in the 3 and 6 mHz bands and continuum emission in the neighbourhood of the seismic signature, discriminating continuum emission in the region of the kernel component in the 6 mHz egression power signature from the total. The flare irradiance profiles were extrapolated by applying the assumption that the irradiance is directly proportional to the GONG continuum signature in the neighbourhood of Ni I 6768 Å(Donea & Lindsey, 2005).
The flare of 2005 January 15 produced the most conspicuous acoustic signature of any flare that has produced a detectable seismic emission. This appears to be because such a large fraction of the energy was released into the high-frequency (5 – 7 mHz) spectrum, where the competing ambient acoustic power is so far suppressed. Table 1 shows the energy estimates of the seismic transients radiated into the active region subphotosphere by five flares that have produced conspicuous seismic signatures111The energy estimates in Table 1 were obtained by integrating the egression power over the neighbourhood of the seismic sources (e.g. those shown in Figs. 1g,h for the 2005 January 15 flare). This computation is blind to waves that miss the 15 – 45 Mm in the first skip. Comparative seismic holography applied to simulated acoustic transients, and to MDI observations of flares with different sized pupils, indicate that the energies quoted in Table 1 account for 80 – 95 per cent of the total, depending on the source distribution. compared with energy emitted in X-rays in the first 20 minutes of the flare. It should be noted that the 3 mHz energy for the flares preceding the 2005 January 15 flare are actually calculated at 3.5 mHz. Extrapolating through the missing 4 – 5 mHz acoustic spectrum for the flare of January 15, we project a total acoustic emission of J ( erg).
4.2 Visible Continuum Emission
Various aspects of visible continuum emission during the 2005 January 15 flare are shown in Figs. 1, 2 and 3. The visible-continuum images in Figs. 1 and 2 were obtained by MDI at 00:00 UT, 37 min before the onset of the flare. We obtained visible continuum maps of AR10720 during the flare from the GONG observatory at Mauna Loa. Technically, the GONG “continuum intensity maps” represent a measure of radiation in a 1 Å bandpass centred on the Ni I 6768 Å line, whose equivalent width is only a fraction of an Å . Frames c) and d) in Figs. 1 and 2 show the difference in continuum intensity between the GONG images 30 seconds before and after at the time indicated above the frame. Continuum emission is elongated along the magnetic neutral line, corresponding closely to the lenticular component of seismic emission seen at 00:42 UT in Fig. 1h. The brightest emission seen in the intensity difference shown in Fig. 1d comes from a very compact kernel whose location coincides very closely with that of the conspicuous kernel of 6 mHz emission (Fig. 1h).
If we assume that the continuum emission emanates isotropically from an opaque surface222The assumption is that the specific intensity is independent of the vantage, which implies that the total intensity decreases in proportion to the cosine of the angle of the vantage from normal as a result of foreshortening. If the source was assumed to be optically thin, the resulting energy estimate would be greater by a factor of two. The former appears to be the more realistic estimate for the fraction of visible continuum radiation coming directly from the chromosphere, based on the thesis that ionization of chromospheric hydrogen at the temperature minimum renders the low chromosphere opaque. the resulting estimate of the total energy emitted in the visible continuum is J ( erg). This is 500 times the total seismic energy we estimate the flare to have emitted into the holographic pupil. Continuum radiation into the neighbourhood of the 6 mHz kernel signature was J ( erg). This accounted for 30 per cent of the total, as compared to 45 per cent of the 6 mHz seismic signature. Continuum emission from in the neighbourhood of the 6 mHz kernel was significantly more sudden than that of the remainder of the acoustic signature.
The 2005 January 15 flare contributes to recent findings that relatively small flares can emit disproportionate amounts of acoustic energy (Donea et al., 2006). However, even in these cases the fraction of the energy that is released by the flare into the solar interior acoustic spectrum remains relatively small.
4.3 The Surface Ripples
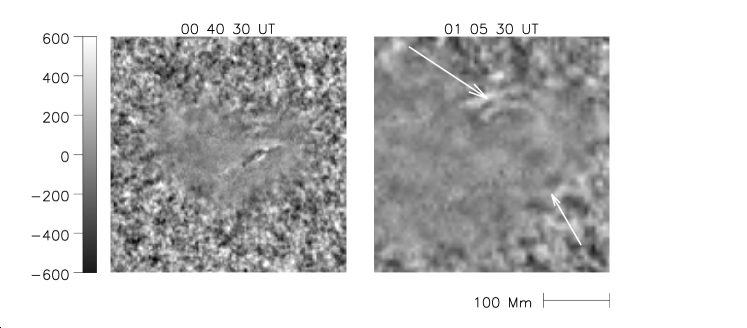
Holography allows us to image the acoustic source of the sunquake when the surface manifestation of the seismic emission is difficult to detect. In the case of the exceptionally powerful seismic transient from the flare of 2005 January 15, the surface signature is quite evident in the raw MDI Doppler observations, a point to which A. Kosovichev (2005, private communication) drew our attention shortly after we reported the discovery of the sunquake to him. To extract the seismic oscillations in the observations we subtracted consecutive MDI Doppler images separated by one minute in time. We applied this Doppler-difference method to a period of observation (1 hour) around the time of the flare. Results are shown in Figs. 4 and 5.
The Doppler signature of the flare is clearly evident at 00:40 UT (Fig. 5, left panel). At approximately 20 minutes after the appearance of the flare signature in the sunspot photosphere (at 01:00 UT), we are able to see the seismic response of the photosphere to the energy deposited by the flare in the form of “ripples” on the solar surface. In the sequence of one-minute Doppler-difference images in Fig. 4, we can see the asymmetrical ring-shaped wave packet propagating from the flare site with the first wave-crest appearing approximately 12 – 15 Mm from the flare in a North-Easterly direction. The lower half of the wave-packet has a much smaller amplitude and is propagating in a South-Westerly direction. The arrows in Fig. 4 indicate the location of the observed wave fronts. The Doppler-difference images in Fig. 5 show a close-up of the active region at the time of the flare (at 00:40:30 UT, left panel) and the resulting ring-shaped wave packet (at 01:05:00 UT, right panel).
The wave-packet was seen to propagate to a maximum distance of approximately 21 Mm from the flare signal, hence travelling a total distance of 6 – 9 Mm and lasting for about 8 minutes on the surface, after which the wave amplitude dropped rapidly and the disturbance became submerged in the ambient noise. The lower half of the wave-packet (propagating towards the South – Western part of the active region, indicated by the lower of the two arrows superimposed on the Doppler-difference images in Figs. 4 and 5) was much smaller in amplitude and obscured for much of the 8 minutes.

4.4 Hard X-Ray Emission
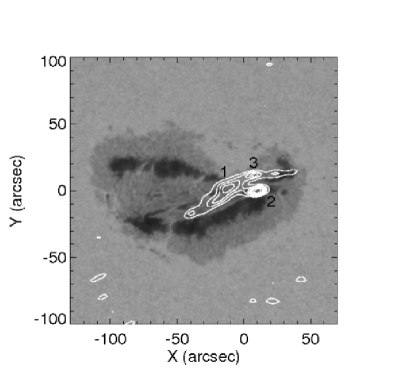
The TRACE data for the 2005 January 15 flare in the white-light channel have a variable cadence for the period 00:00:00 – 01:00:00 UT. Fig. 6 shows the TRACE white-light image taken at 00:17:54 UT, approximately 10 minutes before the onset of the X1.2 flare with the RHESSI 12-25 keV contours overlaid. The RHESSI HXR image is averaged over the period 00:41:33 – 00:42:34 UT. The time of peak intensity in this energy band occurs at 00:42:04 UT, a close temporal correlation with the maximum of the seismic emission detected at 6 mHz. The HXR emission is thought to represent bremsstrahlung emission from high-energy coronal electrons impinging into the chromosphere (Brown, 1971).
The 12 – 25 keV emission at 00:42:00 UT extends along the neutral magnetic line. We identify three compact HXR sources (see the numbers in Fig. 6). Source 2 is the strongest, while source 3 is the weakest. These could represent the foot-points of a complex magnetic loop. However, source 1 (which emits 50 per cent of the total flux) spatially coincides with the lenticular component of the 6 mHz seismic source (see Fig. 1). This reinforces the role of non-thermal particles in supplying the energy that drives the seismic emission. Similar comparisons have been observed in other flares (Donea & Lindsey, 2005).
Furthermore, Fig. 7 reveals that the velocity impulse of the flare in the sunspot photosphere was almost as sharp as the HXR flux detected in the 4 – 25 keV (0.5 – 4 Å) energy range by the GOES satellite, but the maximum HXR emission (observed at 00:43:00 UT) appears to have occurred 2 minutes after the maximum velocity depression at the photosphere (00:41:00 UT). In fact, a sudden drop of approximately 100 ms-1 in the mean velocity of the Doppler signal (an upflow) is observed in the 3 minute period from 00:38:00-00:41:00 UT. The RHESSI HXR peak in the higher energy band of 25 – 50 keV plotted in Fig. 7 occurs at 00:41:00 UT, which temporally coincides with both the maximum of the seismic source at 6 mHz and the velocity depression at the photosphere. We also note that the peak emission in the 3 – 12 keV energy band detected by both GOES (1 – 8 Å) and RHESSI (occurring at 00:44:00 and 00:47:00 UT respectively, but not plotted), also have a close temporal correlation with the maximum of the seismic emission.
5 Discussion and Summary
The X1.2-class flare of 2005 January 15 produced one of the most powerful sunquakes detected to date and by far the most conspicuous, on account of exceptionally powerful emission above 5 mHz from a compact source. Certain qualities exhibited by the flare of January 15 are shared by all other known acoustically active flares. The first is the coincidence between strong compact acoustic sources and nearby signatures of HXR emission. This suggests that high-energy particles supply the energy that drives the acoustic emission, and it is evident from the electromagnetic emission attributed to these particles that they contain more than sufficient energy for this purpose. The appearance of sudden, conspicuous white-light emission from the flare of 2005 January 15 closely co-spatial with the location and morphology of the holographic signatures is similarly characteristic of all other known acoustically active flares so far.
Kosovichev & Zharkova (1998) proposed that seismic emission into the solar interior in sunquakes is the continuation of a chromospheric shock and condensation resulting from explosive ablation of the chromosphere and propagating downward through the photosphere into the underlying solar interior. Chromospheric shocks are well known under such circumstances, based on red-shifted H emission at the flare site at the onset of the flare. The theory of their dynamics was worked out at length by Fisher, Canfield & McClymont (1985a, b, c) and others since. The hypothesis that solar interior emission is a direct continuation of such shocks was considered by Donea & Lindsey (2005), who found the signature of a strong downward-propagating chromospheric transient in Na D1-line observations of the flare of 2003 October 29. However, we are now aware of similar chromospheric transient signatures with no significant attendant holographic signature to indicate seismic emission into the active region subphotosphere333An example is seen in the western foot-point of the magnetic loop that hosted 2003 October 29 flare (see right frame in second row of fig. 8 labelled “Red [0 min]” in Donea & Lindsey (2005)). The corresponding signature of sudden white-light emission, seen in fig. 9 of the same, shows only a weak signature at the same location. The seismic signature, seen in the lower left corner of the upper right frame of fig. 11 of the same, shows correspondingly weak seismic emission.
In these instances, the signature of sudden white-light emission is relatively weak. Following Machado et al. (1989), Donea et al. (2006) proposed to attribute the lack of seismic emission where there is a strong chromospheric transient but only a weak or absent white-light signature to strong radiative damping that depletes the chromospheric transient before its arrival into the low photosphere.
In all acoustically active flares encountered to date, there is a strong spatial correlation between the sources of seismic emission and sudden white-light emission. This remains conspicuously the case for the flare of 2005 January 15, as a comparison between Figs. 1d and 1h shows. In some instances, e.g. the large flares of 2003 October 29, the source of the white-light emission has been much more extensive than the source of the acoustic emission, the former many times the area of the latter and encompassing it. However, in these instances the temporal profile of visible continuum emission significantly away from any of the sites of seismic emission has been comparatively sluggish and diffuse. What has particularly and consistently distinguished the white-light signature in the neighbourhood of the acoustic emission has been the suddenness of its appearance, on a time scale of a minute or two, and possibly considerably less than a minute given that the observations of continuum emission associated with flares to date have been limited to a cadence of one minute.
It should be kept in mind that the energies released in known seismic transients have invariably been a small fraction of the energy released into the visible continuum spectrum. The actual fraction has varied considerably, from a few millionths, in the case of the flare of 2003 October 29 (Donea & Lindsey, 2005), to a few thousandths, for the flare of 2005 January 15. However, if only the sudden-onset continuum emission in the neighbourhood of the seismic sources is included, then the ratio for the flare of 2003 October 29 is similar to that of the flare of 2005 January 15. This is what is listed in Table 1 of this study.
The close coincidence between the locations of sudden white-light emission and seismic transient emission in all acoustically active flares to date suggests that a substantial component of the seismic emission seen is a result of sudden heating of the low photosphere associated with the visible continuum emission seen. A complete analysis of wave emission as a result of transient heating involves detailed considerations of energy and momentum balance. An approximate account of these was undertaken by Donea et al. (2006). Basic considerations of momentum balance are described in Section 4.3 of Donea et al. (2006), adapting the discussion by Canfield et al. (1990) of momentum balance in chromospheric transients to transients similarly excited by sudden heating in the low photosphere.
Donea et al. (2006) devised a rough, preliminary physical model to estimate the energy of the seismic transient to be emitted as a result of sudden, momentary heating of the low photosphere to a degree consistent with the transient white-light signature closely coincident with the seismic source in the M9.5-class flare of 2001 September 9. Their estimate expressed the energy, , of the seismic transient in terms of the thermal energy, , radiated or dissipated into the low photosphere, and the fractional increment, , in pressure that would result from the heating:
| (6) |
where is the -folding height of the photospheric density. This relation appears to be roughly consistent with the few-percent continuum intensity variations observed for the flare of 2001 September 9, if the relation between and , the variation in continuum intensity, can be approximated by the Stefan-Boltzmann law,
| (7) |
and the heating is accomplished within a duration not excessively longer than s, where is the acoustic cutoff frequency in the low photosphere (see Section 4 of Donea & Lindsey (2005)). A similar exercise applied to the flare of 2005 January 15 leads to similar results. In fact, the ratio of the seismic energy to the electromagnetic energy is roughly the same for both of these flares, as are the mean intensity increments if credible boundaries are chosen over which to take the mean. To the extent that we can resolve the fine details, acoustic emission from the flare of 2005 January 15 could reasonably be the result of photospheric heating similar to that of the 2001 September 9 flare but over approximately twice the area. Differences between the two flares could be attributed to differing photospheric or subphotospheric thermal conditions and differing magnetic fields, for which the foregoing approximation contains no account.
A detailed examination of the physics of heated magnetic photospheres is needed to lend credibility to the hypothesis that seismic emission from acoustically active flares is driven by sudden heating of the low photosphere by any mechanism whatever. At this point we will only say that this hypothesis appears to be consistent with our present limited understanding of the observations. However, there is some controversy as to the implications of visible continuum emission during flares with respect to heating of the low photosphere. In the case of the flares of 2003 October 28 – 29, the signature of high-energy protons along with the particles that gave rise to X-ray emission lent considerable weight to the interpretation of visible continuum emission in terms of a heated low photosphere, as protons are sufficiently massive to penetrate to the bottom of the photosphere and heat it directly by collisions. The flare of 2005 January 15, on the other hand, confronts us with an instance of intense seismic emission with no indication of high-energy protons among the energetic particles that supply the energy on which the acoustic emission depends. Energetic electrons consistent with HXR signatures cannot penetrate into the low photosphere in anywhere near sufficient numbers to account for the heating required by the seismic signatures (Metcalf, Canfield & Saba, 1990). Chen & Ding (2006) also affirm that the white-light flare signatures highlight the importance of radiative back-warming in transporting the energy to the low photosphere when direct heating by beam electrons is impossible.
In such cases, it appears to be well established that the origin of white-light emission would have to be entirely in the chromosphere, where energetic electrons dissipate their energy (Metcalf, Canfield & Saba, 1990; Zharkova & Kobylinskii, 1991, 1993), mainly by ionizing previously neutral chromospheric hydrogen approximately to the depth of the temperature minimum. Nevertheless, even in these instances, it appears that the low photosphere itself would be significantly heated as a secondary, but more or less immediate, effect of chromospheric ionization. This is primarily the result of Balmer and Paschen continuum edge recombination radiation from the overlying ionized chromospheric medium, approximately half of which we assume radiates downward and into the underlying photosphere. When the intensity, , of this downward flux is commensurate with a temperature perturbation, , consistent with the Stefan-Boltzmann law (equation [7]), the result of such a flux is understood to be heating of the low photosphere such as to bring about a temperature increment of roughly this order within a few seconds (Donea et al., 2006; Machado et al., 1989; Metcalf et al., 2003). Heating of the photosphere by the mechanism described above is known as “back-warming” (Metcalf et al., 2003) and a substantial fraction of the continuum emission seen in white-light flares is thought to represent the downward flux from an ionized chromosphere thermally re-emitted by the now heated photosphere. In this light, the strong correlation between sources of white-light and seismic emission into the solar interior might be regarded as strong support for the back-warming hypothesis when this relation persists in flares devoid of protons among the high-energy particles that drive the flare. This is certainly the case for the flare of 2005 January 15.
Donea & Lindsey (2005) and Donea et al. (2006) summarize our understanding of the relationship between the efficiency of seismic emission and the suddenness of the heating that drives the seismic transient. Based on these considerations, one has to suspect that the perceptibly more sudden profile of continuum emission in the neighbourhood of the kernel component of the 6 mHz emission accounts to a significant degree for the disproportionate power in the 6 mHz egression-power signature. This is one of the many aspects of flare acoustics that would benefit from detailed modelling, including a careful account of magnetic forces.
At this point, our understanding of seismic emission from flares remains relatively superficial. However, evidence for the general involvement of photospheric heating is now considerable. What is needed for further understanding is detailed modelling with a careful account of the physics, including radiative transfer and magnetic forces in realistic sunspot photospheres and subphotospheres. With such an understanding, acoustic emission from flares could contribute major benefits to seismic diagnostics of active region subphotospheres and the physics of mode conversion (Cally, 2000).
Acknowledgments
We have benefited greatly from the insights of Drs. T. Metcalf and V. Zharkova. We also greatly appreciate comments by Dr. A. McClymont. Dr. A. Kosovichev drew our attention to certain interesting aspects of the surface ripples caused by the seismic transient, of which the holographic signatures represent the sources rendered in Figs. 1g,h. The research reported here heavily utilized data obtained by the MDI instrument on the SOHO spacecraft, operated by the National Aeronautics and Space Administration (NASA) and the European Space Agency (ESA). This work further utilized data obtained by the GONG++ project, managed by the National Solar Observatory, a Division of the National Optical Astronomy Observatories, which is operated by AURA, Inc. under a cooperative agreement with the National Science Foundation. This research was supported by grants and contracts from the Astronomy and Stellar Astrophysics Branch of the National Science Foundation. It was also supported by NASA’s Sun-Earth Connection/Solar Heliospheric Physics Program.
References
- Braun (1995) Braun D. C., 1995, ApJ, 451, 859
- Braun, Duvall & LaBonte (1988) Braun D. C., Duvall T. L. Jr., LaBonte B. J., 1988, ApJ, 335, 1015
- Braun et al. (1998) Braun D. C., Lindsey C., Fan Y., Fagan M., 1998, ApJ, 502, 968
- Braun & Lindsey (1999a) Braun D. C., Lindsey C., 1999a, ApJ, 510, 494
- Braun & Lindsey (1999b) Braun D. C., Lindsey C., 1999b, ApJ, 513, L79
- Brown (1971) Brown J. C., 1971, Solar Phys., 18, 489
- Cally (2000) Cally P. S., 2000, Solar Phys., 192, 395
- Canfield et al. (1990) Canfield R. C., Zarro D. M., Metcalf T. R., Lemen J. R., 1990, Solar Phys., 348, 333
- Chen & Ding (2006) Chen Q. R., Ding M. D., 2006, ApJ , 641, 1217
- DeForest (2004) DeForest C. E., 2004, Solar Phys., 219, 3
- Donea, Braun & Lindsey (1999) Donea A. -C., Braun D. C., Lindsey C., 1999, ApJ, 513, L143
- Donea & Lindsey (2005) Donea A. -C., Lindsey C., 2005, ApJ, 630, 1168
- Donea et al. (2005) Donea A. -C., Besliu D., Cally P. S., Lindsey C., 2005, in Leibacher J., Uitenbroek H., Stein B., eds, ASP Conf. Ser., Solar MHD: Theory and Observations - A High Spatial Resolution Perspective, Astron. Soc. Pac., in press
- Donea et al. (2006) Donea A. -C., Besliu-Ionescu D., Cally P. S., Lindsey C., Zharkova V. V., 2006, Solar Phys., accepted June 2006
- Fisher, Canfield & McClymont (1985a) Fisher G. H., Canfield R. C., McClymont A. N., 1985a, ApJ, 289, 414
- Fisher, Canfield & McClymont (1985b) Fisher G. H., Canfield R. C., McClymont A. N., 1985b, ApJ, 289, 425
- Fisher, Canfield & McClymont (1985c) Fisher G. H., Canfield R. C., McClymont A. N., 1985c, ApJ, 289, 434
- Hudson (1972) Hudson H. S., 1972, Solar Phys., 24, 414
- Kosovichev & Zharkova (1998) Kosovichev A. G., Zharkova V. V., 1998, Nature, 393, 317
- Lindsey and Braun (1999) Lindsey C., Braun D. C., 1999, ApJ, 510, 494
- Lindsey and Braun (2000) Lindsey C., Braun D. C., 2000, Solar Phys., 192, 261
- Machado et al. (1989) Machado M. E., Emslie A. G., Avrett E. H., 1989, Solar Phys., 124, 303
- Metcalf, Canfield & Saba (1990) Metcalf T. R., Canfield R. C., Saba J., 1990, ApJ, 365, 391
- Metcalf et al. (2003) Metcalf T. R., Alexander D., Hudson H. S., Longcope D., 2003, ApJ, 595, 483
- Scherrer et al. (1995) Scherrer P. H. et al., 1995, Solar Phys., 162, 129
- Zharkova & Kobylinskii (1991) Zharkova V. V., Kobylinskii V. A., 1991, Sov. Astron. Lett., 17, 34
- Zharkova & Kobylinskii (1993) Zharkova V. V., Kobylinskii V. A., 1993, Solar Phys., 143, 249