SYSTEMATIC ERROR ON WEAK PHASE FROM
AND .
111Submitted to Physics Letters B.
Michael Gronau
Physics Department, Technion – Israel Institute of Technology
32000 Haifa, Israel
Jonathan L. Rosner
Enrico Fermi Institute and Department of Physics, University
of Chicago
Chicago, Illinois 60637.
When CP asymmetries in are combined using broken flavor
SU(3) with decay rates for and/or , one can
obtain stringent limits on the weak phase which are consistent
with those obtained from other CKM constraints. Experimental data in the past
few years have improved to the extent that systematic errors associated with
uncertainty in SU(3) symmetry breaking dominate the determination of .
We obtain a value , where the first error
is statistical while the second one is systematic.
Time-dependent CP-violating asymmetries in the decays
and their charge conjugates can provide useful information
on the weak phase or of the Cabibbo-Kobayashi-Maskawa
(CKM) matrix. These quantities
and , defined by [1]
(1)
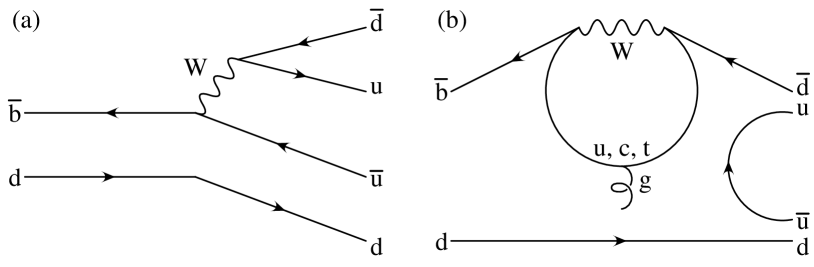
are respectively and in the limit in
which a single “tree” amplitude, as shown in Fig. 1 (a),
dominates the decay.
The two asymmetries are modified by a contribution
from the “penguin” amplitude [Fig. 1 (b)] [1, 2].
The theoretically most precise method for determining in the presence of
a penguin amplitude is based on
applying an isospin analysis to all three decay modes and their
charge-conjugates [3]. The current precision of this method,
limited by a sizable decay rate for and by a large experimental error in
[4], does not permit a
complete construction of the two isospin triangles describing and
amplitudes. Thus, the three decay rates and corresponding direct
CP asymmetries lead to a rather large systematic error of in [5].
An alternative way of treating a subsidiary penguin amplitude in
is by estimating its contribution with the help of flavor SU(3) and the decays ,
which are dominated by a penguin contribution [6]. In this approach,
a theoretical uncertainty in estimating the penguin amplitude is translated into
a smaller relative error in because of the subdominant nature of a penguin
amplitude in . This suppression of error is expected to be somewhat
less effective here than in , where a smaller penguin contribution
estimated using has been shown to lead to a systematic error of
only several degrees in [7], smaller than the error
associated with an isospin analysis in [5].
Figure 1: Examples of decay topologies for . (a) Tree;
(b) penguin.
In Ref. [8] we demonstrated the precision on
obtained when deriving the penguin amplitude in
either from (a pure-penguin process) or
(a process with a small tree contribution). Data available in May 2004 from
BaBar [9] and Belle [10],
(2)
implied averages
(3)
Using these data and extracting the penguin amplitude from (just slightly
more restrictive than using ), we found that or , depending on SU(3)-breaking factors.
With the current value of
obtained from CP asymmetries dominated by the subprocess
[4], this would entail or .
We anticipated
that reduction of the errors by a factor of two would not present difficulties.
The experimental data have improved significantly in the past few years.
Asymmetries reported recently by BaBar [11] and Belle [12],
with errors only about half the size of errors in (3). A similar
reduction of errors by a factor two occurred in ratios of to branching ratios affecting the extraction of [see
Eq. (22) below.] Old and new charge-averaged branching ratios
for these processes, in units of , are tabulated in Table I.
Table I: Old and new branching ratios for and
(in units of ).
Year
2004
2007
The purpose of the present note is to use the improved data for obtaining with an
experimental error, and to confront a systematic theoretical error in related
to patterns of flavor SU(3) symmetry breaking.
We shall update our analysis of Ref. [8], using patterns
for SU(3) breaking which differ by , quote the
associated systematic uncertainty in , and compare with a contemporary
analysis [13].
The reader may consult Refs. [6, 8] for earlier references
and notation. We recapitulate the main formulae for and .
We integrate out the top-quark contribution in the penguin transition
and use unitarity of the CKM matrix. Absorbing a term in the tree
amplitude , one writes
(6)
The tree and penguin amplitudes, which involve magnitudes of
CKM factors, and , are taken to be real
and positive and the strong phase is taken to lie in the range
. For , .
The asymmetries and are given by [1]
In the absence of a penguin amplitude () one has . To first order in , one finds
(12)
(13)
so that in the linear approximation the allowed region in the
plane is confined to an ellipse centered at ,
with semi-principal axes
and . We will use the exact expressions
(9)–(11).
Given a value of , as already measured in
[4], the observables and provide two equations for
or , , and . At least one additional constraint is needed to
determine or .
The decay amplitudes are described in terms of primed quantities,
and [14]. We introduce an SU(3) breaking factor
in tree amplitudes assuming that these amplitudes factorize
[15]
[see discussion two paragraphs below Eq. (23)],
but begin by assuming an arbitrary SU(3)-breaking factor
in determining from , as factorization is not expected to hold
for penguin amplitudes [16, 17]:
(14)
Here
(15)
Contributions of amplitudes involving the spectator quark are expected to be
suppressed by relative to those
considered [14, 17]. This includes exchange and penguin
annihilation amplitudes () in and an annihilation
amplitude () in . Evidence for small is provided
by an upper limit on [4, 18].
We will neglect these contributions, but will include the effect of in the
systematic error.
In this approximation one may express amplitudes in terms of those
contributing to :
(16)
(17)
The CP asymmetry in the first process vanishes, while that of
Each of the two charge averaged rates and provides
an additional constraint on the three parameters and .
Normalizing these rates by
, we define two ratios
(19)
given by
(20)
(21)
Using branching ratios in Table I and the lifetime ratio [4]
, one finds the following values for and
,
(22)
As mentioned, the 5% errors here are half those quoted in Ref. [8].
Here as in Ref. [6] we have applied small corrections for phase
space factors.
Figure 2: Values of plotted against for values of
spaced by 2 degrees (solid curves) and spaced by 5 degrees
(dashed contours), with a parameter describing the degree of
SU(3) violation in the ratio . The degree of penguin “pollution” is
estimated in (a) from and in (b) from .
Figure 3: Same as Fig. 2 but with .
Figure 4: Same as Fig. 2 but with .
Eqs. (9)-(11) and either (20) or (21) provide three
equations for and , for given and for a given
SU(3)-breaking parameter describing the ratio of and
penguin amplitudes. Eq. (20) or (21) may be used to
eliminate . Thus, in Figs. 2, 3 and 4 we
plot and as functions of and for three
values of the SU(3) breaking parameter, , and
. The latter is the central value of ,
obtained by solving Eq. (18) using and
branching ratios from Table I, the value of in
(5), and [4].
The error ellipses in Figs. 2, 3 and 4
describing the measurements (5) encompass somewhat different
ranges for (or ) and . The three corresponding pairs
of ranges are
(23)
Here we have taken in each figure the union of the regions allowed by
constraints (a) and (b) from and rather than their
intersection. The small differences between the values
following from these two constraints, at the level of a degree or two, should
be included in the systematic rather than statistical errors. These differences
may be associated with neglecting an annihilation amplitude in the ratio
.
As in Ref. [13], we find a very small statistical error in
of only 4 degrees. The systematic error in associated with
uncertainty in SU(3) breaking is larger. The change from to and shifts down by and up by ,
respectively. Similarly, under these changes becomes more negative by
about and less negative by about , respectively.
We now discuss some additional possible sources of systematic error. They
all indicate that the range we quote for systematic errors is probably
conservative.
(1) Because we have absorbed a term in the tree amplitude , as
noted above Eq. (6), one might question the applicability of factorization to
the estimate (14) of . We have investigated the
effect of replacing in this expression by a parameter with
range similar to that allowed for . We find very little dependence
on , with variations between 0.79 and 1.22 leading to variations of
and of at most a degree or two. This may be seen from
Eq. (21) with replaced by . The second term in
the numerator, proportional to and , is much smaller than the
first, proportional to and independent of . For a reasonable
value of –0.5 and for , one
has while . The
third term in the numerator, , is negligible.
(2) The determinations of and in which the penguin
pollution in is obtained from the decay via Eq. (20) are trivially independent of , as they
do not require the estimate of at all. It is then reassuring that
they are consistent within a degree or two with those obtained from
Eq. (21).
(3) The relation (18) between partial width differences now
becomes
(24)
and with the observed values of branching ratios and CP asymmetries may be
used to constrain the product
(25)
Indeed, the case illustrated in Fig. 3, discussed in Ref. [13], violates these bounds, and is only viable if, as in
that work, one favors the BaBar result [11] implying a smaller
direct asymmetry in .
(4) One can extrapolate beyond the values of shown in Figs. 2–4
if desired. The upper and lower limits on are shown for a range
of and the nominal value in Fig. 5.
The lower limit is based on the lower limit of the
constraint for . It implies only
the rather weak bound . However, even the choice
would suggest that SU(3) breaking acts in opposite ways for
the tree and penguin, an unlikely circumstance given the tendencies of
form factors involving final-state strange quarks to be enhanced relative to
those involving nonstrange quarks.
Figure 5: Dependence on of upper and lower limits on . The
three cases discussed in Figs. 2–4 are shown as plotted points. The
dashed vertical line corresponds to the lower limit
discussed in the text.
(5) The neglect of possible and contributions is an approximation
based on theoretical estimates which can only be fully justified once
the branching ratio for has been shown to lie definitively
below , as we have emphasized in several previous references
(see, e.g., [18]). The present upper limit is about three
times this value [4]. One should not take the unexpectedly large
branching ratio for as evidence for large ,
as it can be explained by a larger-than-expected contribution from the
color-suppressed tree amplitude [21].
To summarize, the time-dependent asymmetries in have
realized their statistical potential in pinning down weak phases, implying
.
The relative strong phase between penguin and tree amplitudes is found
to be . The systematic errors quoted
here are those associated with likely uncertainties in flavor-SU(3) breaking.
Under exceptional circumstances (such as an anomalously small non-strange
penguin amplitude) the systematic errors could even exceed those quoted.
In order to add useful information to this
largely model-independent discussion, explicit theoretical calculations such
as QCD-factorization [15], Soft Collinear Effective Theory
(SCET) [17] or Perturbative QCD (pQCD) [22] need to predict
with an accuracy better than the systematic error of approximately
found above.
J. L. R. is grateful to J. Trân Thanh Vân for the opportunity
to present a preliminary version of these results at the XLII Rencontre
de Moriond, La Thuile, 2007, and for hospitality during the conference. This
work was supported in part by the United States Department of Energy through
Grant No. DE FG02 90ER40560, by the Israel Science Foundation
under Grant No. 1052/04, and by the German-Israeli Foundation under
Grant No. I-781-55.14/2003.
References
[1] M. Gronau, Phys. Rev. Lett. 63 (1989) 1451.
[2] D. London and R. D. Peccei, Phys. Lett. B 223 (1989) 257;
B. Grinstein, ibid.229 (1989) 280.
[3]
M. Gronau and D. London,
Phys. Rev. Lett. 65 (1990) 3381.
[4] Heavy Flavor Averaging Group, hep-ex/0603003, as updated
periodically at
http://www.slac.stanford.edu/xorg/hfag/.
[5] M. Gronau,
Int. J. Mod. Phys. A 22 (2007) 1953.
[6] M. Gronau and J. L. Rosner, Phys. Rev. D 65 (2002)
093012; M. Gronau and J. L. Rosner, Phys. Rev. D 66 (2002) 053003.
[7]
M. Beneke, M. Gronau, J. Rohrer and M. Spranger,
Phys. Lett. B 638 (2006) 68.
[8] M. Gronau and J. L. Rosner,
Phys. Lett. B 595 (2004) 339.
[9] BaBar Collaboration, presented by H. Jawahery, Proceedings of the XXI
International Symposium on Lepton and Photon Interactions, Fermilab, Batavia,
USA, August 11–16 2003.
[10] K. Abe et al. [Belle Collaboration],
Phys. Rev. Lett. 93 (2004) 021601.
[11] B. Aubert et al. [BaBar Collaboration],
arXiv:hep-ex/0703016, submitted to Phys. Rev. Letters.
[12] K. Abe et al. [Belle Collaboration],
arXiv:hep-ex/0608035v2, submitted to Phys. Rev. Letters.
[13] R. Fleischer, S. Recksiegel and F. Schwab,
Eur. Phys. J. C 51 (2007) 55.
[14] M. Gronau, O. F. Hernandez, D. London and J. L. Rosner,
Phys. Rev. D 50 (1994) 4529; ibid.52 (1995) 6374.
[15]
M. Beneke, G. Buchalla, M. Neubert and C. T. Sachrajda,
Phys. Rev. Lett. 83 (1999) 1914;
Nucl. Phys. B 606 (2001) 245;
Phys. Rev. D 72 (2005) 098501.
[16]
M. Ciuchini, E. Franco, G. Martinelli and L. Silvestrini,
Nucl. Phys. B 501 (1997) 271;
M. Ciuchini, R. Contino, E. Franco, G. Martinelli and L. Silvestrini,
Nucl. Phys. B 512 (1998) 3;
[Erratum-ibid. B 531 (1998) 656];
M. Ciuchini, E. Franco, G. Martinelli, M. Pierini and L. Silvestrini,
Phys. Lett. B 515 (2001) 33.
[17] C. W. Bauer, D. Pirjol, I. Z. Rothstein and I. W. Stewart,
Phys. Rev. D 70 (2004) 054015; ibid.72 (2005) 098502. See also J. Chay and C. Kim, Phys. Rev. D 68 (2003) 071502; Nucl. Phys. B 680 (2004) 302.
[18]
B. Blok, M. Gronau and J. L. Rosner,
Phys. Rev. Lett. 78 (1997) 3999.
[19]N. G. Deshpande and X. G. He, Phys. Rev. Lett. 75 (1995)
1703; X. G. He, Eur. Phys. J. C 9 (1999) 443.
[20]
M. Gronau and J. L. Rosner, Phys. Rev. Lett. 76 (1996) 1200;
A. S. Dighe, M. Gronau and J. L. Rosner, Phys. Rev. D 54 (1996) 3309.
[21]
C. W. Chiang, M. Gronau, J. L. Rosner and D. A. Suprun,
Phys. Rev. D 70 (2004) 034020;
A. J. Buras, R. Fleischer, S. Recksiegel and
F. Schwab, Phys. Rev. Lett. 92 (2004) 101804;
S. Baek, P. Hamel, D. London, A. Datta and
D. A. Suprun, Phys. Rev. D 71 (2005) 057502;
C. W. Chiang and Y. F. Zhou, JHEP 0612 (2006) 027.
[22] Y. Y. Keum, H. n. Li and A. I. Sanda,
Phys. Lett. B 504 (2001) 6; Phys. Rev. D 63 (2001) 054008;
Y. Y. Keum and H. n. Li,
Phys. Rev. D 63 (2001) 074006; H. n. Li, S. Mishima and A. I. Sanda,
Phys. Rev. D 72 (2005) 114005.