XMM-Newton observations of Nova Sgr 1998
Abstract
We report on X-ray observations of Nova Sagittarius 1998 (V4633 Sgr), performed with XMM-Newton at three different epochs, 934, 1083 and 1265 days after discovery. The nova was detected with the EPIC cameras at all three epochs, with emission spanning the whole energy range from 0.2 to 10 keV.
The X-ray spectra do not change significantly at the different epochs, and are well fitted for the first and third observations with a multi-temperature optically thin thermal plasma, while lower statistics in the second observations lead to a poorer fit. The thermal plasma emission is most probably originated in the shock heated ejecta, with chemical composition similar to that of a CO nova. However, we can not completely rule out reestablished accretion as the origin of the emission. We also obtain upper limits for the temperature and luminosity of a potential white dwarf atmospheric component, and conclude that hydrogen burning had already turned-off by the time of our observations.
1 Introduction
Nova Sgr 1998 (V4633 Sgr) was discovered by Liller (1998) on 1998 March 22.3 UT, with magnitude 7.8, and it was confirmed spectroscopically by Della Valle et al. (1998) two days later, with relatively low expansion velocities and presence of iron, thus indicating that the nova belonged to the Fe II class (Williams, 1992). The nova light curve (Liller & Jones, 1999) indicated that it was moderately fast, with t28 days and t55 days. No indication of optical polarization was found in further observations by Ikeda, Kawabata & Akitaya (2000). Lipkin et al. (2001) performed optical observations during the period 1998–2000, which revealed two photometric periodicities; the shorter and constant period of 3.014 h was interpreted as the orbital period, whereas the longer and slightly variable period of 3.08 h could be interpreted as the spin period of the white dwarf, in a nearly synchronous magnetic system. Near-infrared spectroscopy, in the range 0.8 to 2.5 m, obtained 525 and 850 days after peak brightness by Lynch et al. (2001), revealed some symmetric lines with widths (FWHM) of 1800 km/s. There was no evidence of dust formation and the shell was hydrogen-deficient. The reddening was very uncertain (E(B-V)=, yielding A for R=3.1), thus leading to a very uncertain distance, d9 kpc (d=8.92.5 kpc, Lipkin et al. (2001)).
Nova Sgr 1998 was one of the targets included in our monitoring programme of recent galactic novae in X-rays, during the first cycle of the XMM-Newton satellite. The main goal of our observations was to determine the turn-off times of hydrogen burning. Novae are the consequence of explosive hydrogen burning, through a thermonuclear runaway, on top of an accreting white dwarf in a close binary system, of the cataclysmic variable type. It is theoretically predicted that novae return to hydrostatic equilibrium after the ejection of a fraction of the accreted envelope. X-ray emission in post-outburst novae can arise through three different mechanisms. First, as the envelope mass is depleted, the photospheric radius decreases at constant bolometric luminosity (close to the Eddington value) with an increasing effective temperature. This leads to a hardening of the spectrum from optical through ultraviolet, extreme ultraviolet and finally soft X-rays, with the post-outburst nova emitting as a supersoft source with a hot white dwarf atmosphere spectrum. The duration of this soft X-ray emission is related to the nuclear burning timescale of the remaining H-rich envelope (see, for instance, Table 1 in Gehrz et al. (1998)) and depends among other factors on the white dwarf mass (Tuchman & Truran, 1998; Sala & Hernanz, 2005a, b). The second site of X-ray emission in post-outburst novae is the ejected shell. Internal or external shocks can heat the expanding gas up to temperatures of a few keV, leading to the emission of X-rays with a thermal plasma spectrum. Finally, when accretion is reestablished in the cataclysmic variable, the accretion flow is responsible for the emission of X-rays, also with a thermal plasma spectrum.
A systematic search for X-ray emission of classical novae was performed by Orio et al. (2001a) in the ROSAT archival data, which contained observations of 108 classical and recurrent novae, 39 of which were less than 10 years old. Contrary to expectations, just a few novae were detected in X-rays, and only three of them with a soft X-ray spectrum: GQ Mus (Nova Mus 1983, already discovered by EXOSAT in 1983, Ögelman (1984)), V1974 Cyg (Nova Cyg 1992, Krautter et al. (1996); Balman et al. (1998)), and Nova LMC 1995 (Orio & Greiner, 1999). GQ Mus is renowned for having the longest soft X-ray emission phase (around 9 years; Ögelman et al. (1993); Shanley et al. (1995); Balman & Krautter (2001)). Other novae were detected in X-rays with ROSAT, but without any soft component: V351 Pup (Nova Pup 1991, Orio et al. (1996)), and V838 Her (Nova Her 1991, Lloyd et al. (1992); O’Brien et al. (1994)). Finally, only 11 out of the 81 galactic quiescent novae observed by ROSAT were detected in hard X-rays. For all these non soft X-ray sources, the poor spectral resolution and/or limited spectral range of the detectors left the origin of the emission (either shocked ejecta or reestablished accretion) unclear.
After the ROSAT era, observations by Beppo-SAX and Chandra revealed new interesting results. A soft component was reported for V382 Vel (Nova Vel 1999) which lasted for 7.5–8 months and contained a wealth of emission lines never previously detected in novae (Orio et al., 2002; Burwitz et al., 2002). In the case of V1494 Aql (Nova Aql 1999 No.2), a soft component appeared 6–10 months after the explosion, with a puzzling light curve including a short burst and oscillations (Drake et al., 2003). Observations of the recurrent nova CI Aql by Greiner & Di Stefano (2002) showed a soft component, but its spectrum implied an emitting radius of only 40 km for this source, which is too small for a white dwarf. In addition, supersoft X-ray emission 6 months after outburst, with strong temporal variation was reported by Ness et al. (2003) and Petz et al. (2005) for V4743 Sgr (Nova Sgr 2002 No.3).
XMM-Newton also contributed with some more observations of novae. X-ray emission with a soft spectrum was detected from Nova LMC 1995 by Orio et al. (2003) more than 5.5 years after the explosion. This component was not detected in later observations by Orio (2004) in 2003. X-rays were also detected from Nova LMC 2000 by Greiner et al. (2003) on days 17 and 51 after outburst, with a thermal plasma emission related to the ejecta and fading away on day 294. Finally, in the case of V2487 Oph (Nova Oph 1998), Hernanz & Sala (2002) detected X-ray emission with a broad thermal plasma spectrum extending up to keV and a fluorescent Fe Kα line, clearly indicating the reestablishement of accretion in a magnetic cataclysmic variable.
X-ray observations of classical novae during their post-outburst stages provide crucial information about the nova phenomenon (Orio, 1999, 2004; Krautter, 2002): soft X-rays yield a unique insight into the remaining nuclear burning on top of the white dwarf, while hard X-rays reflect the shocks in the ejecta in the post-outburst novae, and the properties of the accretion flow in the “quiescent novae”. In view of the scarcity of objects observed and the diversity of behaviours detected, only the monitoring of as many novae as possible, with large sensitivity and spectral resolution (as those offered by XMM-Newton and Chandra) can help to understand and solve these issues. The observations of Nova Sgr 1998 with XMM-Newton reported in this paper contribute to achieve this goal. In §2 we describe the observations, and in §3 the spectral analysis of the data is explained in detail. Discussion follows in §4 and a summary in §5.
2 Observations
The X-Ray Multi-Mirror Mission, XMM-Newton, is an X-ray astrophysics observatory (see Jansen et al. (2001) for a general description) including three X-ray telescopes, each with an European Photon Imaging Camera (EPIC) at its focal plane, and an optical/UV telescope, OM (Mason et al., 2001). The detectors of two of the EPIC cameras use MOS CCDs (Turner et al., 2001), whereas the third one uses pn CCDs (Strüder et al., 2001). In addition, two Reflection Grating Spectrometers (den Herder et al., 2001) for high resolution X-ray spectroscopy are mounted in the light path of the two EPIC MOS cameras.
We observed Nova Sgr 1998 at three epochs, with intervals of 6 months between observations: October 11, 2000, March 9, 2001 and September 7, 2001 (i.e., 934, 1083 and 1265 days after outburst; see Table 1). Exposure times ranged from 6 ks to 9 ks. While the source was clearly detected with the EPIC MOS1, MOS2 and pn cameras, the signal to noise ratio was too small to detect it with the RGS instruments.
Data were reduced using the XMM-Newton Science Analysis System (SAS 6.5.0). Standard procedures described in the SAS documentation (Loiseau, 2005; Snowden et al., 2004) were applied. New calibration files affecting the soft spectrum of observations of the first XMM-Newton cycle were released in January 2006 (Kirsch, 2006), and the pipeline products of some exposures of our observations were not available in the archive. Therefore, we reprocessed the original Observation Data Files (ODFs) for all exposures using the most recent calibrations. Only events with pattern smaller than 12 (MOS) and 4 (pn) and with pulse height (PI) in the range 0.2–12 keV (MOS) and 0.2–15 keV (pn) were selected for spectral analysis. Flaring background periods affecting some EPIC-pn exposures were filtered by creating good time interval (GTI) filter tables that were used for further event select procedures. Source photons were extracted from a circle of 35”, and the background was extracted from a region of the same area, close to the source but free from source photons, and keeping the same distance to the readout node (RAWY) as the source region (Kirsch, 2006). The statistics of our observations were not good enough to perform timing analysis, which would have been interesting to determine the presence of some periodicity, as observed in the optical by Lipkin et al. (2001).
3 Spectral analysis
The X-Ray Spectral Fitting Package (XSPEC 11.3, Arnaud & Dorman (2003)) was used for spectral analysis. For each observation, the spectra of the three EPIC cameras (pn, MOS1 and MOS2) were simultaneously fitted. An absorbing column density compatible with or smaller than the interstellar value was obtained for all spectral models. A column density smaller than the interstellar NH is clearly unphysical, and the spectral fits never indicate a larger value. Therefore, we froze it in all our fits to NH= 1.6cm-2, which is the average interstellar column density in the direction of Nova Sgr 1998 (Dickey & Lockman, 1990). This value is also consistent with the NH derived from the measured extinction (Lynch et al., 2001), through the empirical relationship between interstellar X-ray absorption and optical extinction (Gorenstein, 1975).
3.1 Spectral models
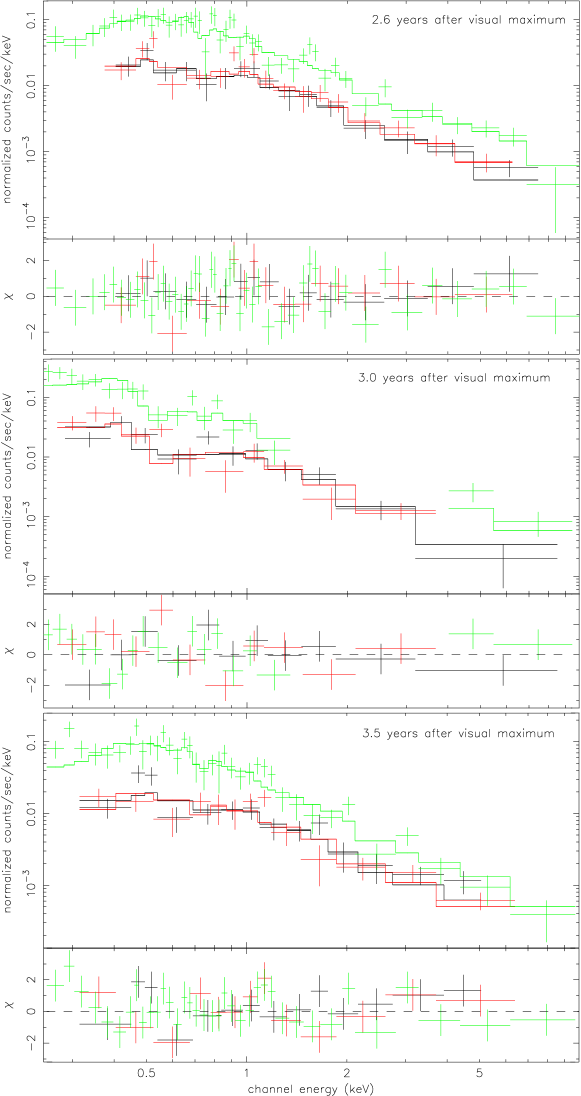
A first look at the data (Fig. 1) clearly shows that the emission spans the whole energy range of the EPIC instruments, keV, with a spectrum harder than that produced by residual H-burning on top of the white dwarf. This immediately indicates that the emission must be dominated by either the hot ejected shell, or by a reestablished accretion flow. We thus fit the EPIC spectra with a multi-temperature optically thin thermal plasma, simulated with a Raymond-Smith model (Raymond & Smith, 1977) in XSPEC. The main processes included in this model are bremsstrahlung, recombination continua and line emission. More sophisticated models such as MEKAL (Mewe et al., 1995) are senseless for our data, since these models require a larger number of parameters whereas we have a low number of counts. We checked, however, that the results obtained with MEKAL and Raymond-Smith models are similar. A single temperature thermal plasma model is completely unable to fit the data, because the emission spans a broad energy range. At least two components at different temperatures are needed to obtain a reasonable fit, with the best fit being obtained for a three-temperature model.
Since the thermal plasma emission can arise either in the ejecta or in the accretion flow, two kinds of chemical composition are possible: solar abundances (for an accretion flow), or metal enriched (for the nova ejecta). In this latter case, the underlying white dwarf of the nova can have two different compositions: carbon-oxygen (CO) for masses M⊙, or oxygen-neon (ONe) for masses up to the Chandrasekhar limit. Here we use realistic compositions of the ejecta from José & Hernanz (1998). We tested their 14 ejecta compositions, corresponding to CO and ONe nova models with masses ranging from 0.8 to 1.15 M⊙ and 1.0 to 1.35 M⊙, respectively, and degrees of mixing between accreted mass and underlying core from 25 to 75 %. In general, the best fit is obtained for low-mass CO novae (see below for details).
We also considered the possible contribution of residual H-burning on the post-outburst white dwarf (again CO or ONe). We used white dwarf atmosphere emission models, gently provided by Jim MacDonald (MacDonald & Vennes, 1991), and built tables to be read as external models in XSPEC. Previous studies have shown the importance of including white dwarf atmosphere models instead of simple blackbodies for a correct spectral analysis of novae or supersoft X-ray sources (Balman et al., 1998; Balman & Krautter, 2001; Orio & Greiner, 1999).
3.2 Results
A three temperature (3T) optically thin thermal plasma model provides a good fit for the three EPIC cameras spectra of the first observation. The fit is only slightly poorer for the third observation, while the poor statistics lead to a much worse fit at the second epoch. However, no other model provides a better fit and the physical origin of the emission is very likely to be the same in all our observations. Therefore, we fit the spectra at the three epochs with the same 3T plasma model.
Figure 1 (upper panel) shows Nova Sgr 1998 spectra in October 2000, 934 days (2.6 years) after the explosion, with the best fit model and the residuals in units of . The 3T plasma model provides a good fit to the EPIC MOS1, MOS2 and pn data, both simultaneously and individually. The 3T model was used only after checking that a two temperature plasma model (which would be preferred because of its simplicity) results in a worse fit (see Table 2), leaving significant residuals, in particular around 1 keV. We also attempted to fit the spectra with a cooling flow model, which is a good representation of a multi-temperature plasma in accretion disks in old novae (Mukai et al., 2003). However, the spectrum is not well fitted with this model: with Tlow=0.08 keV, Thigh=3 keV and normalization constant M⊙/yr, the reduced is 2.9; therefore we should rule out the cooling flow model for Nova Sgr 1998.
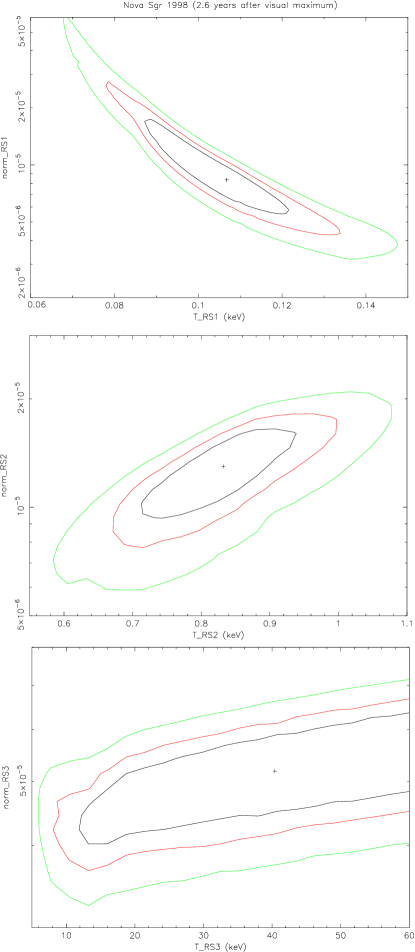
Table 3 shows the best-fit parameters for the 3T plasma models both with solar and with CO nova abundances. In both cases, the three temperatures are around 0.1, 0.8 and keV (probably indicating a continuous distribution between the two extremes). The main difference between the results with different abundances lies in the emission measures (EM, defined as , with ne and ni the electronic and ionic densities, respectively). The EM for the coolest component in the solar case is extremely large (by itself and when compared with the EM of the intermediate and high temperature components). But this problem disappears when a CO plasma is considered, because the emission measure for the coolest component decreases by a factor of 100. The difference is due to the strong emission lines at energies at 0.1-1 keV for the C, N and O enriched abundances. Confidence contours for the parameters of the three components are displayed in Figure 2.
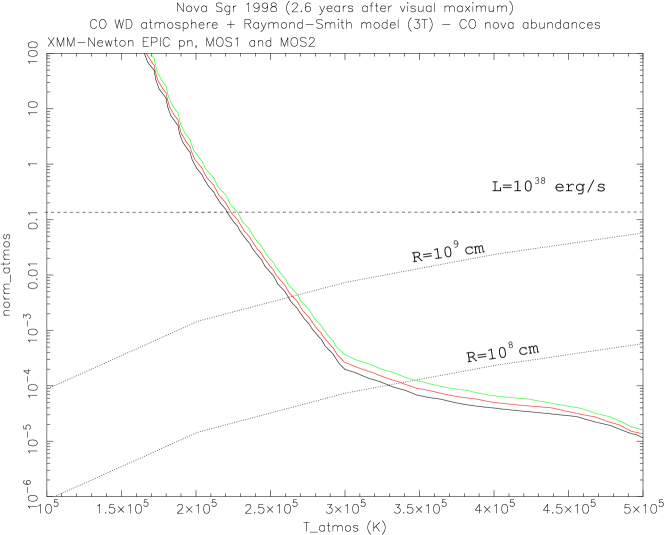
The presence of a soft X-ray atmospheric component in the spectrum of Nova Sgr 1998 can not be ruled out, but only upper limits can be established (Fig. 3). They include a broad confidence region of the Teff-Lbol parameters, but taking into account the path of a post-outburst nova on the Teff-Lbol diagram, we can conclude that hydrogen burning had already turned off by the time of our first observation. The initial evolution of a post-outburst nova follows a constant bolometric luminosity path (close to Eddington limit, i.e., erg/s for a 1M⊙ white dwarf) with increasing effective temperature (Kato & Hachisu, 1994; Sala & Hernanz, 2005b). If Nova Sgr 1998 had been in this first phase with high luminosity at the time of our observation, 2.7 years after the outburst, it would have been at high temperature. But for a high luminosity, the upper limits for our first observation are compatible only with low temperatures, which would indicate an extended envelope. This is highly unlikely for a nova 2.6 years after the outburst. Therefore we conclude that hydrogen burning had already turned-off by the time of our first observation. The upper limits are however compatible with a cooling white dwarf: taking cm as a hard lower limit for the radius of the degenerate star, Fig. 3 indicates that it was colder than K.
The second observation (3.0 years after the explosion, middle panel in Fig 1) provided lower signal to noise data (due to a smaller exposure time, less than in the first observation, Table 1). For completeness, we include a fit similar to that used for the first and third observations. Despite the large error ranges, the best-fit parameters (Table 3) indicate a slight softening of the spectrum, with lower temperatures for the first and third component.
The fit results for the third observation (3.5 years after the explosion, lower panel in Fig 1), are similar to the first one. However, the emission measures for the intermediate and highest temperature components are a bit smaller, whereas that associated with the coolest component is larger than one year before. This evolution is compatible with some cooling of the plasma between the first and third epochs.
4 Discussion
The optically thin thermal plasma emission may originate either in the shocked expanding nova shell or in the accretion flow. The problem of distinguishing between these two possibilities has already been faced in the case of other sources: Nova Pup 1991 (Orio et al., 1996), Nova Her 1991 (Lloyd et al., 1992; O’Brien et al., 1994), Nova Cyg 1992 (Krautter et al., 1996; Balman et al., 1998), Nova Vel 1999 (Orio et al., 2001b; Mukai & Ishida, 2001). We discuss below some properties of the models which could help to disentangle the origin of the emission: luminosity and emission measure (i.e., value and temporal evolution of electronic density).
The unabsorbed X-ray (0.2–10 keV) luminosity for Nova Sgr 1998 is in the range erg/s in all cases, for a distance of 9 kpc (Lipkin et al., 2001). Distances to novae are quite uncertain, and Nova Sgr 1998 is not an exception (d=8.92.5 kpc), but a factor of in distance only changes the luminosity by a factor of . This luminosity is too large to originate from the accretion onto a non-magnetic white dwarf (typically erg/s, Kuulkers et al. (2003)), or in a polar cataclysmic variable (with luminosities erg/s, Mukai (2003); Ramsay & Cropper (2004)). However, it could be related to accretion in an intermediate polar, with luminosities erg/s (Mukai, 2003). In fact, optical observations suggested that Nova Sgr 1998 is a nearly synchronous magnetic system (Lipkin et al., 2001), and photometric observations of other post-novae indicate that some are intermediate polars (for instance, V697 Sco, Warner & Woudt (2002)).
The X-ray luminosity of Nova Sgr 1998 is also compatible with the observed values for nova ejecta. For example, Nova Her 1991 emitted erg/s only five days after outburst, fading afterwards extremely quickly (Lloyd et al., 1992; O’Brien et al., 1994); Nova Cyg 1992 ejecta X-ray emission reached erg/s around 150 days after outburst (Balman et al., 1998); Nova Pup 1991 emitted around erg/s 16 months after outburst (Orio et al., 1996); and Nova Vel 1999 also reached L erg/s in the band above 0.8 keV 15 days after maximum (the shell luminosity was even larger, since emission lines detected below 0.8 keV also originated in the ejecta), but it decreased to a few erg/s 5.5 months later (Orio et al., 2001b, 2002). In all those previous cases the ejecta cooled much faster than in Nova Sgr 1998. However, the expected cooling time for the electronic densities, ne, in nova ejecta (in general smaller than ) are larger than 10 years (Brecher et al., 1977; Ögelman, 1987). Therefore, X-ray emission from shock heated ejecta in Nova Sgr 1998 3.5 years after the outburst would be fully compatible with theoretical predictions of cooling times.
For a shock-heated plasma, temperatures are related to velocity as kT (Brecher et al., 1977). For the expansion velocities observed by Lynch et al. (2001) (1800 km/s, on days 525 and 850 after outburst), the plasma temperature would be 3 keV, which lies within the range of temperatures of our best-fit thermal plasma models. Coronal lines, which are a good signature of shocks in the plasma, were also present in those observations, supporting the presence of a shocked ejecta in Nova Sgr 1998. Assuming an expansion at constant velocity, the emission volume at the time of our observations would be increasing from (for day 934) to (day 1265). With these volumes and the emission measures for CO models from Table 3, electronic densities, , in the shell would evolve from (day 934) to (day 1265) for the coolest component. Similarly, decreases from to 500 cm-3, and from to for the intermediate and high temperature components, respectively. Since the spherical geometry gives the maximum emitting volume, these are lower limits. The small agree with the thinning of the ejecta found between days 525 and 850 by Lynch et al. (2001).
The electronic density in a spherical shell with its outer radius expanding at constant velocity evolves with time as t-3, while in an expanding shell of constant thickness evolves as t-2 (Lyke et al., 2003). With the first expansion picture, a decrease of by a factor is expected between the first and the third observations, while the decay would be by a factor of in the second case. For Nova Sgr 1998, the derived above for the CO model changes by a factor of 0.8 for the coolest thermal plasma component. For the intermediate and hottest components decreases by 0.5, the expected factor for an expanding shell of constant thickness. Therefore, the evolution also supports the expanding ejecta as the possible site of the observed X-ray emission. However, the large errors associated with ne (in particular for the lowest temperature component) prevent a clear conclusion about the shell geometry.
5 Summary
The X-ray spectrum of Nova Sgr 1998 as observed by XMM-Newton between 2.6 and 3.5 years after outburst is dominated by thermal plasma emission. The best-fit is obtained with a three-component thermal plasma model, with temperatures between 0.1 and 40 keV. Thermal plasma models with different compositions (solar, and several abundances from realistic nova ejecta) have been tried. The best-fit is obtained with either the abundances of a CO nova shell (for 0.8 M⊙ and 25% mixing), or with solar abundances. The first case would correspond to emission from the expanding nova shell, while the second would be associated with reestablished accretion in the cataclysmic variable.
The X-ray luminosity, the values of the plasma temperatures, the chemical composition, and the distribution and evolution of emission measures point to shock heated ejecta as the most likely origin for the plasma emission, rather than resumed accretion in the cataclysmic variable. Also the inability to fit the data with a cooling flow model casts doubts on accretion as the origin of the X-ray emission. Finally, the spectra of Nova Sgr 1998 do not show any fluorescence iron line, contrary to what was observed for V2478 Oph (Hernanz & Sala, 2002), which clearly indicated that accretion was reestablished in the cataclysmic variable.
Regarding the presence of residual hydrogen burning on the white dwarf surface, our observations indicate that the post-outburst nova envelope had already turned off its hydrogen burning already 2.6 years after optical maximum.
References
- Arnaud & Dorman (2003) Arnaud, K., Dorman, B. 2003, XSPEC User’s Guide for Version 11.3.x, (HEASARC, NASA/GSFC, Greenbelt, MD)
- Balman et al. (1995) Balman, S., Orio, M. & Ögelman, H. 1995, ApJ, 449, L47
- Balman et al. (1998) Balman, S., Krautter, J. & Ögelman, H. 1998, ApJ, 499, 395
- Balman & Krautter (2001) Balman, S. & Krautter, J. 2001, MNRAS, 326, 1441
- Balman & Ögelman (1999) Balman, S. & Ögelman, H. 1999, ApJ, 518, L111
- Brecher et al. (1977) Brecher, K., Ingham, W.H., Morrison, P. 1977, ApJ, 213, 492
- Burwitz et al. (2002) Burwitz, V, Starrfield, S., Krautter, J., Ness, J.U. 2002 in Classical Nova Explosions, eds. M. Hernanz & J. José, AIP Conference Proceedings 637, p.386
- Della Valle et al. (1998) Della Valle M., Pizzella A., Bernardi M., Jones A.F., Kiss L., Hornoch K., Schmeer P., Trigo J.M. 1998, IAUC 6848
- den Herder et al. (2001) den Herder, J.W. et al. 2001, A&A, 365, L7
- Dickey & Lockman (1990) Dickey, J.M., Lockman, F.J. 1990, ARAR, 28, 215
- Drake et al. (2003) Drake, J., Wagner, R. M., Starrfield, S., Butt, Y., Krautter, J., Bond, H. E., Della Valle, M., Gehrz, R. D., Woodward, C. E., Evans, A., Orio, M., Hauschildt, P., Hernanz, M., Mukai, K., Truran, J. W. 2003, ApJ, 584, 448
- Gehrz et al. (1998) Gehrz, R.D., Truran, J.W., Williams, R.E., Starrfield, S. 1998, PASP, 110, 3
- Gorenstein (1975) Gorenstein, P. 1975, ApJ, 198, 95
- Greiner & Di Stefano (2002) Greiner, J. & Di Stefano, R. 2002, ApJ, 578, L59
- Greiner et al. (2003) Greiner, J., Orio, M. & Schartel, N. 2003, A&A, 405, 703
- Hernanz & Sala (2002) Hernanz, M. & Sala, G. 2002, Science, 298, 393.
- Ikeda, Kawabata & Akitaya (2000) Ikeda, Y., Kawabata, K.S., Akitaya, H. 2000, A&A, 355, 256
- Jansen et al. (2001) Jansen, F. et al. 2001, A&A, 365, L1
- José & Hernanz (1998) José, J., Hernanz, M. 1998, ApJ, 494, 680
- Kato & Hachisu (1994) Kato, M., Hachisu, I. 1994, ApJ, 437, 802
- Kirsch (2006) Kirsch, M. 2006, EPIC status of calibration and data analysis, XMM-SOC-CAL-TN-0018 (ESA-ESAC, XMM-Newton SOC)
- Krautter (2002) Krautter, J. 2002, in Classical Nova Explosions, eds. M. Hernanz & J. José, AIP Conference Proceedings 637, p.345
- Krautter et al. (1996) Krautter, J., Ögelman, H., Starrfield, S., Wichmann, R. & Pfeffermann. E. 1996, ApJ, 456, 788
- Kuulkers et al. (2003) Kuulkers, E., Norton, A., Schwope, A., Warner, B. 2003, in Compact stellar X-ray sources, eds. W.H.G. Lewin, M. van der Klis, Cambridge University Press (in press; astro-ph/0302351)
- Liller (1998) Liller, W. 1998, IAUC 6846
- Liller & Jones (1999) Liller, W., Jones, A.F. 1999, IBVS, 4664, 1
- Lipkin et al. (2001) Lipkin, Y., Leibowitz, E.M., Retter, A., Shemmer, O. 2001, MNRAS, 328, 1169
- Lloyd et al. (1992) Lloyd, H. M., O’Brien, T. J., Bode, M. F., Predehl, P., Schmitt, J.H.M.M., Tr mper, J., Watson, M.G. & Pounds, K. A. 1992, Nature, 356, 222
- Loiseau (2005) Loiseau, N. 2005, Users’ Guide to the XMM-Newton Science Analysis System, Issue 3.2, (ESA/XMM-Newton Science Operations Centre, VILSPA, Madrid)
- Lyke et al. (2003) Lyke, J.E., Koenig, X. P., Barlow, M. J., Gehrz, R. D., Woodward, C. E., Starrfield, S., Péquignot, D., Evans, A., Salama, A., González-Riestra, R., Greenhouse, M.A., Hjellming, R. M., Jones, T.J., Krautter, J., Ögelman, H. B., Wagner, R. M., Lumsden, S. L., Williams, R. E. 2003, AJ, 126, 993
- Lynch et al. (2001) Lynch, D.K., Rudy, R.J., Venturini, C.C., Makuz, S. 2001, AJ, 122, 2013
- MacDonald & Vennes (1991) Mac Donald, J. & Vennes, S., 1991, ApJ, 373, L51
- Mason et al. (2001) Mason, K.O. et al. 2001, A&A, 365, L36
- Mewe et al. (1995) Mewe, R., Kaastra, J.S., Liedhal, D.A., 1995, Legacy 6, 16 (available at http://heasarc.gsfc.nasa.gov/docs/journal/meka6.html)
- Mukai & Ishida (2001) Mukai, K., Ishida, M. 2001, ApJ, 551, 1024
- Mukai (2003) Mukai, K. 2003, AdSpR, 32, 2067
- Mukai et al. (2003) Mukai, K., Kinkhabwala, A., Peterson, J.R., Kahn, S.M. & Paerels, F. 2003, ApJ, 586, 77
- Ness et al. (2003) Ness, J.-U., Starrfield, S., Burwitz, V., Wichmann, R., Hauschildt, P., Drake, J.J., Wagner, R.M., Bond, H.E., Krautter, J., Orio, M., Hernanz, M., Gehrz, R. D., Woodward, C. E., Butt, Y., Mukai, K., Balman, S., Truran, J. W. 2003, ApJ, 594, L127
- O’Brien et al. (1994) O’Brien, T.J.O., Lloyd, H.M., Bode, M.F. 1994, MNRAS, 271, 155
- Ögelman (1984) Ögelman, H., Beuermann, K. & Krautter, J. 1984, ApJ, 287, L31
- Ögelman (1987) Ögelman, H., Krautter, J. & Beuermann, K. 1987, A&A, 177, 110
- Ögelman et al. (1993) Ögelman, H., Orio, M., Krautter, J. & Starrfield, S. 1993, Nature, 361, 331
- Orio (1999) Orio, M. 1999, Physics Reports, 311, 419
- Orio et al. (1996) Orio, M., Balman, S., Della Valle, M., Gallagher, J. & Ögelman, H. 1996, ApJ, 466, 410
- Orio & Greiner (1999) Orio, M. & Greiner, J. 1999, A&A, 344, L13
- Orio et al. (2001a) Orio, M., Covington, J. & Ögelman, H. 2001a, A&A, 373, 542
- Orio et al. (2001b) Orio, M., Parmar, A.N., Benjamin, R., Amati, L., Frontera, F., Greiner, J., Ögelman, H., Mineo, T., Starrfield, S., Trussoni, E. 2001b, MNRAS, 326, L13
- Orio et al. (2002) Orio, M., Parmar, A.N., Greiner, J., Ögelman, H., Starrfield, S., Trussoni, E. 2002, MNRAS, 333, L11
- Orio et al. (2003) Orio, M., Hartmann, E., Still, M., Greiner, J. 2003, ApJ, 594, 435
- Orio (2004) Orio, M., 2004, RMXAA, 20, 182
- Petz et al. (2005) Petz, A., Hauschildt, P.H., Ness, J.-U., Starrfield, S. 2005, A & A, 431, 321
- Ramsay & Cropper (2004) Ramsay, G. & Cropper, M. 2004, MNRAS, 347, 497
- Raymond & Smith (1977) Raymond, J. & Smith, B. 1977, ApJ Suppl, 35, 419
- Sala & Hernanz (2005a) Sala, G. & Hernanz, M. 2005a, A&A, 439, 1057.
- Sala & Hernanz (2005b) Sala, G. & Hernanz, M. 2005b, A&A, 439, 1061
- Shanley et al. (1995) Shanley, L., Ögelman, H., Gallagher, J. S., Orio, M. & Krautter, J. 1995, ApJ, 438, L95
- Snowden et al. (2004) Snowden, S., Immler, S., Arida, M., Perry, B., Still, M., Harrus, I., 2004, An Introduction to XMM-NEWTON Data Analysis, Version 2.01 (NASA/GSFC XMM-Newton Guest Observer Facility, Greenbelt, MD)
- Starrfield (1989) Starrfield, S. 1989, in Classical Novae, Wiley, New York, p. 39
- Strüder et al. (2001) Strüder, L.. et al. 2001, A&A, 365, L18
- Tuchman & Truran (1998) Tuchman, Y. &Truran, J.W. 1998, ApJ, 503, 381
- Turner et al. (2001) Turner, M.J.L. et al. 2001, A&A, 365, L27
- Warner & Woudt (2002) Warner, B., Woudt, P. 2002, PASP, 114, 1222
- Williams (1992) Williams, R. 1992, AJ, 104, 725
| EPIC pn | EPIC MOS1 | EPIC MOS2 | |||||||
|---|---|---|---|---|---|---|---|---|---|
| Observation | Time after | Exposure | Count Rate | Exposure | Count Rate | Exposure | Count Rate | ||
| Date (orbit) | Discovery | Time (s) | ( ) | Time (s) | ( ) | Time (s) | ( ) | ||
| Oct.11, 2000 (154) | 934 d, 2.6 yr | 6213 | 9048 | 9051 | |||||
| Mar. 9, 2001 (229) | 1083 d, 3.0 yr | 3058 | 6575 | 6575 | |||||
| Sep. 7, 2001 (320) | 1265 d, 3.5 yr | 5883 | 9086 | 9086 | |||||
| Observation | Observation | Observation | |
|---|---|---|---|
| Solar abundances | |||
| F | |||
| L | |||
| 1.55 | 2.07 | 1.66 | |
| CO abundances | |||
| F | |||
| L | |||
| 1.37 | 2.01 | 1.57 | |
Note. — The best-fit models shown fit simultaneously the data from the three EPIC cameras. All the limits are . The emission measures and luminosities are given for a distance d=9kpc; a factor , with d the distance in kpc, affects these magnitudes. The absorption is everywhere.
| Observation | Observation | Observation | |
|---|---|---|---|
| Solar abundances | |||
| F | |||
| L | |||
| 1.16 | 1.40 | 1.22 | |
| CO abundances | |||
| F | |||
| L | |||
| 0.92 | 1.61 | 1.25 | |
Note. — Same comments as in table 2.