Element-resolved x-ray ferrimagnetic and ferromagnetic resonance spectroscopy
Abstract
We report on the measurement of element-specific magnetic resonance spectra at gigahertz frequencies using x-ray magnetic circular dichroism (XMCD). We investigate the ferrimagnetic precession of Gd and Fe ions in Gd-substituted Yttrium Iron Garnet, showing that the resonant field and linewidth of Gd precisely coincide with Fe up to the nonlinear regime of parametric excitations. The opposite sign of the Gd x-ray magnetic resonance signal with respect to Fe is consistent with dynamic antiferromagnetic alignment of the two ionic species. Further, we investigate a bilayer metal film, Ni80Fe20(5 nm)/Ni(50 nm), where the coupled resonance modes of Ni and Ni80Fe20 are separately resolved, revealing shifts in the resonance fields of individual layers but no mutual driving effects. Energy-dependent dynamic XMCD measurements are introduced, combining x-ray absorption and magnetic resonance spectroscopies.
pacs:
76.50.+g, 78.70.Dm, 78.20.Ls, 76.30.Da1 Introduction
Recent interest in magnetization dynamics has been fostered by progress in fast magnetic recording and microwave technologies [1, 2]. Despite considerable efforts, however, the description of magnetodynamics remains essentially phenomenological. Inductive, magnetoresistive, and magneto-optical techniques solely measure the integrated magnetic response of complex heterogeneous materials, typically magnetic alloys and multilayer structures, whose functionality depends on the interplay of several elements. The development of methods capable of elemental analysis constitutes an obvious advantage for investigating fundamental problems related to time- or frequency-dependent magnetization phenomena. Examples include the dynamic coupling of elemental moments in ferrites [3, 4, 5, 6], metallic alloys [7], and spin-valve heterostructures [8, 9], as well as spin-orbit induced damping effects attributed to the presence of high [5, 10, 11] and low [12] Z elements. Advances in this direction are mostly based on stroboscopic pump-probe experiments exploiting the element-resolving power of x-ray magnetic circular dichroism (XMCD) and the sub-ns bunch structure of synchrotron radiation beams. Pulsed magnetic fields in synchrony with x-ray photon bunches are usually employed to excite the reversal [8, 13] or the precessional motion [7] of the magnetization. More recently, continuous wave rf fields have been applied to excite resonant modes in trilayer metal films [14, 15] and microstructures [16, 17].
With respect to time-resolved measurements, techniques such as ferromagnetic resonance spectroscopy (FMR) offer an alternative and powerful way to gain insight into the energy scales that govern magnetization dynamics. Frequency-domain methods that allow to detect magnetic resonance using the core level absorption of circularly polarized x-rays have been developed independently by our group in the soft x-ray energy range [18] and by Goulon et al. in the hard x-ray regime [19, 20]. These methods exploit the XMCD dependence on the scalar product of the magnetization vector and photon helicity to measure the time-invariant changes of the longitudinal magnetization component as a function of microwave (MW) field and bias field . Microstrip resonators [18] and tunable cavities [21] have been employed to generate MW excitations together with different detection schemes. In the hard x-ray regime, XMCD at the edge of transition metals relates purely to orbital magnetization components; measurements at the Fe -edge and Y edges by Goulon et al. provided evidence for the precession of the Fe orbital moments as well as induced Y spin moments in yttrium iron garnet (YIG) [19, 20].
In this article, we report on different applications of soft x-ray MCD to FMR measurements and on a novel way to combine FMR and XMCD spectroscopy. Element-specific magnetic resonance spectra are measured on both magnetic oxides and metallic multilayers. We show that ferrimagnetic resonance measurements of Gd-substituted YIG are consistent with the antiferromagnetic (AFM) alignment of Gd and Fe ions in the ferromagnetic resonance mode of YIG in the non-linear regime, above the threshold for parametric spin wave excitations. Further, FMR spectra of coupled thin metal bilayers are separately resolved, allowing the investigation of interlayer dynamics in stacks of magnetic layers. Finally, we show that the x-ray FMR (XFMR) signal measured at resonance as a function of photon energy yields dynamic XMCD spectra, which relate to the magnetic state of the atoms undergoing microwave absorption. The latter can be combined with static XMCD spectra to derive information on the dynamics of the orbital and spin magnetization components.
2 Experimental
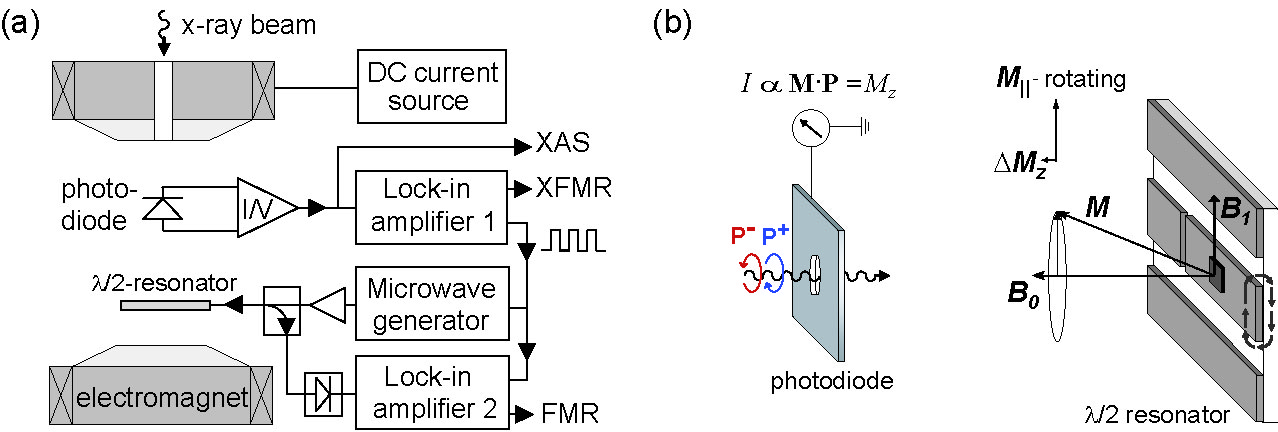
A schematic diagram of the experimental setup is given in Fig. 1. A coplanar waveguide -resonator is used to generate a MW field to 0.5 mT parallel to the sample surface with input power 0 to 34 dBm at frequency GHz. The resonator-sample assembly is positioned between the pole expansions of an electromagnet, which produces a field T aligned perpendicular to the sample surface and parallel to the photon propagation direction. In the absence of MW field, aligns with parallel to , which is the geometry commonly employed in static XMCD measurements. If is turned on, as matches the resonance field of the sample () the precessional motion of induces a reduction of the longitudinal magnetization component that can be measured as a steady-state effect in the frequency domain, i.e., without requiring sub-ns time resolution. Here, x-ray absorption spectra (XAS) corresponding to positive (P+) and negative (P-) helicity are measured by recording the dc fluorescence yield (FY) of the sample as a function of photon energy using a Si photodiode (Eurisys-Canberra, Ref. [22]). XMCD is defined as the difference spectrum P+-P- (Fig. 2). The XFMR signal, either P+ or P-, is obtained by square-modulating the MW power source at relatively low frequency ( kHz) and by measuring the corresponding amplitude of the ac FY photocurrent by means of a lock-in amplifier, as shown in Fig. 1 (a). We introduce two methods to measure magnetic resonance using XMCD: the first, in analogy with FMR spectroscopy, consists in recording the XFMR intensity during a sweep of across , fixing the photon energy in correspondence of a static XMCD peak [18]. We denote this type of measurements as XFMR B-scan, which effectively generate element-specific longitudinal magnetic resonance spectra. The second method consists in taking the sample at resonance by setting and recording the XFMR as a function of photon energy. This, denoted as XFMR E-scan, is analogous to recording XAS and XMCD spectra, but corresponding to the precessional motion of rather than to a static situation. Examples of either type of measurements will be given later.
Two different type of samples are employed in the present study: a rare earth substituted iron oxide and a metallic heterostructure, which were chosen in order to highlight the broad spectrum of materials where new insight can be obtained by XFMR. A polished 30 m-thick slab of polycristalline Gd1Y2Fe5O12 (Gd:YIG) with lateral dimensions mm2 was selected to investigate ferrimagnetic resonance in garnet systems composed of different magnetic ions. An Al(10 nm)/Ni80Fe20(5 nm)/Ni(50 nm)/Cr(5 nm) multilayer deposited on glass by e-beam evaporation in high vacuum ( mbar) was fabricated in order to address layer-specific resonance modes in metallic heterostructures. The x-ray spot size at the sample position was 0.1 mm long and 1 mm wide at full width half maximum, while the coplanar resonator had a central conductor with a width of 1.5 mm and a length of 44 mm, thus ensuring that the MW excitation covers the whole area sampled by the x-ray beam. XAS and XFMR spectra were recorded at the edges of Fe and Ni, and at the edges of Gd. XAS spectra are normalized to the incident photon flux measured by the photocurrent of an Au grid upstream from the sample, and are given in arbitrary units. Apart from normalization, the spectra are raw data; in particular, no energy-dependent correction for self-absorption has been applied. As the signal-to-noise ratio is proportional to the square root of the photocurrent [18], energy resolution has been sacrificed to intensity by opening the exit slits of the beamline monochromator. The effective energy resolution corresponds to about 1.2 and 3 eV at 700 and 1200 eV, respectively, which results in significant broadening of the multiplet features of Fe and Gd spectra in Gd:YIG, as shown in Fig. 2. This is not an essential problem for XFMR -scans, but may limit the spectral resolution of -scans; in the latter case, however, higher resolution can be achieved simple by reducing the slit apertures while increasing the averaging time to maintain a constant signal-to-noise ratio. Throughout the paper XFMR -scans are given in pA, as measured by the FY photodiode. Simultaneously with XFMR, the transverse part of the imaginary susceptibility was measured, as in conventional FMR, by monitoring the power reflected off the -resonator via a MW bridge and diode detector, as schematized in Fig. 1 (a). XFMR -scans were measured at the ID08 beamline of the European Synchrotron Radiation Facility, while -scans were recorded at the SIM beamline of the Swiss Light Source; two undulators were operated in series with % circularly polarized beams in both type of measurements.
3 Element-resolved XFMR spectra of Gd:YIG
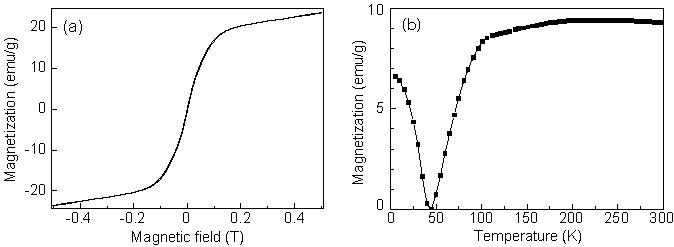
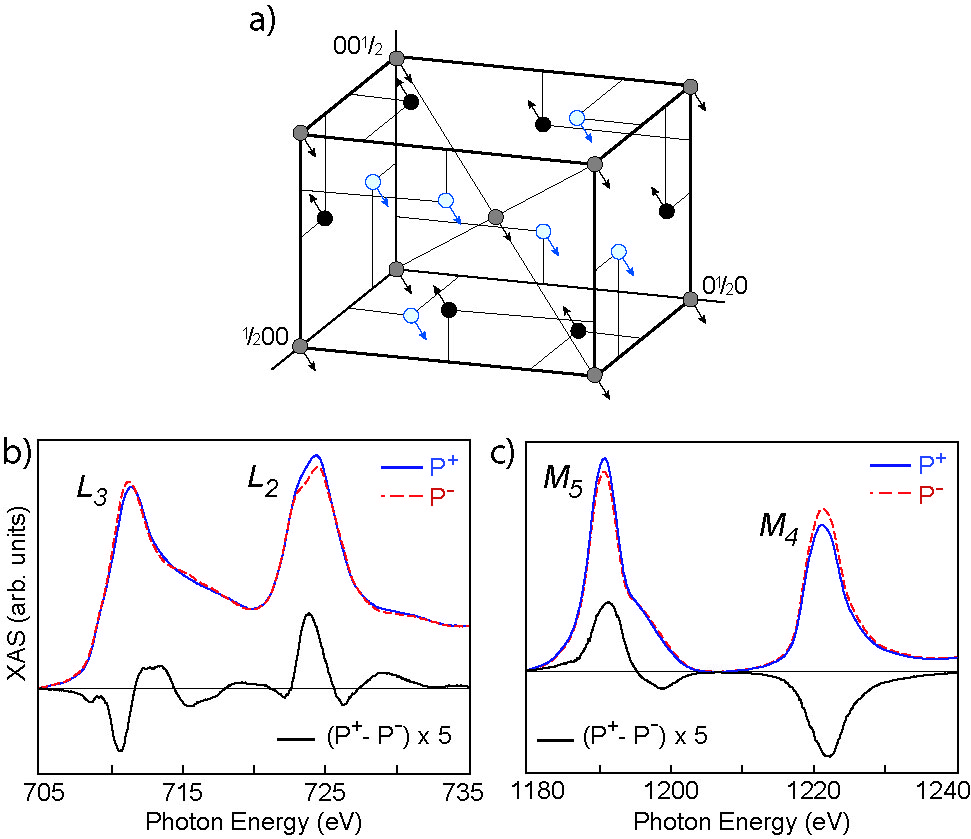
The structure of Gd1Y2Fe5O12 (Gd:YIG) consists of three sublattices [Fig. 2 (a)]. Two of them, the octahedral and tetrahedral sites, contain Fe ions which are strongly AFM coupled by superexchange. The third lattice, the dodecahedral sites, contains Gd and diamagnetic Y ions [23]. While their mutual interaction is very weak, Gd ions couple AFM to tetrahedral Fe ions with a moderate exchange field of the order of 24 T (16 K) [24]. Such a system thus effectively behaves as a two-sublattice ferrimagnet, where the Gd moments order spontaneously only at low temperature ( K). Figure 3 (a) shows the out-of-plane magnetization of Gd:YIG measured by superconducting quantum interference device magnetometry (SQUID) at room temperature. The curve is composed by a hard-axis ferromagnetic loop that saturates above 0.1 T, as expected from shape anisotropy considerations, and a linear term proportional to the applied field. The latter is a common feature of rare-earth garnets and ascribed to the continuous rotation of towards with increasing field, in accordance with Nèel’s theory of ferrimagnetism. The temperature behavior of the magnetization, shown in Fig. 3 (b), is characteristic of two AFM-coupled lattices with inequivalent magnetization. While for all rare-earth garnets the Curie temperature is associated to the pairing of Fe moments and nearly independent on rare-earth composition [23, 25], the compensation temperature depends sensibly on the rare-earth content. In Gd3Fe5O12 compensation occurs at 290 K [23]. Figure 3 (b) shows that the total magnetization of Gd1Y2Fe5O12 is approximately constant from 300 to 150 K; below this temperature magnetic order sets in throughout the Gd lattice, compensating the Fe magnetization at about 45 K. The XAS and XMCD spectra of Fe and Gd in Gd1Y2Fe5O12 recorded at room temperature with applied field T are shown in Figs. 2 (b) and (c). The opposite sign of the vs and vs intensity reflects the static alignment of the resultant against .
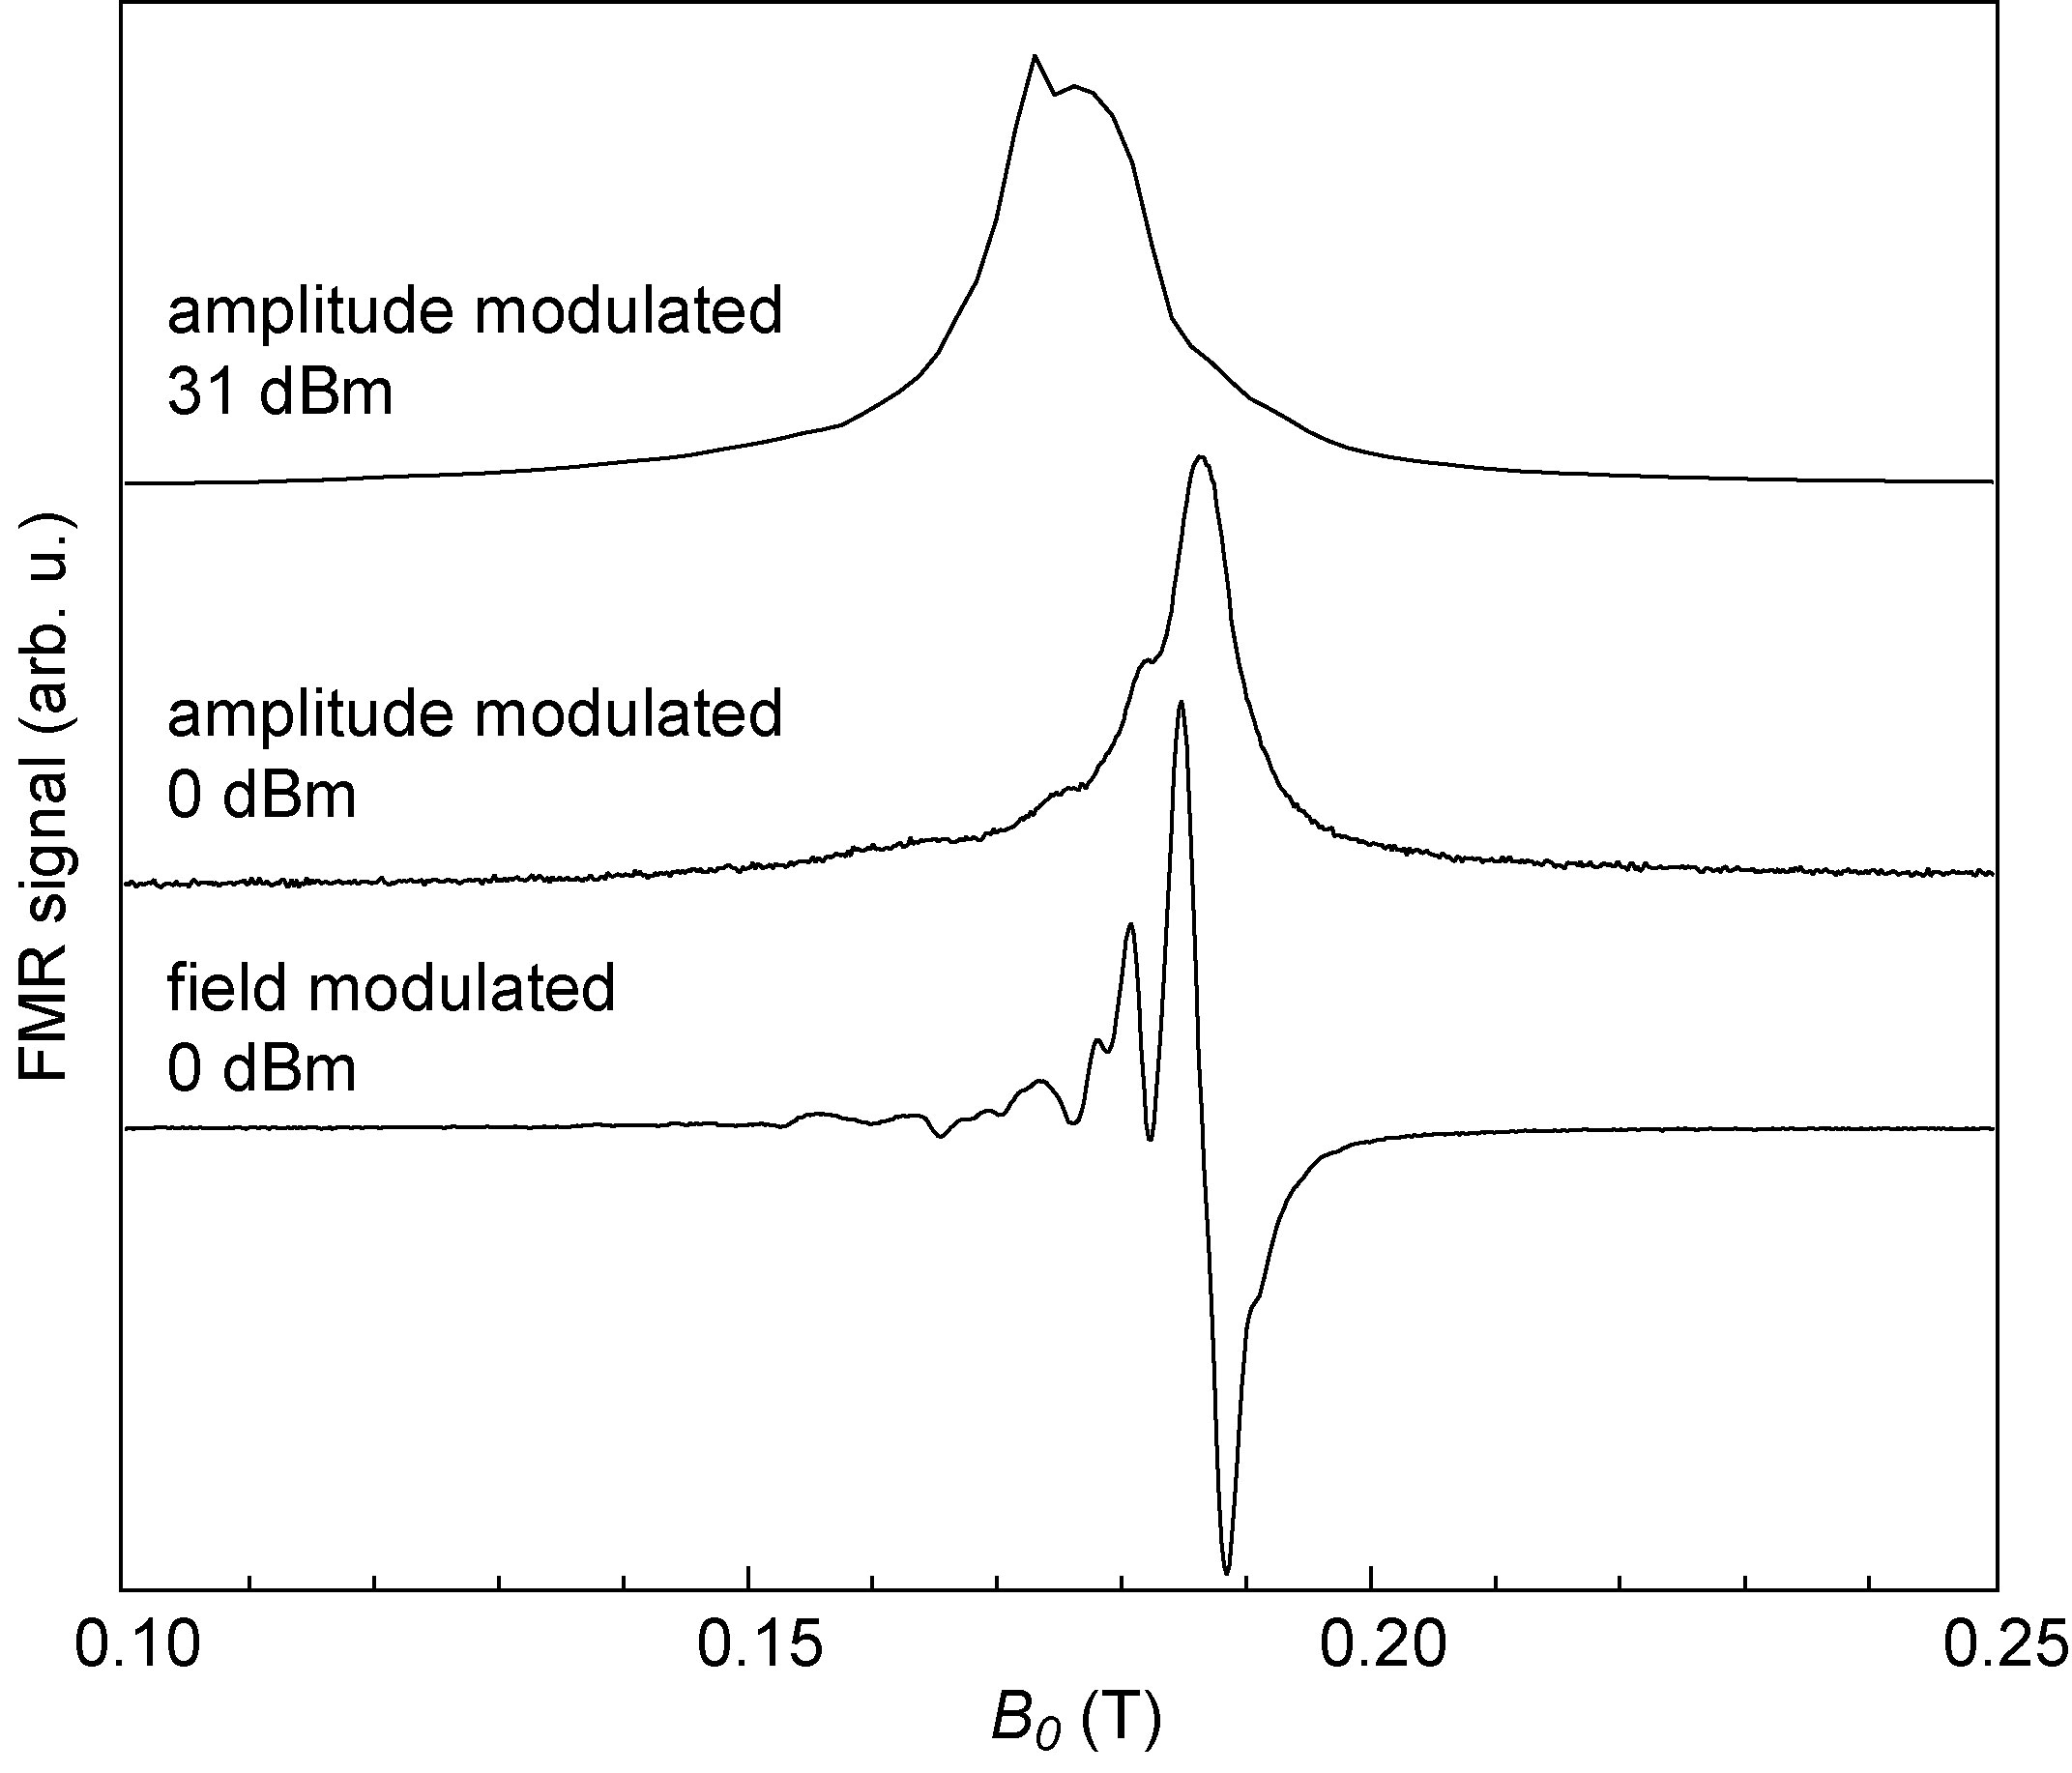
Linearization of the coupled equations of motion shows that two resonances can be excited in a ferrimagnetic compound: the ferromagnetic mode, which is independent of the exchange field since the angle between and does not vary during the precession, and the high-frequency exchange mode, where the two sublattices precess out-of-phase but phase-locked to each other with non collinear magnetization vectors [3, 4, 26]. The first mode is the one accessible at relatively low fields in usual FMR experiments, as in our case, while the second one is situated at fields of several tens of Teslas for frequencies in the MW range [27]. Neglecting magnetocrystalline anisotropy, the resonant field for uniform precession in the ferromagnetic mode is given by mT, where is the gyromagnetic ratio, is the demagnetizing factor calculated for our geometry [28], and mT. Figure 4 shows the conventional FMR spectra of Gd:YIG. Owing to the sample finite dimensions, the low power FMR shows a series of magnetostatic modes with the principal one close to . The longer wavelength modes are resolved in the field-modulated spectrum (bottom trace) and appear as shoulders of the main peak in the MW-modulated spectrum (middle trace). For a sample 30 m thick with lateral dimensions of the order of 1 mm their separation corresponds to that expected for magnetostatic forward volume wave modes with the excitation geometry of Fig. 1 [29, 30]. At high MW power (top trace) the FMR shifts to a lower field due to heating of the sample and related decrease of the resultant magnetization . Moreover, the FMR lineshape is significantly distorted due to effects such as foldover and nonlinear spin wave instabilities [31]. In such a regime, nonlinear terms in the Landau-Lifschitz equation of motion transfer energy from the uniform precession mode driven by the external MW field to nonuniform magnon modes, which become unstable above a critical field threshold [32]. These phenomena lead to saturation of the main resonance and precession angle together with excitation of spin waves above thermal values. Of relevance to the present discussion is the fact that nonlinear coupling terms escape conventional treatments of ferrimagnetic resonance, which reduce the dynamics of individual sublattices to that of a single macrospin (e.g., of amplitude for Gd:YIG) [3, 4, 5, 6]. Moreover, the assumed equivalency of the equations of motion for different sublattices might not hold true when nonlinear phenomena are taken into account. For example, substitution of foreign ions in a material where all equivalent lattice sites are occupied by identical ions, as in Gd:YIG, provides a site-dependent additional scattering channel leading to spin wave excitations [33]. Element-resolved FMR spectra can thus put the macrospin concept to test, specifically in the nonlinear regime where relatively large deviations make the XFMR intensity easier to detect.
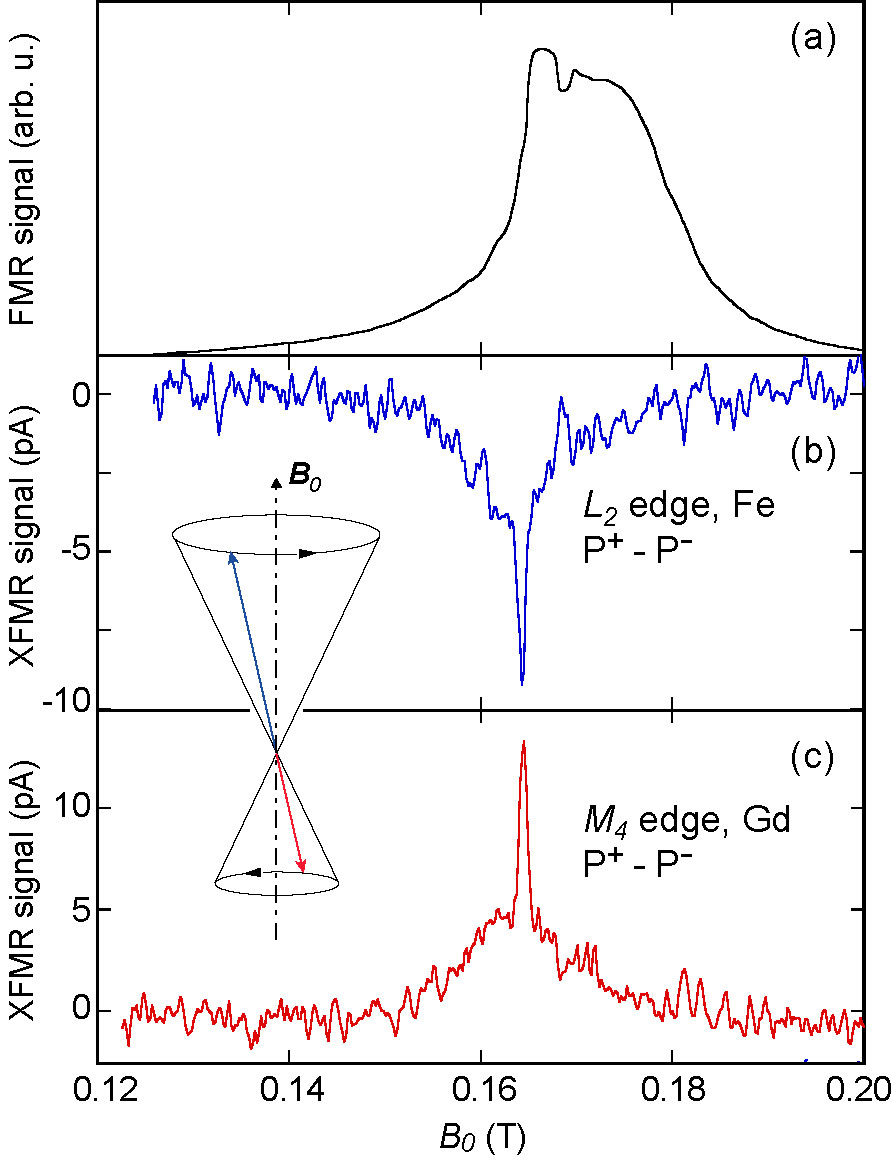
Figure 5 compares the inductive FMR spectrum of Gd:YIG (a) with the XFMR P+-P- intensity recorded at the Fe edge (b) and Gd edge (c) as a function of . Several comments are in order. First, we note that conventional FMR and XFMR spectra differ for obvious reasons, namely: (i) XFMR is a measure of , while FMR is proportional to the transverse dynamic magnetization component. Only if is conserved the two measurements can be considered to be equivalent. (ii) XFMR is surface-sensitive, with the same probing depth as FY XAS ( nm at the Fe edges [34]) and probes a limited portion of the sample, while FMR averages over the whole sample volume. In Fig. 5 (a) the FMR lineshape is asymmetric and heavily saturated due to nonlinear effects that limit the FMR precession cone amplitude. The XFMR signal in (b), on the other hand, is composed of a broad resonant feature and a sharp peak located at about mT with linewidth mT. It may be observed that the intensity of both features is centered around the low-field rising edge of the FMR peak and does not follow the FMR intensity distribution. The origin of such differences lies in (i) and (ii); a detailed understanding of the XFMR vs. FMR lineshape, however, is presently missing. To appreciate this point, we offer a number of consideration based on previous FMR and XFMR studies of YIG. The sharp peak observed by XFMR denotes a sudden increase of , where is proportional to the total number of magnons in the system. De Loubens et al., using magnetic resonance force microscopy on a single crystal YIG film, observed a dramatic increase of at the onset of the second order Suhl’s instability threshold, which was attributed to the parametric excitation of longitudinal spin waves with a low spin-lattice relaxation rate compared to the uniform mode [35, 36]. In this model, the total number of magnons is considered to be constant, while changes of are attributed to a redistribution of their occupation number from modes with relatively high to low relaxation rate, favoring larger precession angles [37]. Goulon et al., using XFMR on a single crystal Y1.3La0.47Lu1.3Fe4.84O12 film, also observed a sharp decrease of measured at the Fe K edge, taking place in correspondence with the foldover critical field of the FMR spectrum [21]. They explained this effect by the degeneracy of the uniform mode with long-wavelength longitudinal magnetostatic waves caused by foldover in perpendicular FMR. In this regime, parametric excitation of coupled magnetostatic-magnetoelastic waves becomes possible [21], which may lead to an effective transfer of angular momentum to the lattice and therefore to a decrease of . This is substantially different from the model proposed by De Loubens et al., as the total number of magnons needs not be conserved. The validity of either of these explanations for the present measurements may be questioned due to the inhomogeneous character of local magnetic fields in polycrystalline samples, e.g., owing to magnetic anisotropy fluctuations or microstructure flaws, which results in broadened FMR lines. Specifically, if individual crystal grains went through resonance individually according to their orientation in the applied field and one would have to worry about strongly inhomogeneous resonance conditions; however, as the magnetocrystalline anisotropy field is more than a factor 10 smaller compared to the saturation magnetization in Gd:YIG, dipolar coupling between different grains predominates and resonance occurs as a collective phenomenon [38, 39]. The observation of different magnetostatic modes in Fig. 4 supports this view, although a much smaller number of modes are resolved compared to single crystal YIG films [21, 35]. The granular structure of the material and related local changes of the anisotropy field have also a well-known effect on the critical field for parametric spin wave excitations, raising it up to 0.1-1 mT in YIG [40], and leading to a smooth onset of this effect rather than an abrupt threshold [41]. The saturation as well as the distorted shape of the FMR spectrum indicate that the conditions for foldover and parametric spin wave amplifications are met at high power in Gd:YIG and likely contribute to the observed XFMR features. In general, however, we cannot identify a unique origin for the XFMR peak nor exclude it to be related to a mode localized at the vacuum-Gd:YIG interface, which would be selectively probed by XFMR and only weakly observed in the bulk FMR signal [see Fig. 6 (a)]. More measurements shall be performed to clarify this point.
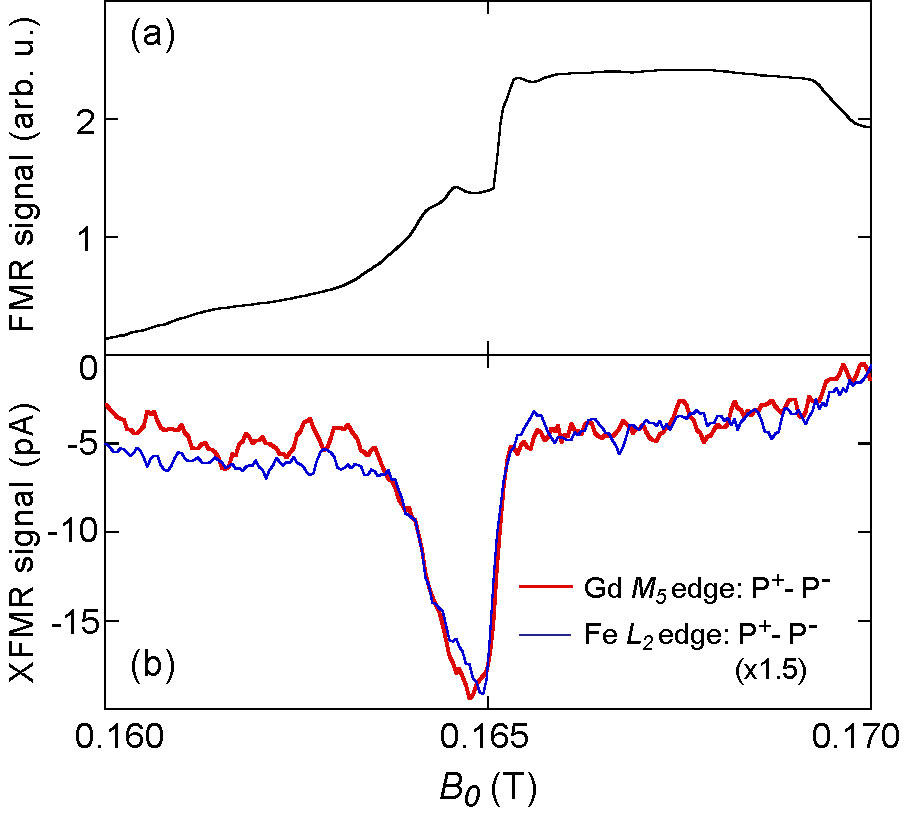
We proceed now to compare the XFMR spectra of Fe and Gd, discussing what type of information may be derived on the relative motion and relaxation of dissimilar magnetic moments in a bulk compound at resonance. Apart from the noise and a scaling factor, the Gd spectrum in Fig. 5 reflects specularly the one measured at the Fe edge. The resonant field and linewidth derived from the Gd -scan XFMR precisely match those of Fe, but the XFMR intensity has opposite sign. This is even more evident in the restricted range -scan in Fig. 6 (b), where the Fe and Gd spectra are reported; note that the relative sign of the Fe and Gd intensity depends on the absorption edge, as for XMCD. Sign inversion of the XFMR at the Fe () and Gd () edges, consistent with that observed in the static XMCD [Figs. 2 (b) and (c)], reveals the coupled AFM dynamics of the Fe and Gd magnetic moments. Their relative deviations can be quantified in terms of the XFMR cross section, defined as the ratio between the dynamic and static dichroism FY photocurrents , which depends on the x-ray photon energy as well as on the spin and orbital magnetic moment precession in a way dictated by the XMCD sum rules [42]. At 31 dBm MW power, we have and . These data, together with the above observations, are consistent with Fe and Gd maintaining rigid AFM alignment in nonlinear excitation modes (diagram in Fig. 6). We note that, in principle, the same result can be obtained for noncollinear and vectors precessing on the cone shown in Fig. 6; however, in the noncollinear case, different flexing angles () would be expected for Fe and Gd, given that the local exchange fields acting on the two ionic species are strongly dissimilar [3, 24, 27]. Full confirmation of the type of AFM coupling would in any case require to measure the phase of the precessing Fe and Gd moments, which may be retrieved only by time-resolved detection of the transverse magnetization components [14, 15, 21]. Within the experimental error, XFMR data thus show that the resonating longitudinal components of and have opposite sign and equal relative deviations from static equilibrium up to the nonlinear regime of high-power MW excitations. This is consistent with collinear dynamic AFM alignment of and predicted by the theory of ferrimagnetic resonance for uniform precession at low fields, but extends into the nonlinear regime beyond the approximations usually made in theoretical models [3, 4, 26] and at temperatures where thermal fluctuations strongly affect magnetic order in the Gd lattice (Fig. 3). Further, the observation of equal Fe and Gd linewidths, within the experimental accuracy of the results reported in Fig. 6 (b), implies that the relaxation mechanisms of the Fe and Gd lattice can be described by a common effective damping parameter, as also predicted by theory [4].
Even though , and therefore , cannot be uniquely related to precessing magnetic moments in the uniform mode due to the presence of nonlinear excitations, it is interesting to define an effective precession angle related to measured by XFMR. In doing so, one must take into account that is a photon energy-dependent parameter. In other words, considering that XAS involves () transitions for the Fe (Gd ) edges, depends on the precession of both spin and orbital magnetic components of the - (-) projected density of states probed by photons of energy . This point has been discussed in detail by Goulon et al. in Ref. [42], who have shown that the precession angles of the spin and orbital magnetic components may be derived by combining and measurements and applying the differential form of the XMCD sum rules. By assuming spin-only magnetic moments, the relationship between and the effective precession angle becomes extremely simple, , yielding and for the measurements reported above. Even if the orbital magnetization of Gd and trivalent Fe ions is usually very small, the extent to which orbital precession contributes to , in particular for Fe, remains to be determined. This matter touches on the interesting question of separately measuring the spin and orbital moment precession angles, which requires either a comparison between edge and edges measurements recorded using identical experimental conditions [42] or full XMFR -scans over the entire region. The latter possibility is further discussed in Sect. 5.
4 Element-resolved XFMR spectra of metallic bilayers
We consider now the extension of XFMR to thin metallic films, and show that layer-specific magnetic resonance spectra of multilayer magnetic structures can be separately resolved. This is of interest, e.g., to investigate interlayer coupling effects, distinguish superposed spectra of layers with similar resonance fields, and investigate current induced precessional dynamics in spin-torque devices. Here we study a Al(10 nm)/Ni80Fe20(5 nm)/Ni(50 nm)/Cr(5 nm) multilayer, where the thickness of the two magnetic films was adjusted so as to reduce of Ni80Fe20 to within range of our electromagnet for perpendicular FMR.
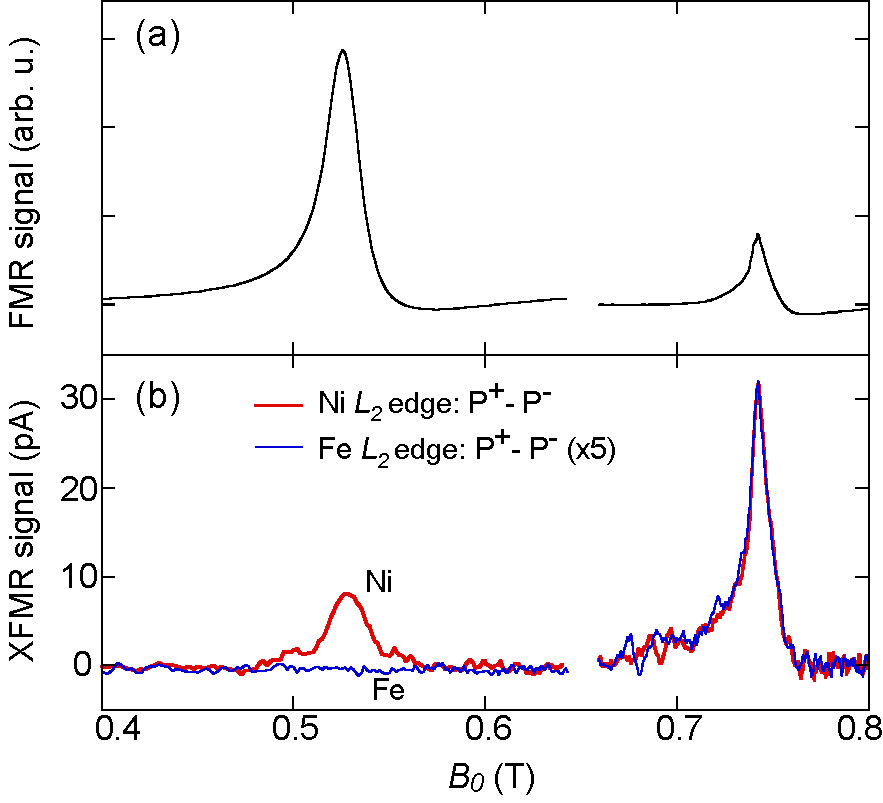
Figure 7 (a) shows the inductive FMR of the magnetic bilayer, where two resonances are observed at 530 and 740 mT. These are close but not equal to the resonances of individual Ni and Ni80Fe20 films, respectively, that were prepared with the same procedure. The high field resonance peak, in particular, appears to be shifted by an amount mT with respect to the resonance of an individual Ni80Fe20 layer, which is indicative of ferromagnetic exchange coupling at the Ni - Ni80Fe20 interface. The elemental components of the two resonance peaks are straightforwardly resolved by XFMR, as shown in Fig. 7 (b). We observe that the low-field resonance originates from the Ni layer alone, while the high-field one comprises both Ni and Fe components. In the high-field resonance, the scaled Ni and Fe XFMR intensities coincide, implying a common g-value and relaxation channel for the two elements, as expected for a ferromagnetic alloy such as Ni80Fe20 [7]. We therefore conclude that, despite the presence of exchange coupling at the interface, mutual resonance-driving effects between perpendicularly-magnetized Ni and Ni80Fe20 layers are not significant. This result can be rationalized within the theoretical model developed by Cochran et al. for a thin overlayer coupled to a thick magnetic substrate [43]. The model assumes that two ferromagnetic layers and deposited on top of each other are exchange coupled at their interface by a surface energy per unit area of the form , where is the interface coupling constant [44, 45]. In the two extreme limits of strong and zero coupling, the magnetizations of the two layers precess locked together or independently of each other, respectively. For small but finite , mutual driving terms in the equations of motion become unimportant, with the overlayer responding to the driving MW radiation as if it were an isolated film subject to an effective anisotropy field of magnitude , where denotes the overlayer thickness and the thick film magnetization [43]. This behavior corresponds to the data reported in Fig. 7. From the shift we estimate Vs/A and J/m2. According to theory [43, 45], also the resonance position of the thicker Ni layer should be down-shifted in the presence of ferromagnetic interface coupling, namely by the amount . Indeed, with respect to a single 50 nm thick Ni layer in a Al(10 nm)/Ni(50 nm)/Cr(5 nm) stack, a shift mT is observed, which yields Vs/A, consistently with the value reported above.
Compared to the exchange energy of ferromagnetic metals, estimated from the resonance shifts turns out to be rather small for metallic films in direct contact with each other. Although this explains the absence of Ni80Fe20 (Ni) response upon excitation of the Ni (Ni80Fe20) resonance, its origin could not be uniquely determined during the present study. The magnitude of is known to be extremely sensitive to the quality of the interface between magnetic materials. Roughness, as well as adsorption of impurities significantly diminish the coupling strength. In high vacuum, the few seconds intervened between evaporation of the Ni and Ni80Fe20 films are sufficient to deposit a monolayer-like quantity of contaminants, which may strongly decrease the magnetization of the interface metal layers. In vacuum conditions similar to ours, Hoffmann et al. found J/m2 for a double Ni/Ni80Fe20/Ni interface [44]. Fully oxidized NiO/Ni80Fe20 interfaces, on the other hand, have interfacial coupling energies as small as J/m2 [46].
Finally, we note that the smallest XFMR cross-section measured for Ni80Fe20(5 nm) corresponds to , representing a very remarkable dichroism sensitivity in the soft x-ray range, still susceptible of further improvements.
5 Dynamic XMCD spectra
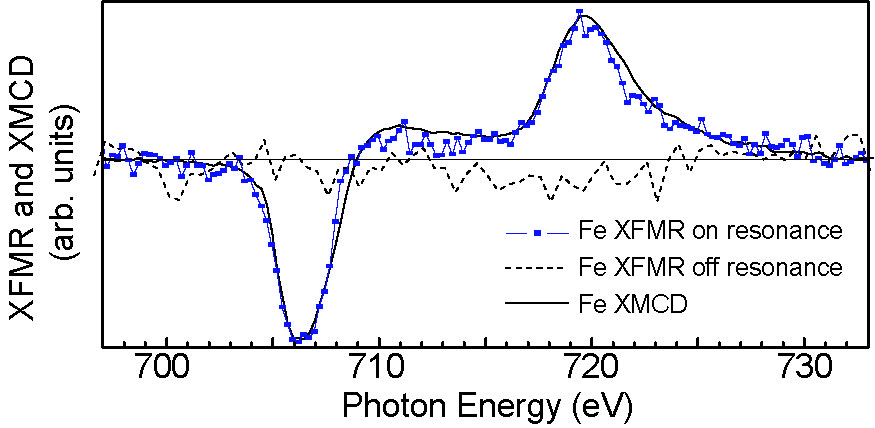
So far we have dealt with the information contained in XFMR -scans. One of the main points of XFMR, however, is that the measured intensity contains all the information derived from the x-ray absorption process, in particular that related to the unoccupied final density of states of a given chemical species together with its spin and orbital magnetization components. In other words, two powerful spectroscopical methods, x-ray absorption and magnetic resonance, are combined together in XFMR. Here we show how the information related to the electronic state of the atoms whose magnetization is precessing can be practically retrieved by XFMR -scans, i.e., by recording the XFMR intensity as a function of photon energy at . Figure 8 shows the XFMR energy-dependent intensity of Fe in the Ni80Fe20 layer measured on- and off-resonance, compared with the static XMCD signal measured at the same field value. One can see that, while the on-resonance XFMR displays a strong energy dependent intensity, the XFMR measured off-resonance is zero within the noise, emphasizing the dynamic origin of the XFMR -scan. Indeed, the latter can be considered as a dynamic XMCD spectrum, where the probed magnetization corresponds to that resonantly excited by the MW field into uniform precession or other resonant modes selected by the choice of . Here, although the signal-to-noise ratio needs to be improved to reach quantitative conclusions, the overall similarity between the static and dynamic XMCD lineshape suggests a similar orbital-to-spin ratio for the static and precessing magnetic moments of Fe.
This method eliminates the need to resort to the differential form of the XMCD sum rules to extract information on the precession dynamics of the spin and orbital magnetization components of the -density of states introduced in Ref. [42]. By integrating XFMR -scans and XMCD spectra simultaneously measured, the standard XMCD sum rules [47, 48] can be applied, deriving information on the dynamic vs. static total orbital and spin magnetic moments. Assumptions made in applying the XMCD sum rules regarding integration cut offs, magnitude of the spin dipole moment, and isotropic absorption intensity [47, 48, 49] shall hold equally well (or badly) for XFMR -scans and XMCD spectra, thus making their relative comparison most relevant. Two caveats should be mentioned concerning this type of measurements. The first is the quantitative accuracy of the XMCD sum rules for soft x-ray absorption spectra measured in the FY mode, as discussed, e.g., in Ref. [50]. The second is the presence of strong self-absorption effects for thick films and bulk samples, which alter the measured intensity of the most prominent XAS and XMCD features. Different methods may be used to retrieve the true XAS absorption coefficients from FY data [51, 52]; a relative, qualitative comparison of static and dynamic XMCD measurements is nonetheless always possible since self-absorption affects them in the same way. Moreover, such effects may be neglected in ultrathin films and dilute samples, and entirely bypassed by measuring XFMR in a transmission geometry, with a significant additional gain of XAS intensity.
Recently, XAS and XMCD spectra have been measured also by time-resolved pump-probe methods, addressing the transfer of angular momentum from the spin and orbital magnetic moments to the lattice in Fe/Gd multilayers [53] and polycrystalline Ni films [54]. Ultrafast heat transients produced by fs-laser pulses are used to pump electronic excitations, inducing strong demagnetization effects and consequent transfer of angular momentum from the magnetic system to the lattice. XMCD spectra recorded at fixed delay times allow to monitor the spin and orbital magnetic moments during this process. Time resolution is achieved either by temporally dispersing the intensity of x-ray photon bunches transmitted by the sample using a streak camera [53] or by employing fs x-ray probe pulses produced by femtoslicing techniques [54], achieving resolutions of the order of 2 ps and 100 fs, respectively. ”Slower” time-resolved schemes based on pulsed magnetic fields [7, 13] or continuous wave excitations [14, 15] as pump and x-ray photon bunches of ps duration as probe may also be employed to measure full XMCD spectra, although this, to our knowledge, has not yet been reported. With respect to time-resolved methods, XFMR -scans appear particularly suited to study stationary precessional dynamics. The averaging time required to measure the Fe spectrum in Fig. 8 amounts to about 1 hour. Improving the detection efficiency using transmission rather than FY is expected to reduce this time further while leading to a better XFMR signal-to-noise.
6 Conclusions
In summary, we have shown that time-invariant x-ray magnetic dichroism and magnetic resonance spectroscopy at GHz frequency can be combined to yield element-resolved magnetic resonance spectra as well as dynamic XMCD spectra, depending on whether the photon energy is kept constant while the applied magnetic field is varied or viceversa. We reported two case studies concerning a Gd1Y2Fe5O12 garnet and an Al(10 nm)/Ni80Fe20(5 nm)/Ni(50 nm)/Cr(5 nm) metallic film. Antiferromagnetic coupling at resonance between Fe and Gd sublattices in Gd:YIG has been resolved and shown to hold also in the nonlinear regime where the FMR response is heavily saturated. The Fe and Gd XFMR linewidths coincide to within the experimental accuracy, supporting the notion of a common effective damping parameter for the two sublattices introduced in early theoretical treatments of ferrimagnetic resonance [4]. The Ni80Fe20(5 nm)/Ni(50 nm) bilayer presents two resonance modes whose elemental components have been separately identified by XFMR. It was shown that while one layer is excited the other is at rest, i.e., that interlayer driving effects are negligible for moderate values of the interface exchange energy, as predicted by theory [43]. Finally, the comparison between static and dynamic Fe XMCD lineshape in Ni80Fe20 suggests a constant orbital-to-spin magnetic moment ratio for the steady and precessing magnetization.
7 Acknowledgments
We acknowledge the European Synchrotron Radiation Facility and Swiss Light Source, Paul Scherrer Institut, for provision of beamtime.
References
References
- [1] Hillebrands B and Ounadjela K 2002 and 2003 Spin Dynamics in Confined Magnetic Structures I and II (Topics Appl. Phys. vol 83 and 87) (Springer)
- [2] Kiselev S I, Sankey J C, Krivotorov I N, Emley N C, Schoelkopf R J, Buhrman R A and Ralph D C 2003 Nature 425 380
- [3] Wangsness R K 1953 Phys. Rev. 91 1085
- [4] Wangsness R K 1958 Phys. Rev. 111 813
- [5] Kittel C 1959 Phys. Rev. 115 1587
- [6] de Gennes P G, Kittel C and Portis A M 1959 Phys. Rev. 116 323
- [7] Bailey W E, Cheng L, Keavney D J, Kao C C, Vescovo E and Arena D A 2004 Phys. Rev. B 70 172403
- [8] Vogel J, Kuch W, Camarero J, Fukumoto K, Pennec Y, Pizzini S, Bonfim M, Petroff F, Fontaine A and Kirschner J 2005 Phys. Rev. B 71 060404(R)
- [9] Acremann Y, Strachan J P, Chembrolu V, Andrews S D, Tyliszczak T, Katine J A, Carey M J, Clemens B M, Siegmann H C and Stöhr J C 2006 Phys. Rev. Lett. 97 107204
- [10] Seiden P 1964 Phys. Rev. 133 A728
- [11] Reidy S G, Cheng L and Bailey W E 2003 Appl. Phys. Lett. 82 1254
- [12] Scheck C, Cheng L, Barsukov I, Frait Z and Bailey W E 2007 Phys. Rev. Lett. 98 117601
- [13] Bonfim M, Ghiringhelli G, Montaigne F, Pizzini S, Brookes N, Petroff F, Vogel J, Camarero J and Fontaine A 2001 Phys. Rev. Lett. 86 3646
- [14] Arena D A, Vescovo E, Kao C C, Guan Y and Bailey W E 2006 Phys. Rev. B 74 064409
- [15] Arena D A, Vescovo E, Kao C C, Guan Y and Bailey W E 2007 J. Appl. Phys. 101 09C109
- [16] Puzic A, von Waeyenberge B, Chou K W, Fischer P, Stoll H, Schütz G, Tyliszczak T, Rott K, HBrück, Reiss G, Neudecker I, Haug T, Buess M and Back C H 2005 J. Appl. Phys. 97 10E704
- [17] Chou K W, Puzic A, Stoll H, Schütz G, von Waeyenberge B, Tyliszczak T, Rott K, Reiss G, Neudecker I, Weiss D and Back C H 2006 J. Appl. Phys. 99 08F305
- [18] Boero G, Rusponi S, Bencok P, Popovic R S, Brune H and Gambardella P 2005 Appl. Phys. Lett. 87 152503
- [19] Goulon J, Rogalev A, Wilhelm F, Jaouen N, Goulon-Ginet C, Goujon G, Youssef J B and Indenbom M V 2005 JETP Lett. 82 791
- [20] Goulon J, Rogalev A, Wilhelm F, Jaouen N, Goulon-Ginet C, Goujon G, Youssef J B and Indenbom M V 2007 J. El. Spectr. Rel. Phen. 156-158 38
- [21] Goulon J, Rogalev A, Wilhelm F, Goulon-Ginet C and Goujon G 2007 J. Synchrotron Rad. 14 257
- [22] Goulon J, Rogalev A, Goujon G, Gauthier C, Moguiline E, Sol A, Feite S, Wilhelm F, Jaouen N, Goulon-Ginet C, Dressler P, Rohr P, Lampert M O and Henck R 2005 J. Synchrotron Rad. 12 57
- [23] Gilleo M A 1980 Ferromagnetic insulators: garnets Ferromagnetic Materials Vol. 2, E.P. Wohlfart (Ed.) (North-Holland)
- [24] Myers S M, Gonano R and Meyer H 1968 Phys. Rev. 170 513
- [25] Brandle C D and Blank S L 1976 IEEE Trans. Mag. 12 14
- [26] Keffer F and Kittel C 1952 Phys. Rev. 85 329
- [27] Geschwind S and Walker L R 1959 J. Appl. Phys. 30 163S
- [28] Chen D X, Pardo E and Sanchez A 2002 IEEE Trans. Mag. 38 1742
- [29] Barak J and Lachish U 1989 J. Appl. Phys. 65 1652
- [30] Fetisov Y K, Patton C E and Synogach V T 1999 IEEE Trans. Mag. 35 4511
- [31] Zhang Y T, Patton C E and Srinivasan G 1988 J. Appl. Phys. 63 5433
- [32] Suhl H 1957 J. Phys. Chem. Solids 1 209
- [33] Schlömann E, Green J J and Milano U 1960 J. Appl. Phys. 31 386S
- [34] Gota S, Gautier-Soyer M and Sacchi M 2000 Phys. Rev. B 62 4187
- [35] de Loubens G, Naletov V V and Klein O 2005 Phys. Rev. B 71 180411
- [36] Naletov V V, de Loubens G, Charbois V, Klein O, Tiberkevich V S and Slavin A N 2007 Phys. Rev. B 75 140405
- [37] Bloembergen N and Wang S 1954 Phys. Rev. 93 72
- [38] Geschwind S and Clogston A M 1957 Phys. Rev. 108 49
- [39] Schlömann E 1958 J. Phys. Chem. Solids 6 242
- [40] Silber L M and Patton C E 1982 IEEE Trans. Mag. 18 1630
- [41] Schlömann E, Saunders J H and Sirvetz M H 1960 IRE Trans. Microwave Theory Technol. 8 96
- [42] Goulon J, Rogalev A, Wilhelm F, Jaouen N, Goulon-Ginet C and Brouder C 2006 Eur. Phys. J. B 53 169
- [43] Cochran J F, Heinrich B, and Arrott A S 1986 Phys. Rev. B 34 7788
- [44] Hoffmann F, Stankoff A and Pascard H 1970 J. Appl. Phys. 41 1022
- [45] Heinrich B and Cochran J F 1993 Adv. in Phys. 42 523
- [46] Kuanr B K, Camley R E and Celinsky Z 2003 J. Appl. Phys. 93 7723
- [47] Thole B, Carra P, Sette F and van der Laan G 1992 Phys. Rev. Lett. 68 1943
- [48] Carra P, Thole B, Altarelli M and Wang X 1993 Phys. Rev. Lett. 70 694
- [49] Chen C T, Idzerda Y U, Lin H J, Smith N V, Meigs G, Chaban E, Ho G H, Pellegrin E and Sette F 1995 Phys. Rev. Lett. 75 152
- [50] van Veenendaal M, Goedkoop J B and Thole B T 1996 Phys. Rev. Lett. 77 1508
- [51] Eisebitt S, Böske T, Rubensson J E and Eberhardt W 1993 Phys. Rev. B 47 14103
- [52] Carboni R, Giovannini S, Antonioli G and Boscherini F 2005 Physica Scripta T115 986
- [53] Bartelt A F, Comin A, Feng J, Nasiatka J R, Einmüller T, Ludescher B, Schütz G, Padmore H A, Young A T and Scholl A 2007 Appl. Phys. Lett. 90 162503
- [54] Stamm C, Kachel T, Pontius N, Mitzner R, Quast T, Holldack K, Khan S, Lupulescu C, Aziz E F, Wietstruk M, Dürr H A and Eberhardt W 2007 Nat. Mater. 6 740