Measurement on the thermal neutron capture cross section of
Abstract
We have measured the thermal neutron capture cross section for nucleus. There is only one previous data on this cross section with a value of 30 barn. To consider as a low energy neutrino source, the thermal neutron capture cross section should be measured more precisely to estimate the production rate of inside a nuclear reactor. We measured the cross section of with a natural tungsten foil and obtained a new value of 21.9 2.5 barn.
pacs:
25.40.Lw,14.60.StI Motivation
Neutrino oscillation experiments such as Super-Kamiokande (SK) Ashie et al. (2004), K2K Ahn et al. (2003), SNO Ahmed et al. (2004), and the KAMLAND Eguchi et al. (2004), have achieved great progresses in understanding the masses and mixing angles of the neutrinos. The non-zero masses and the large mixing angles of the neutrinos are confirmed and stimulate further theoretical models on the neutrino masses. The above neutrino oscillation experiments detected the neutrinos from the sun (SK, SNO), from accelerator (K2K), and from nuclear reactors (KAMLAND, CHOOZ). Therefore the neutrino sources are fixed in their locations, which limits the flexibility of the experiments to some extent. In addition to these neutrino sources, artificial neutrino source (ANS) has been studied for the calibration of neutrino detectors such as GALLEX Anselmann et al. (1995) and SAGE Abdurashitov et al. (1996). The ANS refers the neutrinos from a beta decaying nuclei. For example, the neutrinos from electron capture of nuclei are mostly mono-energetic at the energy of about 750 keV. About 1 MCi(million Curie) of was produced by capture reaction inside a nuclear reactor with enriched to calibrate the solar neutrino detector Abdurashitov et al. (1996); Anselmann et al. (1995).
Besides the calibration of a neutrino detector, the radioisotope neutrino source can be used to study non-standard neutrino properties and possibly for neutrino oscillation experiment. For example, about 1 MCi neutrino source can be used to measure the magnetic moment of the neutrinos with a neutrino detector closely located to the source. Recently two groups, TEXONO Wong et al. (2007) and MUNU Daraktchieva et al. (2005), reported most stringent upper limits on the neutrino magnetic moment as and respectively from the measurements of elastic scattering energy spectra with the reactor neutrinos. The neutrino magnetic moment is one of the most fundamental properties of neutrinos and it is anticipated that one can improve the sensitivity if a strong neutrino source with a proper radioisotope is available.
There are other candidates for a neutrino source besides , such as , 170Tm, and 147Pm, etc Barabanov et al. (1997). An appropriate radioisotope for ANS should have characteristics such as; (1) relatively long decay time between 10 days and 10 year to perform an experiment, (2) low gamma intensities for safety issue, (3) abundances of mother nuclei should be relatively large for low cost, (4) thermal neutron capture cross section should be large. Among the nuclei, 147Pm is produced from nuclear spent fuel, and the others are produced by reaction in nuclear reactors. has good properties except the low abundance of at the level of 0.12%. Therefore an enrichment is necessary for tungsten, and the production cost depends on the amount of material needed to produce the desirable activity, which is usually more than 1MCi. In this respect, the thermal neutron capture cross section of is an important parameter to know. Until now, however, there is only one data on the thermal neutron capture cross section on this nucleus, 30 barn, measured by Pomerance more than 50 years ago Pomerance (1952). Since the uncertainty of this data is very large, it is necessary to measure the cross section more precisely to determine if is a good candidate for ANS.
To measure the capture cross section, we irradiated natural tungsten foils in a thermal neutron irradiation facility and measured the from decay. In the natural tungsten foil, and are more abundant, and the capture cross sections were measured with sufficiently small uncertainties. Therefore, we can obtain the capture cross section by a comparison with the activity measurements of and . In this report we describe the measurement of a capture cross section of reaction with a much smaller error than the previous measurement.
II Experimental Setup
An irradiation area at HANARO research reactor facility in Korea was used for the measurement. At HANARO, a neutron irradiation facility for BNCT (Boron Neutron Capture Therapy) consists of a water shutter, a fast neutron and gamma ray filter, a liquid nitrogen cooling system, a beam collimator, and shieldings Kim et al. (2004). The cadminium ratio (Cd ratio) at this facility is known to be larger than 100 at the position of irradiation. We prepared two identical tungsten foils (99.9% pure) with a size of 50.1mm X 50.1mm X 0.138mm (6.644g) to measure the Cd ratio at the same time of the irradiation. The thickness of the foil was calculated by dividing the mass of the foil by the area with a density of 19.25. One foil was sandwiched by two Cadminium foils of about 1mm thickness. The thermal neutron flux was previously measured at this beam line as about 7-8 neutrons/sec/cm2.
Table 1 shows the informations of stable isotopes in natural tungsten foil Firestone et al. (1995). The idea is that we can obtain the capture cross section of with respect to the capture cross sections of and which were measured with much smaller errors. This method has the advantage of cancellation of potential systematic errors from thermal neutron flux, flux profile, foil thickness, foil size, and irradiation time etc. Neither the absorption effect inside the tungsten foil contributes to the errors in the final cross section since all the stable tungsten isotopes will see the same amount of the neutron flux regardless of the absorption. As shown in the table 1, there are with sufficiently long half-lives for , , and , from which we can obtain the production rates of the three radioisotopes. There are two more from decay with significant gamma intensities, 134.2 keV and 479.5 keV, but these gammas was not used in current analysis. 134.2 keV gamma is not separable from 136.3 keV gamma from and 479.5 keV gamma was overlapped with other unidentified gammas.
| Isotope | Abun. | Eγ | Iγ | ||
|---|---|---|---|---|---|
| (%) | (barn) | (day) | (keV) | (%) | |
| 0.12 | 30 111Reference Pomerance (1952). | 121.2 | 136.3 | 0.0311(10) | |
| 21.9 2.5222This work. | 152.3 | 0.083(3) 555The gamma intensity of this level is written as 0.0083 by mistake in all the existing database including NNDC database, Table of Isotopes (8th Ed.), Nuclear Data Sheets Wu (2005a), and NUDAT. The correct value, 0.083, was reported in the paper of Indira et al. (1979). We reported this mistake to NNDC database group, and it is corrected in NNDC database at the moment of this writing. | |||
| 30.6 | 1.76 0.09 333Reference Bondarenko et al. (2005). | 75.1 | 125.4 | 0.0192(3) | |
| 28.4 | 39.5 2.3 444Reference Karadag et al. (2004). | 0.988 | 551.5 | 5.08(17) | |
| 618.4 | 6.28(21) | ||||
| 685.8 | 27.3(9) | ||||
| 772.9 | 4.12(13) |
We irradiated both the enclosed and open foils for 5 hours at the BNCT facility, and the irradiated foils are left for 12 days or more to reduce the activity of the foils. Even though the half-life of is only 1 day, we still have enough counts from the decay of . The irradiated tungsten foils were measured with a low background HPGe detector located at 700 meter deep underground at Yangyang laboratory of Dark Matter Research Center (DMRC) in Korea. The relative efficiency of the HPGe detector is 100%, and the detection efficiencies are measured with absolute intensity sources before, and compared with GEANT4 simulations Lee et al. (2007).
III Results
Figure 1 shows the HPGe spectra of two tungsten foils with and without cadminium enclosure. The Cd ratio has been estimated by the ratio of the from peaks, which are dominant in these spectra. The Cd ratio was obtained to be 24510, which guarantees the activities we obtain from the open foil has little contribution from non-thermal neutrons.
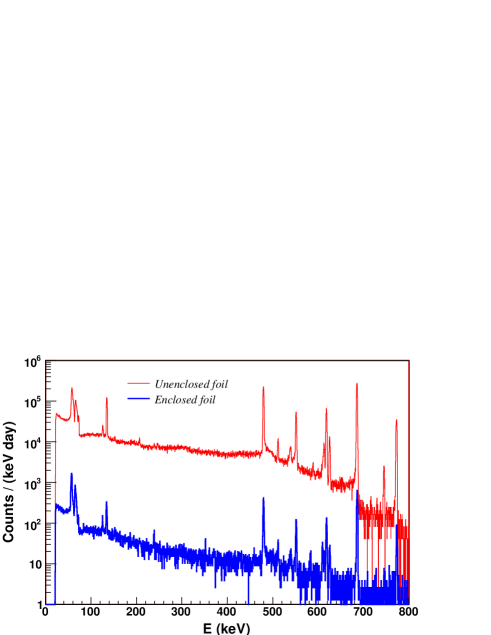
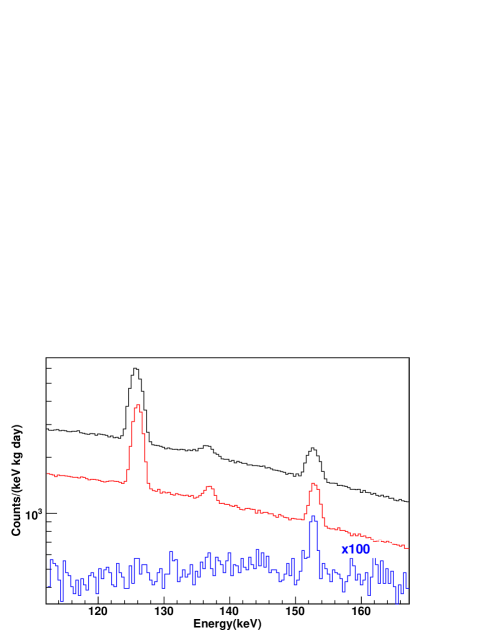
Figure 2:TOP shows the measured HPGe spectra of gamma peaks at the energies of 136.3, 152.3 keV (), and 125.4 keV (). The upper spectrum was obtained with a measurement of 5.4 days starting 25.0 days after the irradiation. Even after 25 days, there are continuous high background events below 400 keV. This was due to the bremsstrahlung photons from the beta decay of to the ground state of (branching ratio 99.93%), which has a Q value of 433 keV. Even with the bremsstrahlung background, we can still observe 125.4, 136.3, and 152.3 keV gamma peaks clearly. We also show the spectra obtained at 81 days (middle spectrum) and 993 days (lower spectrum) since the end of the irradiation period. The data obtained at 81 days after the irradiation was used to get the counts of the 136.3 keV peak of since the 25 days data still has about 10 % counts from 134.2 keV peak of . We also confirmed that the half-lives of these peaks are consistent with the expectation of and . The bremsstrahlung background was reduced significantly in the spectrum of last data.
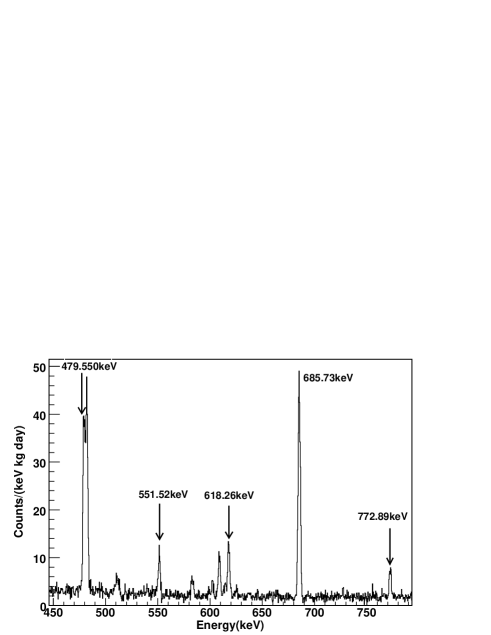
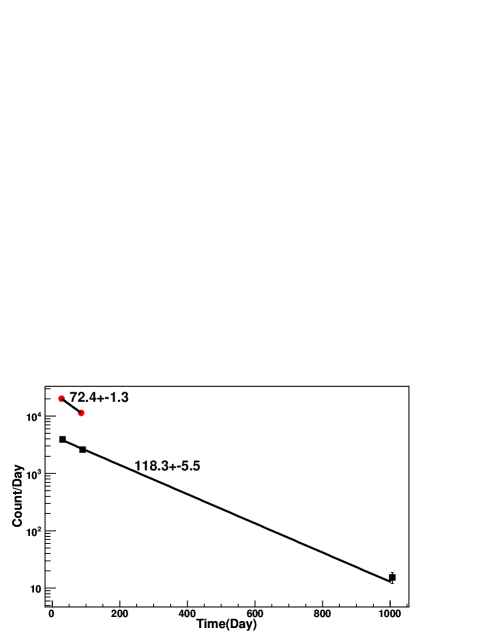
Figure 2:BOTTOM shows the peaks of 551.5, 618.4, 685.8, and 772.9 keV () in the higher energy region of the upper spectrum of Figure 2:TOP. The 479.5 keV peak is overlapped with another peak and is not used in the analysis. Figure 3 shows the count rates of 152.3 keV and 125.4 keV obtained at various measurement times after the irradiation. We obtained the half-lives of and as 72.4 1.3 day and 118.3 5.5 days respectively. The half-life of is slightly off from the value in the database.
| Counts | R | Rav | |||
| (keV) | (%) | ||||
| 136.3 | 7644 614 | 12.2 | 4.27 0.92 | 4.14 0.62 | |
| 152.3 | 21208 650 | 13.4 | 4.04 0.83 | ||
| 125.4 | 111357 984 | 10.9 | 77.0 15.5 | 77.0 15.5 | |
| 551.5 | 330 33 | 8.5 | 1942 439 | 1993 221 | |
| 618.4 | 388 36 | 8.0 | 1967 439 | ||
| 685.8 | 1615 60 | 7.5 | 2002 413 | ||
| 772.9 | 235 28 | 7.0 | 2077 488 | ||
Table 2 shows the measured count rates and errors. The production rate of radioisotopes from reaction during the irradiation can be written as
| (1) |
Here is the neutron flux, m is the total mass of the foil, , , and are the capture cross section, mass number, and the relative abundance of target isotope, respectively. is the Avogadro’s number. The thermal neutron capture cross section of can be obtained with the existing capture cross section data of Bondarenko et al. (2005) and Karadag et al. (2004) as
| (2) |
Here the index refers to or . The production rate R is calculated from the data as,
| (3) |
Here are the net count, the gamma intensity, and the detection efficiency of j th gamma from i th isotope respectively, and is the production rate calculated with the net gamma count. is the mean decay time of the produced radioisotope, T is the irradiation time, and are the starting and stop time of the HPGe measurement since the end of the irradiation period.
The production rates of each radioisotope are in the last two columns of Table 2. The errors in the production rates are due to the errors in count statistics, gamma intensity Wu (2005b, a), and detection efficiency. Unfortunately, the efficiencies of the HPGe detector at underground is not accurately measured since we observed discrepancies between calibrated source measurements and the GEANT4 simulations. The conservative estimation of the discrepancies are in the order of 20% for the energy region over 100 keV, and it contributes most for the uncertainties in the production rates. The errors of the abundances of each isotopes are negligible compared with the other errors, so neglected in the analysis. In the case of and , the production rates obtained with multiple are consistent with each other as expected. The weighted mean of the production rates are in the last column of Table 2. Though, the thermal neutron flux cancels out in the cross section calculation, we can calculate the thermal neutron flux with the known cross section of and . The obtained flux results in 7.6 0.7 , which is consistent with the value reported for the BNCT facility previously.
The capture cross section of is calculated using equation 2 with the known cross section of 1.76 0.09 barn for and 39.5 2.3 barn for , and we obtained 24.7 3.9 barn and 20.1 3.2 barn respectively. The two cross sections are consistent within the uncertainties. The final capture cross section is obtained with the weighted mean of the two values, and it is 21.9 2.5 barn. While our new cross section is consistent with the data by Pomerance Pomerance (1952), the small uncertainty makes it possible to evaluate the feasibility of as a neutrino source, which was too ambiguous due to the large error in the Pomerance data.
IV Discussion
Though the present result can be improved with a better understanding of the HPGe detector efficiency in the future, it is accurate enough to evaluate the feasibility of as a neutrino source more realistically. Considering that enrichment is technically difficult, seem to be not very attractive. Instead, 170Tm would be a better candidate in the respect of the cost, but one has to figure out the safety issue related the high gamma-ray flux, and bremsstrahlung photons. The measurement method we used in this report can be utilized for other low abundance isotopes. In summary, we measured the thermal neutron capture cross section of as 21.9 2.5 barn. Though is a good candidate for artificial neutrino source, the production of would be too expensive considering the thermal neutron capture cross section measured in this work.
Acknowledgements.
This work was supported by the Korea Research Foundation (Grant KRF-2002-070-C00027). The authors thank Dr. M.S. Kim and the staffs of the BNCT facility of HANARO research reactor for the neutron irradiation and the DMRC group for using the HPGe detector at underground.References
- Ashie et al. (2004) Y. Ashie et al. (Super-Kamiokande), Phys. Rev. Lett. 93, 101801 (2004), eprint hep-ex/0404034.
- Ahn et al. (2003) M. H. Ahn et al. (K2K), Phys. Rev. Lett. 90, 041801 (2003), eprint hep-ex/0212007.
- Ahmed et al. (2004) S. N. Ahmed et al. (SNO), Phys. Rev. Lett. 92, 181301 (2004), eprint nucl-ex/0309004.
- Eguchi et al. (2004) K. Eguchi et al. (KamLAND), Phys. Rev. Lett. 92, 071301 (2004), eprint hep-ex/0310047.
- Anselmann et al. (1995) P. Anselmann et al. (GALLEX.), Phys. Lett. B342, 440 (1995).
- Abdurashitov et al. (1996) J. N. Abdurashitov et al., Phys. Rev. Lett. 77, 4708 (1996).
- Wong et al. (2007) H. T. Wong et al. (TEXONO), Phys. Rev. D75, 012001 (2007), eprint hep-ex/0605006.
- Daraktchieva et al. (2005) Z. Daraktchieva et al. (MUNU), Phys. Lett. B615, 153 (2005).
- Barabanov et al. (1997) I. R. Barabanov et al., Astropart. Phys. 8, 67 (1997).
- Pomerance (1952) H. Pomerance, Phys. Rev. 88, 412 (1952).
- Kim et al. (2004) M. S. Kim et al., Journal of Korean Nuclear Society 36, 203 (2004).
- Firestone et al. (1995) R. Firestone et al., Table of Isotopes (Wiley-interscience, 1995), 8th ed.
- Bondarenko et al. (2005) V. Bondarenko et al., Nuclear Physics A762, 167 (2005).
- Karadag et al. (2004) M. Karadag et al., Annals of Nuclear Energy 31, 1285 (2004).
- Wu (2005a) S.-C. Wu, Nuclear Data Sheets 106, 367 (2005a).
- Indira et al. (1979) P. Indira et al., Z. Physik A290, 245 (1979).
- Lee et al. (2007) H. S. Lee et al., Nucl. Instrum. Meth. A571, 644 (2007).
- Wu (2005b) S.-C. Wu, Nuclear Data Sheets 106, 619 (2005b).