An absorption origin for the soft excess in Seyfert 1 AGN
Abstract
The soft excess seen in the X-ray spectra of many AGN can be well modelled by reflection from a partially ionised accretion disc. However, this often requires extreme parameters, both in terms of the underlying spacetime and the reflection geometry, and requires that the disc is far from hydrostatic equilibrium. An alternative model uses similarly partially ionised, velocity smeared material but from an accretion disc wind seen in absorption. We explicitly compare these two models for the origin of the soft excess using XMM-Newton data for PG QSOs and Narrow Line Seyfert 1’s. We find that while reflection and absorption give comparably good fits to the data, the absorption model allows a much clearer correspondence with the stellar mass black holes. All the objects are high mass accretion rate AGN, so should be analogous to the high/soft and very high states in black hole binaries. The intrinsic spectral indices derived from the absorption model are all consistent with a one-to-one mapping between spectral state and AGN type, with the NLS1’s having softer spectra corresponding to the very high state, while the broad line AGN have Gamma 2 as expected for the high/soft state. By contrast, a few AGN have intrinsically hard spectra with the reflection model. While this supports an absorption interpretation of the soft excess, we note that the required Gaussian velocity dispersion of (corresponding to an outflow velocity ) is too fast for a radiatively driven accretion disc wind and instead requires that the material is entrained in a magnetic outflow (jet). We also use the simultaneous OM data to derive the ratio of disc to total accretion power which is another tracer of spectral state in X-ray binaries. This does not always show that the disc in NLS1’s contributes less than 80 per cent of the total power, as expected for a very high state. We suggest that this is an artifact of the standard disc models used to determine the disc luminosity in our fits. The disc seen in the very high state of black hole binaries is often observed to be distorted from the standard shape, and a similar effect in NLS1’s could recover the one-to-one mapping between black hole binary spectral state and AGN type.
keywords:
accretion, accretion discs – X-rays: binaries, spin, black hole1 Introduction
X-ray spectra and variability provide important evidence to suggest that accretion systems of AGN are analogous to those of their smaller counterparts, the black hole binary (BHB) systems. Both show two major components in their high energy spectra, the accretion disc, together with a tail of emission extending to higher energies. The accretion disc temperature should scale with both mass () and mass accretion rate (hereafter parameterised as ) as K (Shakura & Sunyaev 1973). This component peaks in the soft X–ray range for bright BHB, but correspondingly large AGN have discs which peak in the UV–optical region of the spectrum. This complicates a detailed comparison of the two systems. In BHB the X–ray spectra contain contributions from both the disc and tail, whereas in AGN only the tail should contribute. This is particularly important as BHB show a complex range of spectral states, which can be roughly determined by the luminosity ratio between the disc and tail, together with the shape of the tail (see e.g. Remillard & McClintock 2006). In BHB these can all be (more or less) determined simply from a single X–ray spectrum, whereas to constrain the disc emission in AGN requires simultaneous UV–optical as well as X–ray data. This is now easily obtainable with the launch of the XMM-Newton satellite, which carries the Optical Monitor telescope with optical/UV filters, as well as the sensitive EPIC X–ray CCD’s.
In BHB the disc and high energy tail are well known to have different variability properties on short timescales, where the disc is rather constant while the high energy tail is not (e.g Churazov Gilfanov & Revnivtsev 2001). The effects of the stable accretion disc diluting the observed X–ray variability is important in BHB, but when this effect is corrected for then the AGN and BHB show very similar variability power spectra (Done & Gierliński 2005), with characteristic frequencies simply scaling with mass for a given (McHardy et al 2006). This points to the same underlying physical mechanisms for forming the tail in both systems, strongly supporting models in which the accretion processes are the same.
However, despite this overall correspondence between the two systems, there are clear discrepancies which remain unexplained. Firstly there is the ‘soft excess’ seen ubiquitously in high AGN. This is a smooth rise above the extrapolation of the higher energy continuum below 1 keV. This energy is too high to be explained by the standard accretion disk model above, and alternative continuum models such as Comptonization of the disc (e.g. Czerny & Elvis 1987; Page et al 2004) or a super-Eddington slim disk (e.g. Abramowicz et al. 1988; Tanaka, Boller & Gallo 2005) have problems in explaining why this component is always seen at the same energy in AGN spanning a large range in mass (Gierliński & Done 2004: hereafter GD04), and why this has no obvious counterpart in the BHB (GD04; Sobolewska & Done 2007). Secondly, some of these high have apparently flat 2–10 keV spectra. BHB at correspondingly high normally have rather steep tails to high energies, with photon index when characterised by a power law (e.g. the review by Remillard & McClintock 2006).
Both these problems can be addressed if there is substantial distortion of the AGN spectra by atomic processes. This rather naturally gives rise to a fixed energy for the soft excess from the dramatic increase in opacity in partially ionised material at 0.7 keV provided by O VII/O VIII and the Fe M shell unresolved transition array (UTA). The observed smoothness of the soft excess then requires that this partially ionised material has strong velocity gradients to remove any lines or edges by Doppler smearing. This material can affect the spectrum in two rather different geometrical configurations, either in optically thick material seen in reflection (e.g. Crummy et al. 2006) or optically thin material seen in absorption (e.g. Gierliński & Done 2004; Chevallier et al. 2006), but in both models the enhanced opacity above 0.7 keV can lead to an apparently flat 2–10 keV spectrum even when the intrinsic emission is steep.
This all makes a compelling case for there to be substantial amounts of partially ionised, Doppler smeared material in AGN. Even if the same material is present in BHB it would not be easily seen as the higher temperature accretion disc will result in complete photoionization of Oxygen, so will not produce the strong opacity jump at 0.7 keV. In which case the question becomes whether this material is seen in reflection or absorption. This has additional importance as the difference between absorption and reflection mechanisms implies not only differing physical geometries but also a difference in the inferred properties of the spacetime (Gierliński & Done 2006).
In the reflection models, the strength of the soft excess is limited if the source is isotropic. The maximum reflected continuum below 0.7 keV equals the incident continuum, and even including line emission results in a soft excess of no more than a factor of 2-3 above the extrapolated 2–10 keV continuum (Sobolewska & Done 2007). This is exceeded by many high AGN, dramatically so by a few objects. Thus the reflection geometry also requires anisotropic illumination from either gravitational light bending or a corrugated disc surface which acts to hide a large proportion of the incident flux from the line of sight (Fabian et al. 2002a; Miniutti et al 2003; Miniutti & Fabian 2004). The problem becomes even more marked if the reflecting disc material is in hydrostatic equilibrium, as the details of the pressure balance means that there is only a small optical depth in the disc photosphere where Oxygen can be partially ionised. Thus these models give much smaller soft excess than a constant density reflecting slab (Done & Nayakshin 2007).
Instead, the absorption model sets no such restrictive limits on the size of the soft excess, so does not require any geometry change to produce the strongest observed soft excesses (Sobolewska & Done 2007). Additionally, and in stark contrast to the reflection models, any pressure balance condition rather naturally produces the required (now much smaller) optical depth of partially ionised Oxygen (Chevallier et al 2006).
While this all supports the absorption model, these arguments are indirect, relying on physical plausibility. A clear observational test between the two models would be more convincing. However, detailed studies of individual objects have shown that even good quality XMM-Newton data in the 0.3–10 keV bandpass cannot distinguish between reflection and absorption model for the origin of the spectral features (Chevallier et al. 2006; Sobolewska & Done 2007). Similarly, the 0.3–10 keV variability rms spectra of individual objects can also be equally well matched by both models (Ponti et al. 2006; Gierliński & Done 2006). This is the case even for the canonical reflection dominated, broad line source, MCG-6-30-15, for which the 0.3-10 keV spectrum and r.m.s. variability can be well fit by both reflection and absorption models (Done 2007; Gierliński & Done 2006). Even extending the bandpass to 40 keV (such as with the Suzaku HXD: Miniutti et al 2007) does not break the model degeneracy of the spectra for this object (Done 2007), though the fact that the variable component can be well fit by a simple absorbed power law is plainly consistent with the reflection modelling (Miniutti et al 2007).
Here instead we analyse the spectra of a large sample of PG quasars and Narrow Line Seyfert 1 galaxies observed with the absorption models. This sample has previously been studied by Crummy et al (2006), who fit the smeared reflection model so allowing a direct comparison of fit quality over a larger number of objects, with a large spread in spectral shape. We use XMM-Newton data so we can directly constrain the disc simultaneously with the high energy tail, and so directly test whether these do indeed correspond to the BHB high spectra states, and identify where the anomalous soft excess and hard 2–10 keV spectra arise.
| Source | z | logM/M⊙ | L/LEdd | Galactic column | Soft Excess | Obs. Date | |
|---|---|---|---|---|---|---|---|
| (x1020cm) | at 0.5keV | ||||||
| PG 0003+199 | 0.025 | 7.07 | 0.62 | 3.99 | 2.216 | 2.680 | 2000-12-25 |
| PG 0050+124 | 0.061 | 7.13 | 1.81 | 4.99 | 2.284 | 1.008 | 2002-06-22 |
| PG 0157+001 | 0.163 | 8.00 | 0.54 | 2.59 | 2.117 | 1.712 | 2000-07-29 |
| PG 0844+349 | 0.064 | 7.66 | 0.41 | 2.98 | 2.126 | 2.621 | 2000-11-04 |
| PG 0947+396 | 0.206 | 8.46 | 0.14 | 1.57 | 1.843 | 2.682 | 2001-11-03 |
| PG 0953+414 | 0.239 | 8.52 | 0.58 | 1.14 | 1.974 | 2.512 | 2001-11-22 |
| PG 1048+342 | 0.167 | 8.14 | 0.25 | 1.83 | 1.804 | 2.367 | 2002-05-13 |
| PG 1115+407 | 0.154 | 7.44 | 0.82 | 1.91 | 2.133 | 2.800 | 2002-05-17 |
| PG 1116+215 | 0.177 | 8.41 | 0.74 | 1.28 | 2.076 | 2.356 | 2001-12-02 |
| PG 1202+281 | 0.165 | 8.37 | 0.11 | 1.67 | 1.657 | 2.543 | 2002-05-30 |
| PG 1211+143 | 0.080 | 7.81 | 1.14 | 2.75 | 1.765 | 2.961 | 2001-06-15 |
| PG 1244+026 | 0.048 | 6.24 | 3.97 | 1.75 | 2.486 | 3.609 | 2001-06-17 |
| PG 1307+085 | 0.155 | 8.50 | 0.24 | 2.11 | 1.494 | 2.454 | 2002-06-13 |
| PG 1309+355 | 0.184 | 8.20 | 0.33 | 1.03 | 1.755 | 1.614 | 2002-06-10 |
| PG 1322+659 | 0.168 | 7.74 | 0.81 | 2.01 | 2.156 | 2.925 | 2002-05-11 |
| PG 1352+183 | 0.158 | 8.20 | 0.29 | 2.05 | 1.926 | 4.075 | 2002-07-20 |
| PG 1402+261 | 0.164 | 7.76 | 1.24 | 1.47 | 2.069 | 4.227 | 2002-01-27 |
| PG 1404+226 | 0.098 | 6.65 | 1.90 | 2.14 | 1.002 | 77.61 | 2001-06-18 |
| PG 1427+480 | 0.221 | 7.86 | 0.57 | 1.88 | 1.922 | 2.363 | 2002-05-31 |
| PG 1440+356 | 0.077 | 7.28 | 1.07 | 1.03 | 2.276 | 3.391 | 2001-12-23 |
| PG 1444+407 | 0.267 | 8.17 | 0.71 | 1.25 | 2.107 | 3.752 | 2002-08-11 |
| PG 1501+106 | 0.036 | 8.23 | 0.12 | 2.34 | 1.940 | 2.769 | 2001-01-14 |
2 data
We use the same source sample of high mass accretion rate AGN (PG Quasars and NLS1’s) as Crummy et al (2006). Those which overlapped the sample of GD04 had spectra extracted from the XMM-Newton database using SAS 5.4 software, selecting only X-ray events corresponding to patterns 0-12 (MOS) and 0-4 (PN), while those not included in the GD04 sample were extracted using SAS 7.0 with appropriate checks for consistency in extraction method and ouput performed. Source and background spectra were extracted from circular regions of 45 arcsec in radius around the object and in an offset position clear of other sources respectively. XMM-Newton Optical Monitor (OM) data was extracted using omichain, and the extracted instrumental magnitudes are converted to flux points, calibrated with respect to Vega in each filter, with calibration values and corresponding fluxes are provided by the XMM-Newton Science Operations Centre.111http://xmm.vilspa.esa.es/sas/documentation/watchout/uvflux.shtml
| Source | z | logM/M⊙ | L/LEdd | Galactic column | Soft Excess | Obs. Date | |
|---|---|---|---|---|---|---|---|
| (x1020cm) | at 0.5keV | ||||||
| NGC 4051 | 0.002 | 6.13 f | 0.31 a | 1.32 | 1.245 | 3.601 | 2001-05-16 |
| IRAS 13349+2438 | 0.108 | 8.90 d | 0.24i | 1.16 | 1.966 | 3.634 | 2000-06-20 |
| ARK 564 | 0.025 | 6.46 e | 2.75 a | 6.40 | 2.501 | 2.257 | 2000-06-17 |
| MRK 1044 | 0.016 | 6.23 e | 1.25 a | 3.55 | 1.937 | 3.472 | 2002-07-23 |
| E 1346+266 | 0.915 | 8.30 b | 1.40 b | 1.18 | 2.299 | 2.612 | 2003-01-13 |
| MRK 0359 | 0.017 | 6.23 e | 1.79 a | 4.80 | 1.765 | 2.312 | 2000-07-09 |
| PHL 1092 | 0.396 | 8.20 b | approx 1.00 b | 4.07 | 1.979 | 18.621 | 2003-01-18 |
| RE J1034+396 | 0.042 | 6.45 a | 0.28 a | 1.47 | 2.290 | 7.325 | 2002-05-01 |
| PKS 0558-504 | 0.137 | 7.65 c | 1.72 g | 4.38 | 2.255 | 2.344 | 2000-05-24 |
| MRK 0766 | 0.013 | 6.63 e | 0.47 a | 1.71 | 1.917 | 1.624 | 2000-05-20 |
| MRK 0586 | 0.155 | 7.86 f | 3.37 h | 3.51 | 2.245 | 2.659 | 2002-07-23 |
| TON S180 | 0.062 | 7.06 f | 2.98 a | 1.55 | 2.286 | 2.461 | 2000-12-14 |
2.1 Sample properties
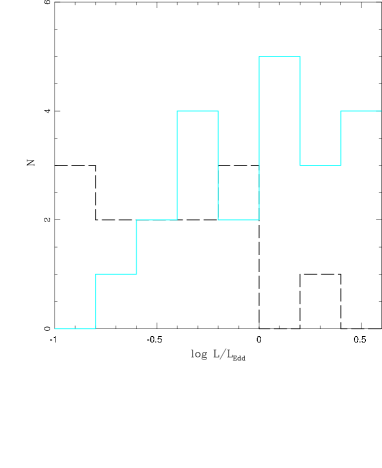
The Crummy et al (2006) sample contains 21 NLS1 and 13 broad line AGN. The distribution of luminosities (from tables 1 & 2) are shown as a histogram in Fig. 1 and clearly show that the NLS1 AGN are the major contributors at the high luminosity end. A test shows that the two luminosity distribution are different at 92 per cent confidence (), with the NLS1’s have systematically higher inferred than the non-NLS1 AGN, as noted by e.g. Boroson (2002).
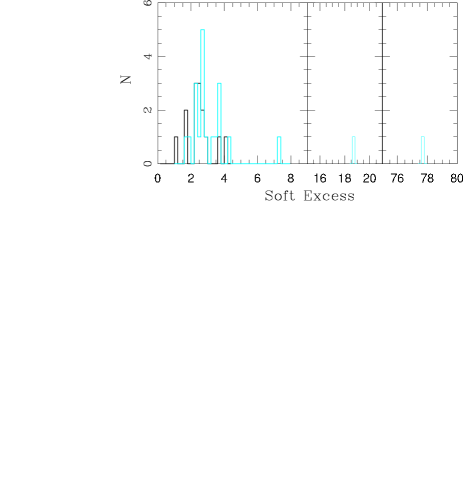 |
We follow Sobolewska & Done (2007) and parameterise the strength of the soft excess in each source by fitting a power law with galactic absorption to the 2-10 keV spectrum and then taking the ratio of this to the data at 0.5 keV. Fig. 2 shows the histogram of these values. Whilst the NLS1’s show the highest soft excess values the distribution is not significantly different to that of the broad line AGN. More than 70 per cent of the sample have soft excesses greater than the maximum value from isotropic reflection of (see Fig. 4), and three sources (PG1404+226, PHL 1092 and REJ1034+396) have soft excesses .
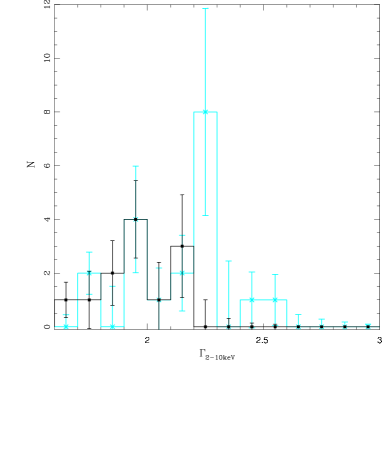
Fig. 3 shows the distribution of apparent 2–10 keV power law index. For this, and for all other histograms of fit parameters where the uncertainties are well defined, we use a bootstrap Monte Carlo to assess the impact of these on each bin of the histogram. The uncertainties (shown as an error bar on each bin) are not independent as they have to sum to the given number of objects, but it is clear that the NLS1s show a significantly different distribution to the broad line AGN. However, this is not a simple difference in mean spectral index as seen in previous studies where NLS1’s were significantly steeper than broad line AGN in 2–10 keV (Brandt, Mathur & Elvis 1997). Fig. 3 shows that there are some NLS1 which are extremely flat, as well as some being very steep. The two sets of objects have similar mean indices in these samples, but the NLS1’s have larger dispersion. As pointed out by Gierli’nski & Done (2004), intrinsic power laws with are not compatible with the steep tail seen in similarly high mass accretion rate BHB. Either the underlying emission mechanisms are substantially different between the stellar and supermassive black holes, or these spectra are highly distorted.
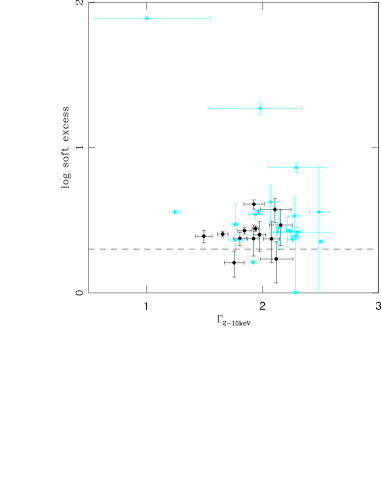
Fig. 4 shows the soft excess strength versus the 2–10 keV power law spectral slope. This shows that there is no overall correlation between these two. This is somewhat surprising, as both reflection and absorption models would be expected to show such a correlation in their simplest versions where the ionization state of the material remains constant. However, observations show that the variability is more complex. Detailed variability studies of individual objects show that the spectra are steep at high flux levels, with iron features in emission and a moderate soft excess, while at minimum flux the 2–10 keV spectrum is very flat, with an extremely strong soft excess and complex features at iron (e.g. Miller et al 2007).
3 Spectral fitting and results
We now fit the full smeared absorption model, swind1 as described by Gierliński & Done (2006) to the full 0.3–10 keV spectral data. This is parameterised by the velocity dispersion (, with upper limit of as the terminal velocity in an outflow is at least twice the Gaussian dispersion), which controls the amount of smearing, as well as column density, , and ionization state . This smeared absorption is applied to an intrinsic power law, and its reflected emission (using the xion hydrostatic disc models, with inner and outer radii set to 30 and 1000, respectively, leaving the solid angle and ratio of X–ray to intrinsic disc illumination as free parameters). This total spectrum is further modified by galactic absorption (wabs, with minimum value set to the Galactic column along the line of sight but with upper limit free to allow for host galaxy absorption) and one or more warm absorbers (xstar table models 19 and 25, publicly available from the xstar web site222ftp://legacy.gsfc.nasa.gov/software/plasma_codes/xstar/xspectables, parameterised by column density, , and ionization state . We fix the redshift of both the narrow and smeared ionized absorbers to the rest-frame of the AGN. Our model then allows enough free-parameters to describe the data consistently across a broad sample and be well constrained even in the case of poor sinal-to-noise.
| Source | (d.o.f) | (d.o.f) | swind1 | swind1 | swind1 | Intrinsic | Ldisc/Lbol |
|---|---|---|---|---|---|---|---|
| Reflection | Absorption | ||||||
| PG 0003+199∗ | 0.939 (968) | 1.214 (2112) | 2.879 | 11.1 | 0.500 | 2.559 | 0.409 |
| PG 0050+124∗ | 1.117 (924) | 1.183 (1616) | 3.608 | 50.0 | 0.500 | 2.457 | 0.518 |
| PG 0157+001 | 0.861 (234) | 1.030 (511) | 3.229 | 19.4 | 0.500 | 2.379 | 0.850 |
| PG 0844+349∗ | 0.987 (627) | 1.039 (1361) | 3.075 | 17.5 | 0.333 | 2.513 | 0.521 |
| PG 0947+396 | 0.893 (477) | 0.944 (874) | 3.552 | 50.0 | 0.500 | 2.176 | 0.865OM |
| PG 0953+414 | 1.055 (512) | 1.065 (899) | 3.318 | 34.9 | 0.500 | 2.349 | 0.878OM |
| PG 1048+342 | 1.043 (534) | 1.075 (907) | 3.103 | 20.0 | 0.500 | 2.190 | 0.914OM |
| PG 1115+407∗ | 0.913 (413) | 0.912 (746) | 3.597 | 34.4 | 0.482 | 2.535 | 0.945OM |
| PG 1116+215 | 1.007 (397) | 0.900 (845) | 3.280 | 25.4 | 0.500 | 2.406 | 0.935OM |
| PG 1202+281 | 1.009 (553) | 1.038 (992) | 3.174 | 28.7 | 0.445 | 2.111 | 0.810OM |
| PG 1211+143∗ | 1.274 (936) | 1.400 (1608) | 2.547 | 9.5 | 0.114 | 2.556 | 0.964OM |
| PG 1244+026∗ | 1.102 (292) | 1.070 (745) | 3.364 | 50.0 | 0.500 | 2.733 | 0.306 |
| PG 1307+085 | 0.871 (265) | 0.972 (608) | 3.007 | 21.0 | 0.358 | 2.115 | 0.971OM |
| PG 1309+355 | 0.927 (293) | 0.972 (580) | 3.741 | 34.8 | 0.153 | 2.030 | 0.974OM |
| PG 1322+659 | 1.009 (331) | 0.890 (614) | 3.050 | 20.1 | 0.413 | 2.635 | 0.901OM |
| PG 1352+183 | 1.002 (370) | 1.070 (855) | 3.358 | 49.8 | 0.500 | 2.347 | 0.734OM |
| PG 1402+261∗ | 1.129 (384) | 0.901 (788) | 3.385 | 45.4 | 0.500 | 2.441 | 0.953OM |
| PG 1404+226∗ | 0.893 (190) | 1.070 (364) | 2.953 | 45.8 | 0.346 | 2.880 | 0.755 |
| PG 1427+480 | 0.985 (524) | 1.127 (915) | 3.301 | 27.6 | 0.500 | 2.245 | 0.925OM |
| PG 1440+356∗ | 0.989 (289) | 1.064 (1321) | 3.145 | 26.4 | 0.500 | 2.701 | 0.941OM |
| PG 1444+407 | 1.297 (289) | 1.156 (470) | 3.444 | 49.9 | 0.500 | 2.541 | 0.937OM |
| PG 1501+106 | 0.981 (931) | 1.250 (1655) | 3.086 | 18.5 | 0.332 | 2.381 | 0.697 |
| NGC 4051∗ | 1.240 (1040) | 0.982 (597) | 2.817 | 18.2 | 0.375 | 2.030 | 0.729BF |
| IRAS 13349+2438∗ | 1.198 (664) | 1.372 (772) | 2.549 | 10.9 | 0.290 | 2.779 | 0.917 |
| ARK 564∗ | 1.197 (666) | 1.436 (1342) | 3.406 | 36.2 | 0.500 | 2.715 | 0.877OM |
| MRK 1044∗ | 1.081 (530) | 1.144 (717) | 2.826 | 12.6 | 0.314 | 2.492 | 0.593 |
| E 1346+266∗ | 1.068 (229) | 1.071 (343) | 3.372 | 45.6 | 0.500 | 2.900 | 0.525OM |
| MRK 0359∗ | 1.117 (527) | 0.983 (673) | 3.295 | 9.3 | 0.500 | 2.083 | 0.941 |
| PHL 1092∗ | 1.237 (180) | 1.279 (222) | 2.990 | 50.0 | 0.500 | 3.388 | 0.741 |
| RE J1034+396∗ | 1.081 (282) | 1.105 (370) | 2.650 | 16.7 | 0.500 | 3.357 | 0.629OM |
| PKS 0558-504∗ | 1.063 (371) | 0.877 (949) | 2.751 | 9.4 | 0.500 | 2.547 | 0.932OM |
| MRK 0766 ∗ | 1.119 (952) | 1.163 (760) | 2.661 | 4.6 | 0.277 | 2.222 | 0.914BF |
| MRK 0586∗ | 1.007 (523) | 1.156 (524) | 2.861 | 14.9 | 0.351 | 2.698 | 0.952OM |
| TON S180∗ | 1.396 (778) | 1.207 (990) | 3.168 | 24.1 | 0.500 | 2.632 | 0.465 |
The results of the fits with our absorption model are shown in Table 3. The reduced are statistically indistinguishable from those obtained in the reflection fits of Crummy et al. (2006) over the large sample of objects. Both reflection and absorption models have enough freedom to produce an acceptable fit the data over the 0.3–10 keV bandpass of a wide range of different spectral shapes, especially given the presence of the narrow warm absorber systems as well.
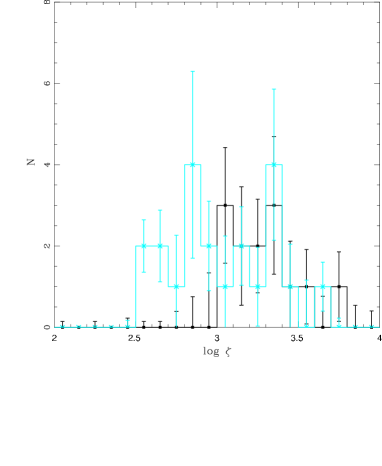
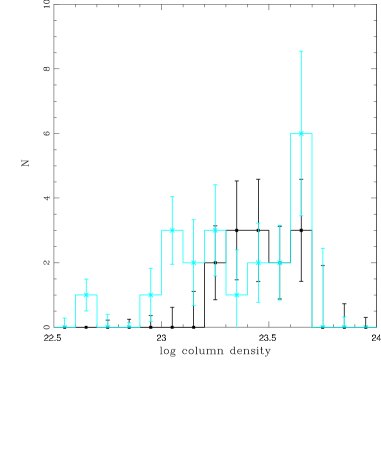
Figs. 5 and 6 shows the derived and for the wind. Plainly they are strongly peaked at and cm-2, respectively. This apparent ’fine–tuning’ can be explained as a consequence of the rapid change in ionization which is produced self–consistently in X–ray illuminated systems with some pressure balance condition (Krolik, McKee & Tarter 1981; Chevallier et al 2006). The X–ray illuminated face of the cloud is heated to the Compton temperature, so expands and has low density. This means its ionization parameter, is high, and the material is fully ionised and hence invisible. Further into the cloud the X-ray heating is less effective due to scattering in the upper layers, so the density increases in order to maintain pressure. This increases the importance of bremsstrahlung cooling, pulling the temperature down further, and increasing the density. Eventually drops below where not all species are ionised and bound–free and bound–bound transitions dramatically increase the cooling. The density drops very rapidly, which further decreases the ionization, leading to the possibility of yet more line transitions. This runaway cooling only stops when the material is nearly neutral, so a further decrease in ionization does not lead to an increase in the available line transitions. The corresponding rapid contraction of the cloud (required to enhance the density) may lead to fragmentation of this low ionization part of the cloud into clumps. A line of sight through the cloud goes through the highly ionized layer (small opacity), the transition layer (mean and column of cm-2) but is not likely to intercept any of the opaque cool clumps as these have low covering factor (Chevallier et al 2006).
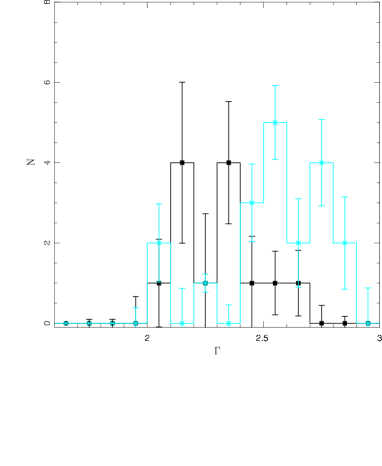
Table 3 shows the individual best-fit wind velocity dispersions within our model. The values are large, with many pegged at the upper limit of . Most of these can be somewhat reduced allowing the smeared absorber to be blue (or red) shifted. This has no effect on the intrinsic spectral index but tends to decrease the derived column and ionisation parameter by a factor 2 (fairly negligible on a log plot such as Figs 6 and 7). Nonetheless, even with this extra degree of freedom the velocity dispersion rarely drops below due to the requirement that the soft excess is a single smooth component, while atomic processes give two strong features, associated with OVII/VIII at 0.7-0.8 keV and Fe L at 1.5-2 keV, respectively. This is still too large to be associated with the UV line driven disc wind which must be present in such high AGN. Proga (2004) show that such winds have terminal velocities of , corresponding to a Gaussian dispersion at least a factor 2 smaller (more precisely, for constant acceleration: Schurch & Done 2007). Thus this requires that the outflow is magnetically driven (associated with the jet?) if the soft excess really is due to smeared absorption.
Fig. 7 shows the inferred intrinsic power law index. Unlike the apparent 2–10 keV index shown in Fig 3., there are now no objects with spectra significantly harder than . This is not the case for the reflection models of Crummy et al (2006), where PG 1048+342, PG 1211+143, PG 1307+085 and (especially) Mkn 359 are all inferred to have hard spectra. This is an important difference arguing in favour of the absorption modelling as high mass accretion rate BHB almost always show soft spectra, so by analogy we expect the high mass accretion rate AGN to do likewise. This histogram also shows that the NLS1’s have somewhat softer spectra than the broad line AGN, with as opposed to (see also Brandt et al 1997). By analogy with the BHB, this might indicate that the NLS1’s correspond to the ’Very High State’, characterised by a soft tail, with , while the broad line AGN correspond to the ’High/Soft’ (or thermal dominant) state, where the tail has (Remillard & McClintock 2006).
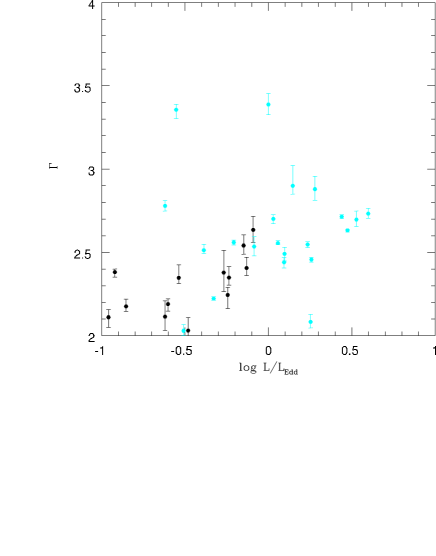
Given that the NLS1 also have significantly higher than the broad line AGN (Fig. 1) then it is also clear that in our sample the intrinsic spectral index will correlate with . This is shown in Fig. 8, and is remarkably well defined, especially considering the uncertainties in determining mass for these AGN. There is no such clear correlation in the Galactic binaries but this is probably due to hysteresis complicating their observed behaviour (e.g. Remillard & McClintock 2006). It is now clear that hysteresis in black hole binaries is connected to the dramatic disc instability (Gladstone, Done & Gierlinski 2007), which probably does not occur in AGN (Done & Gierlinski 2005). Thus it may be that AGN show the intrinsic (steady state) accretion flow properties more clearly than black hole binaries, and have spectral index correlated with (Shemmer et al 2006).
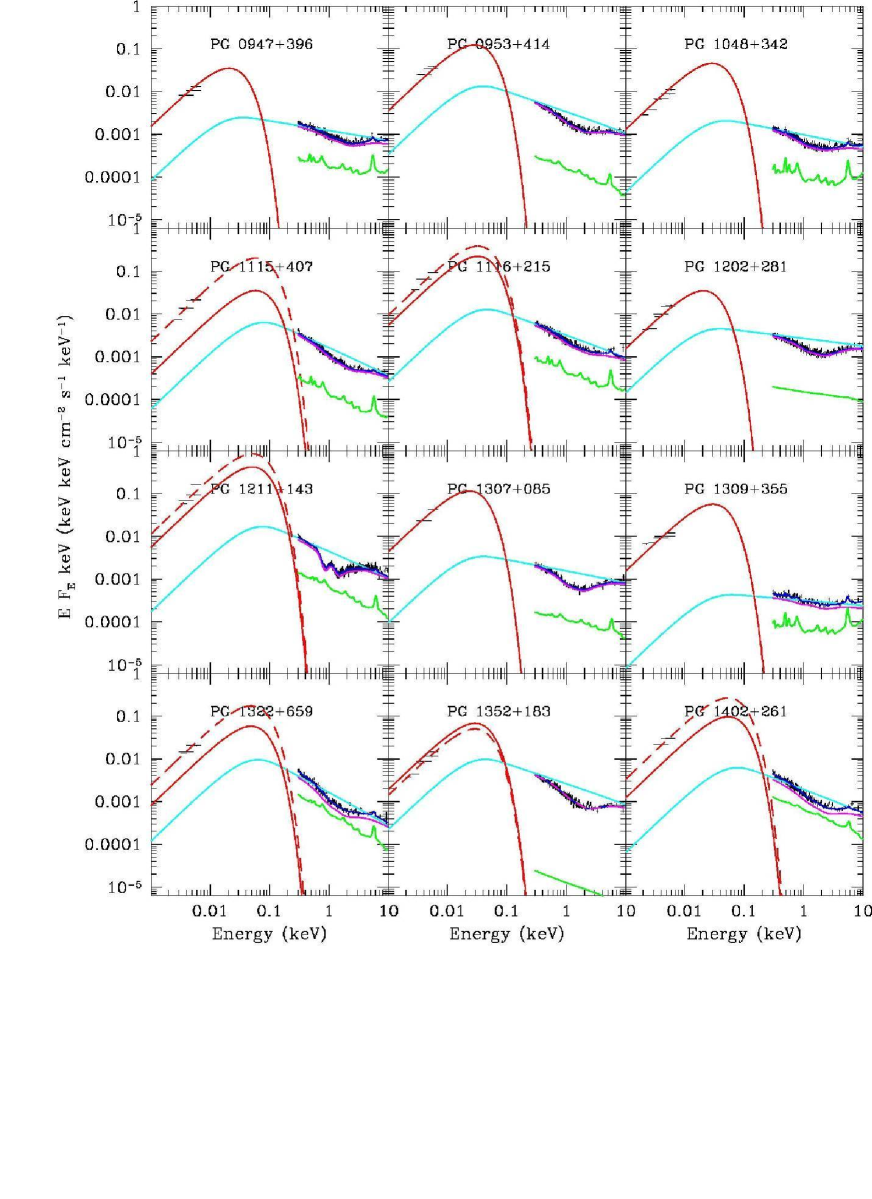
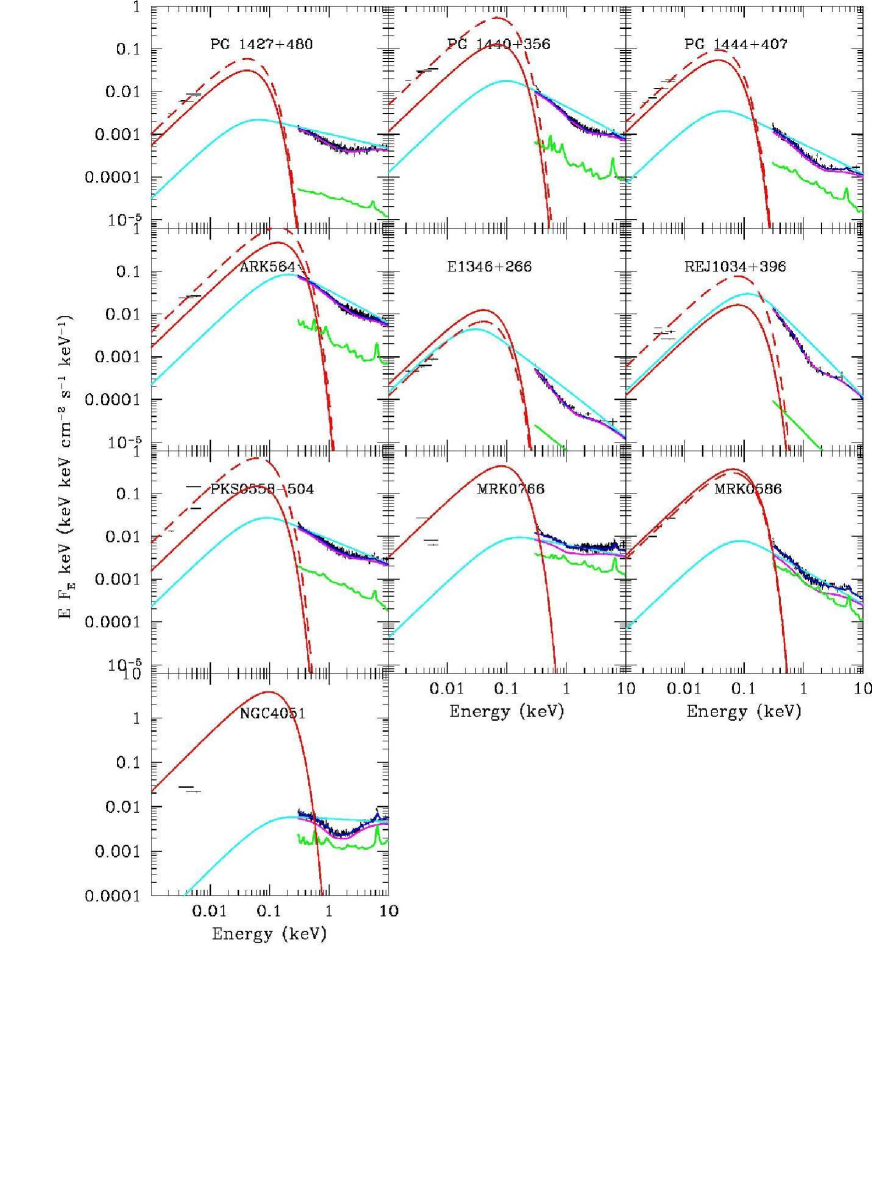
4 Simultaneous SED’s
The full observational criteria for BHB spectral state involve the fraction of the disc to total luminosity as well as the shape of the tail. For those observations for which there are at least two XMM-Newton OM data points we can construct the SED spanning the optical-UV-X–ray range, i.e. covering both the disc and Comptonized tail. This means we can characterise the full accretion power of the system, and derive the disc to total power ratio, and hence determine spectral state.
We use the parameters of our the best fitting model derived in Section 3 to deconvolve the data from the instrument response, and to correct for neutral absorption (both from our Galaxy and the AGN host galaxy) and narrow XSTAR ionised absorption. On top of these absorption corrected, deconvolved data, we also plot the best estimate for the intrinsic Comptonized spectrum (cyan, with seed photons assumed to be at the same temperature of the disc, see below) and the effect of smeared absorption on this (magenta). The inferred intrinsic reflection component is also included on the plot (green) and the total (intrinsic plus reflection, both absorbed by the smeared wind) fit to the data (blue).
We use the upper and lower limits on the (galactic and host Galaxy) neutral to get upper and lower limits in the optical/UV reddening (Predehl & Schmidt 1995). These are used to get uncertainties on the dereddened optical/UV flux from the OM data. We include an additional standard diskbb model with normalization and temperature determined from the tabulated MBH and L/LEdd for each AGN (red). This should generally overestimate the optical/UV flux, since this assumes that the entire bolometric luminosity is produced in the disc. The fact that this generally matches to the data shows immediately that this is a fairly good approximation for most of these AGN, and that the high energy tail (cyan) is not energetically dominant, though there are a few exceptions to this (E1346+266 and RE J1034+396). Since the luminosity is taken simply from the tabulated values then time variability is also an issue, hence we also show a disc spectrum which gives a better match to the OM points (dotted red line).
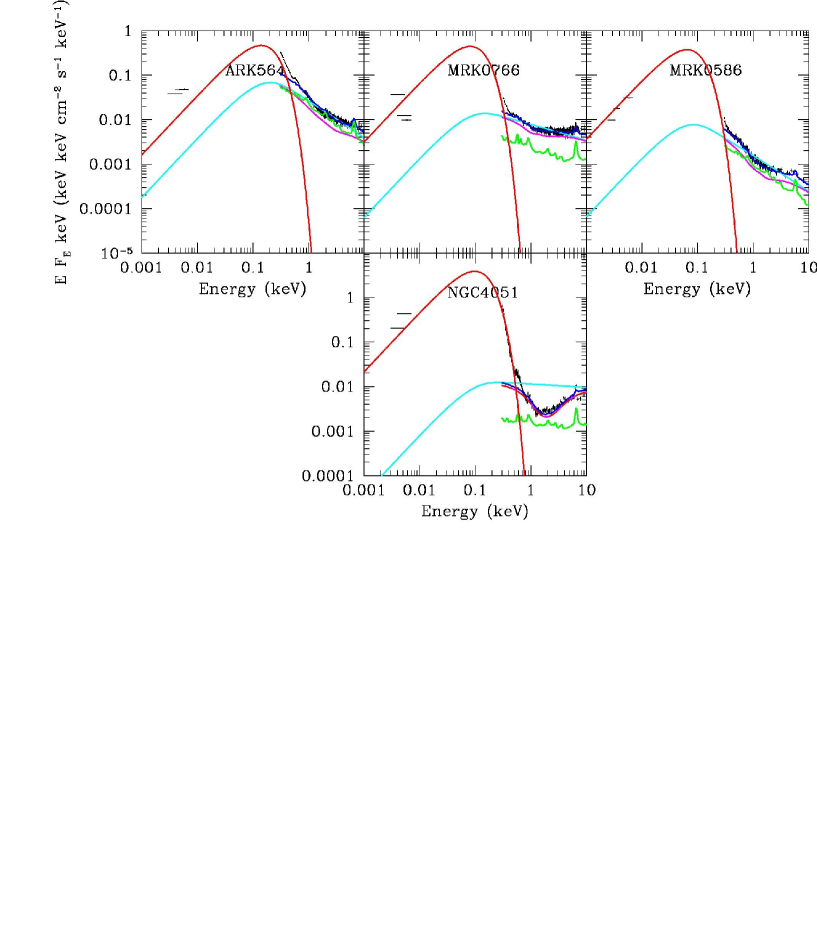
There are a few objects where the optical/UV spectra have a very different slope than that predicted by disc models, the NLS1’s MRK 766 and NGC 4051. These are also objects where the black hole mass is low enough and high enough for the predicted disc spectra to extend into the soft X–ray band. Since the disc was not included in the X–ray spectral model then its presence would lead to an underestimate of the X–ray column density. This would underestimate the internal host galaxy reddening which could lead to the observed downturn in optical/UV flux. Hence we refit the X–ray data of these objects including the disc component. The increased reddening in NGC 4051 is sufficient to reverse the optical/UV slope, making it much more compatible with the expected accretion disc spectrum. However, this is not the case for MRK 766, where the optical data clearly appear absorbed even with a larger host Galaxy column. We suggest that these data are indeed strongly reddened, perhaps from a dust entrained in the narrow warm absorber systems in a similar manner to MCG–6–30–15 (Reynolds 1997; Kraemer et al 2000; Ballantyne, Weingartner & Murray 2003).
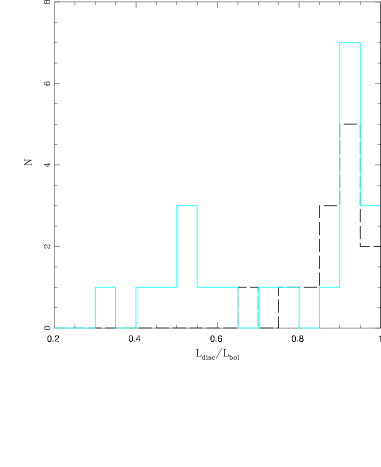
We use these best estimates of the unabsorbed disc spectrum (dotted red line) to quantify the ratio of luminosity in the tail to the total luminosity or Ltail/Ltot. In BHB the High/Soft (thermal dominant) State is defined as Ldisc/L 0.75, while the Intermediate/Very High State (steep power law state) is defined to have and . By contrast the Low/Hard state has and . The values of these ratios and the inferred analogous XRB states are given in Table 6, and the histogram of this for the entire sample is shown in Fig. 12.
This shows a less clear cut distinction between the NLS1 and broad line AGN than in Fig. 7. While the NLS1 spectral indices are indeed steep, as expected for the ’Very High State’ in BHB, they do not in general have . Also, they do not in general have a significantly smaller than the broad line AGN (though the objects with the weakest discs are NLS1’s), as expected if the NLS1 correspond to the Very High State, while the broad line AGN correspond to the High/Soft state. This lack of correspondence with the BHB could be due to lack of data in the extreme UV where the disc spectra peak. The disc luminosities are inferred assuming that their spectra follow the expected standard form, yet there is clear evidence in BHB that this is not the case in the Very High State, where discs in BHB can show much lower maximum temperature than expected for their luminosity (Kubota & Done 2004; Done & Kubota 2006). If the NLS1’s are indeed analogous to the Very High state and have similarly distorted disc spectra then our estimate of total disc luminosity from the optical/UV flux is too high. There is some evidence to support this in NGC 4051, as the high temperature, luminous disc component shown in Fig. 11 is strongly ruled out by the XMM-Newton data.
5 Conclusions
We show that the X–ray spectra of a heterogeneous sample of QSOs and NLS1’s can be equally well fit by partially ionised, Doppler smeared material seen in absorption as by the the alternative geometry where this material is optically thick and seen in reflection (Crummy et al 2006). Thus the 0.3–10 keV spectral data alone cannot distinguish the underlying geometry of this partially ionised material, nor in fact can it unambiguously show that it does indeed exist as the Doppler smearing is so extreme as to merge the characteristic atomic features into a quasi–continuum. Thus we have only indirect evidence for its existence, namely the peak in rms variability spectra between 0.7–3 keV (e.g. Ponti et al 2006; Gierliński & Done 2006), and the constant ’temperature’ of the soft excess component, together with the fact that this material can also distort the higher energy spectra, producing occasional apparently anomalously hard (by comparison with high BHB) 2–10 keV spectra. Similarly indirect arguments from physical plausibility support a geometry in which this material is optically thin and seen in absorption (Chevallier et al 2006; Sobolewska & Done 2007; Done & Nayakshin 2007). Such absorption is likely to be very complex, clumpy, and time dependent, with multiple velocity structures.
Nonetheless, despite the difficulties in producing realistic models to compare with the data, even the simple models used here can begin to reconstruct the intrinsic X–ray emission. These reinforce the links between supermassive and stellar black holes, as the inferred intrinsic X–ray spectra are all soft, as expected by analogy with the high mass accretion rates (high/soft and very high) states in the binary systems. All objects with the apparently hard 2–10 keV spectral indices can be explained as being intrinsically soft, but strongly distorted by the smeared absorption. Furthermore, there is a clear correlation between the intrinsic X–ray index and the type of AGN, with NLS1’s having softer X–ray spectra than broad line AGN, consistent with them being the analogues of the Very High State while the broad line AGN are identified with the High/Soft State. respectively. However, this analogy does not appear to hold in terms of the ratio of disc to total luminosity. The Very High state in BHB has the disc be less than 80 per cent of the total accretion power, while the NLS1’s show a range of values, with many having the disc more dominant than expected. This could point to subtle differences in how spectral states are seen between stellar and supermassive black holes, but we stress that this could also result from a lack of data in the EUV region where the disc luminosity peaks. Disc spectra in the Very High State in BHB are often somewhat distorted. Similar distortions in the NLS1 would result in an overestimate of the total disc flux inferred from the observed optical/UV points. This could recover a straightforward correspondence between the spectral states as seen in BHB and AGN type.
References
- [\citeauthoryearAbramowicz et al.1988] Abramowicz M. A., Czerny B., Lasota J. P., Szuszkiewicz E., 1988, ApJ, 332, 646
- [Ballantyne et al.(2003)] Ballantyne, D. R., Weingartner, J. C., & Murray, N. 2003, A& A, 409, 503
- [\citeauthoryearBeichman et al.1986] Beichman C. A., Soifer B. T., Helou G., Chester T. J., Neugebauer G., Gillett F. C., Low F. J., 1986, ApJ, 308, L1
- [\citeauthoryearBian & Zhao2003] Bian W., Zhao Y., 2003, ApJ, 591, 733
- [\citeauthoryearBlustin et al.2005] Blustin A. J., Page M. J., Fuerst S. V., Branduardi-Raymont G., Ashton C. E., 2005, A&A, 431, 111
- [\citeauthoryearBoroson2002] Boroson T. A., 2002, ApJ, 565, 78
- [\citeauthoryearBrandt, Mathur, & Elvis1997] Brandt W. N., Mathur S., Elvis M., 1997, MNRAS, 285, L25
- [\citeauthoryearBrinkmann et al.2004] Brinkmann W., Arévalo P., Gliozzi M., Ferrero E., 2004, A&A, 415, 959
- [\citeauthoryearChevallier et al.2006] Chevallier L., Collin S., Dumont A.-M., Czerny B., Mouchet M., Gonçalves A. C., Goosmann R., 2006, A&A, 449, 493
- [\citeauthoryearChurazov, Gilfanov, & Revnivtsev2001] Churazov E., Gilfanov M., Revnivtsev M., 2001, MNRAS, 321, 759
- [\citeauthoryearCrummy et al.2006] Crummy J., Fabian A. C., Gallo L., Ross R. R., 2006, MNRAS, 365, 1067
- [\citeauthoryearCzerny & Elvis1987] Czerny B., Elvis M., 1987, ApJ, 321, 305
- [\citeauthoryearCzerny et al.2003] Czerny B., Nikołajuk M., Różańska A., Dumont A.-M., Loska Z., Zycki P. T., 2003, A&A, 412, 317
- [\citeauthoryearDasgupta, Rao, & Dewangan2004] Dasgupta S., Rao A. R., Dewangan G. C., 2004, ApJ, 614, 626
- [\citeauthoryearDone2007] Done C., 2007, astro, arXiv:astro-ph/0703452
- [\citeauthoryearDone & Gierliński2005] Done C., Gierliński M., 2005, MNRAS, 364, 208
- [\citeauthoryearDone & Kubota2006] Done C., Kubota A., 2006, MNRAS, 371, 1216
- [\citeauthoryearDone & Nayakshin2007] Done C., Nayakshin S., 2007, astro, arXiv:astro-ph/0701410
- [\citeauthoryearFabian et al.2002] Fabian A. C., Ballantyne D. R., Merloni A., Vaughan S., Iwasawa K., Boller T., 2002, MNRAS, 331, L35
- [\citeauthoryearGierliński & Done2004] Gierliński M., Done C., 2004, MNRAS, 349, L7
- [\citeauthoryearGierliński & Done2006] Gierliński M., Done C., 2006, MNRAS, L64
- [\citeauthoryearGladstone, Done, & Gierlinski2006] Gladstone J., Done C., Gierlinski M., 2006, astro, arXiv:astro-ph/0603126
- [\citeauthoryearHao et al.2005] Hao C. N., Xia X. Y., Mao S., Wu H., Deng Z. G., 2005, ApJ, 625, 78
- [Kraemer et al.(2000)] Kraemer, S. B., George, I. M., Turner, T. J., & Crenshaw, D. M. 2000, ApJ, 535, 53
- [\citeauthoryearKrolik, McKee, & Tarter1981] Krolik J. H., McKee C. F., Tarter C. B., 1981, ApJ, 249, 422
- [\citeauthoryearKubota & Done2004] Kubota A., Done C., 2004, MNRAS, 353, 980
- [\citeauthoryearMcHardy et al.2006] McHardy I. M., Koerding E., Knigge C., Uttley P., Fender R. P., 2006, Natur, 444, 730
- [\citeauthoryearMiller et al.2007] Miller L., Turner T. J., Reeves J. N., George I. M., Kraemer S. B., Wingert B., 2007, A&A, 463, 131
- [\citeauthoryearMiniutti et al.2003] Miniutti G., Fabian A. C., Goyder R., Lasenby A. N., 2003, MNRAS, 344, L22
- [\citeauthoryearMiniutti & Fabian2004] Miniutti G., Fabian A. C., 2004, MNRAS, 349, 1435
- [\citeauthoryearMiniutti et al.2007] Miniutti G., et al., 2007, PASJ, 59, 315
- [\citeauthoryearO’Brien et al.2001] O’Brien, P. T., et al. 2001, A& A, 365, L122
- [\citeauthoryearPage et al.2004] Page K. L., Reeves J. N., O’Brien P. T., Turner M. J. L., Worrall D. M., 2004, MNRAS, 353, 133
- [\citeauthoryearPonti et al.2006] Ponti G., Miniutti G., Cappi M., Maraschi L., Fabian A. C., Iwasawa K., 2006, MNRAS, 368, 903
- [\citeauthoryearPorquet et al.2004] Porquet D., Reeves J. N., O’Brien P., Brinkmann W., 2004, A&A, 422, 85
- [\citeauthoryearPredehl & Schmitt1995] Predehl P., Schmitt J. H. M. M., 1995, A&A, 293, 889
- [\citeauthoryearProga & Kallman2004] Proga D., Kallman T. R., 2004, ApJ, 616, 688
- [\citeauthoryearRemillard & McClintock2006] Remillard R. A., McClintock J. E., 2006, ARA&A, 44, 49
- [Reynolds(1997)] Reynolds, C. S. 1997, MNRAS, 286, 513
- [\citeauthoryearSchurch & Done2007] Schurch N. J., Done C., 2007, arXiv, 706, arXiv:0706.1885
- [\citeauthoryearShakura & Sunyaev1973] Shakura N. I., Sunyaev R. A., 1973, A&A, 24, 337
- [\citeauthoryearShemmer et al.2006] Shemmer O., Brandt W. N., Netzer H., Maiolino R., Kaspi S., 2006, ApJ, 646, L29
- [\citeauthoryearSobolewska & Done2007] Sobolewska M. A., Done C., 2007, MNRAS, 374, 150
- [\citeauthoryearTanaka, Boller, & Gallo2005] Tanaka Y., Boller T., Gallo L., 2005, gbha.conf, 290
- [\citeauthoryearWang & Lu2001] Wang T., Lu Y., 2001, A&A, 377, 52
- [\citeauthoryearWoo & Urry2002] Woo J.-H., Urry C. M., 2002, ApJ, 581, L5