The Rotation of sub-populations in Centauri111Based on data obtained with the Giraffe-FLAMES facility of ESO Very Large Telescope during the Ital-FLAMES GTO programme 71.D-0217(A). Also based on data from the VALD and GEISA databases.
Abstract
We present the first result of the Ital-FLAMES survey of red giant branch (RGB) stars in Cen. Radial velocities with a precision of 0.5 km s-1 are presented for 650 members of Cen observed with FLAMES-Giraffe at the Very Large Telescope. We found that stars belonging to the metal-poor (RGB-MP), metal-intemediate (RGB-MInt) and metal-rich (RGB-a) sub-populations of Cen are all compatible with having the same rotational pattern. Our results appear to contradict past findings by Norris et al., who could not detect any rotational signature for metal-rich stars. The slightly higher precision of the present measurements and the much larger sample size, especially for the metal-richer stars, appear as the most likely explanation for this discrepancy. The result presented here weakens the body of evidence in favour of a merger event in the past history of Cen.
Subject headings:
globular clusters: individual (NGC 5139) – techniques: radial velocities1. Introduction
The giant globular cluster (GC) Centauri is one of the most studied objects in the Milky Way since the 60s, thanks to its many peculiar properties. As its main anomaly, Cen shows a wide abundance spread (1 dex) not only in the light elements, but also in the iron-peak elements (Norris & Da Costa, 1995; Norris et al., 1996; Suntzeff & Kraft, 1996; Smith et al., 2000), pointing towards a chemical evolution history more reminiscent of a dwarf galaxy than a genuine GC. Moreover, its structural, kinematical and dynamical properties appear atypical for a Galactic GC, having properties more similar to Dwarf Elliptical galactic nuclei (Mackey & van den Bergh, 2005), and being also an elongated (Geyer et al., 1983; Pancino et al., 2003), rotating system (Merritt et al., 1997) that is not completely relaxed dynamically (Anderson, 1997; Ferraro et al., 2006).
Among the most recent, puzzling results we list the detection of complex substructures in all evolutionary sequences, including the red giant branch (RGB, Lee et al., 1999; Pancino et al., 2000; Sollima et al., 2005a), the subgiant branch and turn-off region (SGB, Ferraro et al., 2004; Sollima et al., 2005b) and the main sequence (MS, Bedin et al., 2004; Piotto et al., 2005). These studies have raised new questions that need to be answered, such as the debated age differences among sub-populations (Hilker & Richtler, 2000; Hughes & Wallerstein, 2000; Sollima et al., 2005b), the possibility that some sub-populations possess an extremely high Helium content (Norris, 2004; Piotto et al., 2005) and others.
More related with the present paper, we point out a very interesting study on the correlations between chemical and kinematical properties of Cen carried out by Norris et al. (1997), where stars in the cluster were divided in two groups based on their Ca abundance. They showed that metal-poorer stars rotate as the majority of the cluster does, while metal-richer stars do not show any sign of rotation. They also showed that the radial velocity dispersion appears to decrease with metallicity, a very strange behaviour since metal-richer stars tend to be concentrated to the cluster center, which is dynamically hotter.
2. Observations and Data Treatment
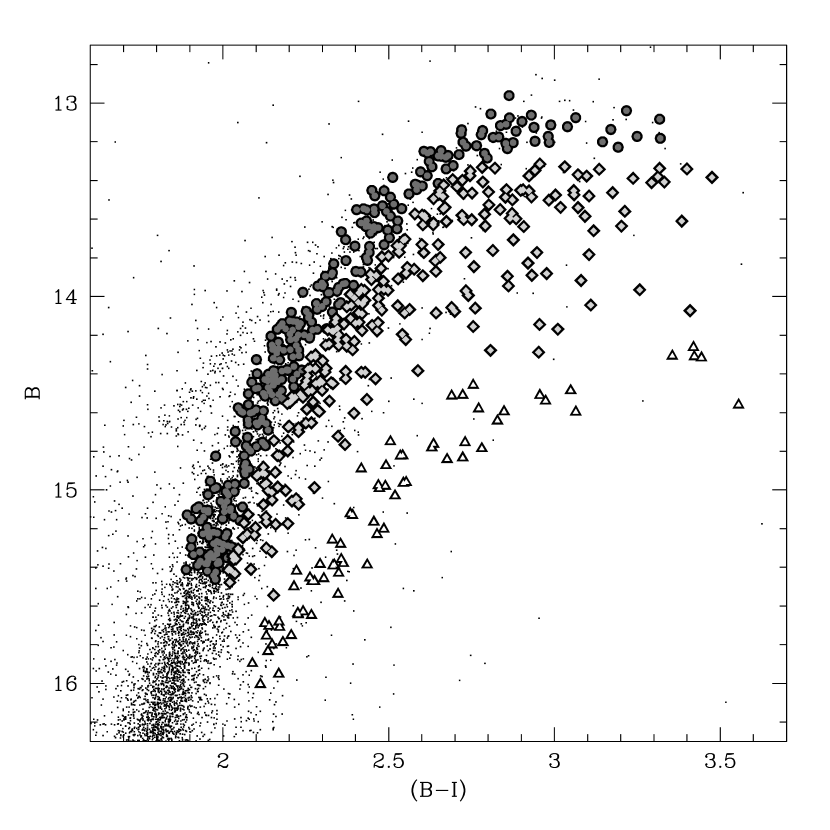
A sample of 700 red giants was selected from the wide field photometry originally published by Pancino et al. (2000) and Pancino (2003), to derive accurate chemical abundances of stars spanning the whole metallicity range of Cen. Special care was taken to include a large fraction of high-metallicity stars, which are the less studied up to now. All program stars are distributed within 15 arcmin from the cluster center. Figure 1 shows the program stars, marked on the B, (B–I) color magnitude diagram (CMD) of Pancino et al. (2000). Following the classification scheme of Pancino et al. (2000) and Pancino et al. (2003), stars are divided in three groups: the metal-poor population (RGB-MP) comprising 75% of the cluster giants, with [Fe/H]–1.6; the metal-intermediate population (RGB-MInt) comprising 20% of the cluster giants, with [Fe/H]–1.2 and the metal-rich or anomalous stars (RGB-a), 5% of the cluster giants, with [Fe/H]–0.6 (Pancino et al., 2002). Sample sizes are shown in Table 2.
Observations were done with FLAMES (Pasquini et al., 2002) at the ESO VLT in Paranal, Chile, between the 22nd and 28th of May 2003, within the Guaranteed Observing Time of the Ital-FLAMES Consortium. FLAMES was used in Medusa combined mode, feeding 8 fibers to UVES and 132 fibers to Giraffe. To ensure the maximum homogeneity in data quality and treatment, here we present the first results obtained with Giraffe only, using the high-resolution (R22500) grating HR13 (6120–6395Å) and reaching a S/N50-100 per pixel, depending on the star magnitude.
Data were reduced with the Giraffe BLDRS (Base-Line Data Reduction Software)333http://girbldrs.sourceforge.net, that includes cosmic rays removal, bias subtraction, flat field correction, wavelength calibration and pixel resampling. The version of the pipeline we used does not include inter-order background and sky subtraction, but these have no significant effect on radial velocity determinations.
Radial velocities were determined using DAOSPEC444http://cadcwww.hia.nrc.ca/stetson/daospec/;
http://www.bo.astro.it/ pancino/projects/daospec.html (Stetson &
Pancino, in preparation), a program that automatically measures
equivalent widths of absorption lines in high-resolution spectra. Radial
velocities are determined by cross-correlation of the measured line
centers and a set of laboratory wavelengths. We used 150 clean and
unblended lines of the most common species obtained from the
VALD555http://www.astro.uu.se/vald/ (Vienna
Atomic Line Database, Kupka et al., 1999). Observed radial velocities are the
average of the velocity obtained for each line after a 3
clipping, and the associated uncertainty is , where
is the number of lines used. Typical uncertainties are of the order of
0.13 km s-1.
| WFIaaWFI star number and B, I magnitudes from Pancino et al. (2000). | RAbbCoordinates obtained using the astrometric catalog by van Leeuwen et al. (2000). | DecbbCoordinates obtained using the astrometric catalog by van Leeuwen et al. (2000). | BaaWFI star number and B, I magnitudes from Pancino et al. (2000). | Ia | Vr | PopccPopulation classification according to Pancino et al. (2000) and Pancino et al. (2003); 1 stands for RGB-MP, 2 for RGB-MInt and 3 for RGB-a (see text for details). |
|---|---|---|---|---|---|---|
| — | (deg) | (deg) | (mag) | (mag) | (km s-1) | — |
| 100981 | 201.81686 | -47.59584 | 13.20 | 10.48 | 247.3770.226 | 1 |
| 102141 | 201.97864 | -47.58834 | 14.51 | 12.36 | 237.9100.382 | 1 |
| 102242 | 201.84398 | -47.58797 | 14.53 | 12.35 | 258.8940.455 | 1 |
| 103979 | 201.82367 | -47.57775 | 14.43 | 12.25 | 234.8160.197 | 1 |
| 104113 | 201.83088 | -47.57697 | 15.35 | 13.32 | 239.9670.781 | 2 |
Since radial velocities were not the main goal of the observing programme, simultaneous calibration lamps were not taken during the observations. We used laboratory wavelengths of the telluric lines of the 6300Å O2 absorption band from the GEISA666http://ara.lmd.polytechnique.fr/htdocs-public/products/GEISA/HTML-GEISA/ database (Gestion et Etude des Informations Spectroscopique Atmospheriques, Jaquinet-Husson et al., 2003) to find a common zeropoint to our observed velocities. The typical correction is less than 1 km s-1, with an uncertainty of 0.45 km s-1, but we found that for some exposures there were larger offsets, up to 3 km s-1. Finally, we applied the heliocentric correction using the rvcorrect task within IRAF777Image Reduction and Analysis Facility. IRAF is distributed by the National Optical Astronomy Observatories, which is operated by the association of Universities for Research in Astronomy, Inc., under contract with the National Science Foundation.. The resulting heliocentric radial velocities have a typical uncertainty of 0.5 km s-1 and are reported in Table 1.
Contaminating field stars were easily eliminated since their average velocity is –4.038.5 km s-1, in very good agreement with Galactic model predictions for Disk stars (Robin et al., 2003) and very different from the typical velocity of Cen. After removing all stars with V190 km s-1, the final sample contains 649 cluster members, with an average Vr=233.4 and =13.2 km s-1. Star by star comparisons with other catalogues yield a very good agreement. For instance, the average radial velocity difference of the 136 stars in common with Mayor et al. (1997) is Vr=0.41.4 km s-1, while for the 53 stars in common with Suntzeff & Kraft (1996) it is Vr=–0.51.8 km s-1 and for the 382 stars in common with Reijns et al. (2006) it is Vr=–2.44.6 km s-1.
3. Results
We used the photometric definition of populations described in Section 2, together with our radial velocity measurements, to construct rotation curves for sub-populations in Centauri. To this aim, we first de-projected RA and Dec into and coordinates with the following relations (see also van de Ven et al., 2006), suited for extended objects that are not close to the celestial equator:
where =10800/ is the scale factor to have X’ and Y’ in arcminutes.
As a second step, we searched for the orientation of the rotation axis that maximizes the amplitude of the rotation signal. We found a relatively broad maximum around and thus, for simplicity, we adopt a rotation axis aligned with the North-South direction, which corresponds to the Y’ axis and to the minor isophotal axis (Geyer et al., 1983; Pancino et al., 2003). We therefore plotted radial velocities of each sub-population against (Figure 2) and found a clear signature of rotation not only for the RGB-MP, as was expected, but also for the RGB-MInt and the RGB-a. The numbers of stars in the four quadrants of each rotation curve show that the rotational signature is strong even for the most sparse population, i.e., the RGB-a. Assuming that the rotation curves are symmetrical around the minor axis, we estimated the rotation velocity Vrot near the maximum (as found by Merritt et al., 1997; van de Ven et al., 2006) as the average of Vr between and from the center (see Table 2). As can be seen, the values of Vrot are comparable to each other, within the uncertainties, and are compatible with previous literature estimates.
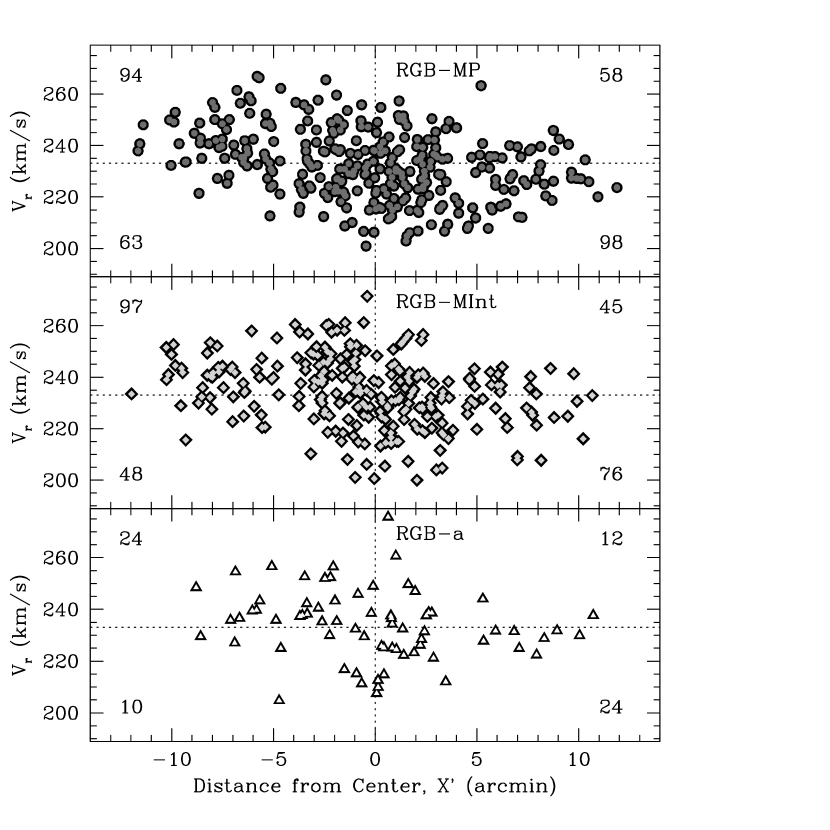
If the three samples were non-rotating, the histogram of radial velocities on the Eastern half of the cluster would be identical to the Western half (see Figure 2). A Kolmogorov-Smirnov test shows instead that the radial velocity distribution of stars on the Eastern side of the cluster has a very low probability of being extracted from the same parent distribution of the Western side. More quantitatively, the probabilities PKS derived from the cumulative distributions are: 10-5 for the RGB-MP, 510-6 for the RGB-MInt and 510-3 for the RGB-a.
3.1. Literature comparison
A correlation between kinematic properties and chemical abundances in Cen has been attempted, to our knowledge, only by Norris et al. (1997) and Sollima et al. (2005b). Norris et al. (1997) correlated the Calcium IR triplet abundances by Norris et al. (1996) with the radial velocity measurements by Mayor et al. (1997), for a global sample of 400 RGB stars. The sample was split in a metal-poor group with [Ca/H]–1.2 and a metal-rich group with [Ca/H]–1.2. The metal-poor group contains mainly stars that we classify as RGB-MP, with some contamination by RGB-MInt stars, while the metal-rich group contains mainly RGB-MInt and a handful of RGB-a stars, with very little contamination by RGB-MP stars.
The two main results presented by Norris et al. (1997) are (i) metal-poor stars rotate, while the metal-rich population does not show any sign of rotation (at a 2 level of confidence) and (ii) the radial velocity dispersion decreases as metallicity increases, i.e. the metal-rich population is kinematically cooler than the metal-poor one, even if it is concentrated in the central, hotter regions of the cluster888This was referred to as the radial velocity dipersion paradox in Cen, and a possible explanation, involving the presence of a face-on metal-rich disk, was presented by van den Bosch et al. (1999). Some support to this hypothesis comes from the possible presence of a small disc-like structure in the center of Cen pointed out by van de Ven et al. (2006).. A correlation between radial velocity dispersion and metallicity was also reported by Sollima et al. (2005b), who found a similar trend as in Norris et al. (1997), except that the dispersion increases again for the most metal rich stars in their sample.
| Population | Vr | Arot | V– | – | ||
|---|---|---|---|---|---|---|
| — | — | — | ||||
| Whole | 649 | 233.4 | 13.2 | 6 | 6.81.0 | 87 |
| RGB-MP | 313 | 232.5 | 13.3 | 7 | 8.11.5 | 46 |
| RGB-MInt | 266 | 234.2 | 13.1 | 6 | 5.31.7 | 33 |
| RGB-a | 70 | 234.0 | 13.4 | 4 | 6.03.0 | 8 |
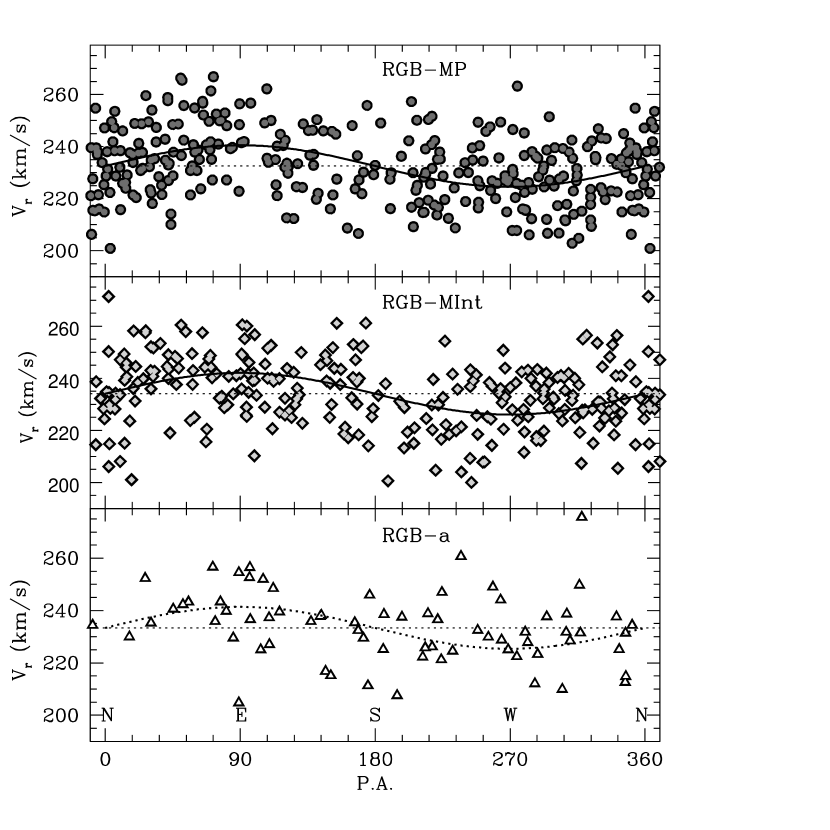
Velocity dispersions may be quite sensitive to outliers and to the radial distribution of the chosen samples, and a detailed analysis would greatly benefit from the metallicity estimates of individual stars that are not yet available. Here we simply note that there appears to be no difference in the global velocity dispersions of the three subsamples (Table 2). However, the present photometric classification is probably too coarse to reveal subtle effects such as the ones presented by Norris et al. (1997) and Sollima et al. (2005b), hence we postpone any conclusion on radial velocity dispersions to a future paper. On the other hand, strong coordinate motions like the rotation patterns shown in Figure 2 are clearly very robust to the effect of a few outliers and can be profitably studied with the available information. Even in the absence of individual metallicity estimates, Figure 2 leaves very little room for a non-rotating sub-population within Cen. To facilitate a comparison with Figure 3 by Norris et al. (1997), Figure 3 shows the run of Vr with the position angle (P.A.) for the three populations of Cen. As before, all populations show the well known rotation along the East-West direction (Norris et al., 1997; Merritt et al., 1997). Even the RGB-a, despite the smaller sample, is still compatible with the same rotational pattern. The amplitude Arot of the rotation signal in Figure 3, obtained with a minimization, is reported in Table 2. However, Arot can only be considered as an indicative value since it contains contributions from stars at very different radii, and the systemic rotation is highly radius dependent.
We considered two possible reasons why the rotational signature999As stated before, the data presented in this paper do not allow to reach a firm conclusion on the velocity dispersion, so we will only consider the rotation patterns in the following discussion. was not found before: sample size and measurement precision. The size of the entire sample is not so different: Norris et al. (1997) had 400 stars, we have 650. However our sample contains more metal-rich stars: we have 313 stars in the RGB-MP, and 336 stars in the RGB-MInt and RGB-a together, while Norris et al. (1997) had 300 metal-poor stars and less than 100 metal-rich stars. Also, the precision of the radial velocity measurements could play a role, although we have an uncertainty of 0.5 km s-1 and Mayor et al. (1997) have an uncertainty which is only slightly higher and still below 1 km s-1. However, as Norris et al. (1997) made clear, the absence of rotation for the metal-rich group was confirmed only at the 2 level, therefore the combination of a slightly higher precision and a much larger sample size are probably enough to explain why we were able to reveal such a signature with our dataset.
4. Conclusions
We presented the first results from the Ital-FLAMES survey of the RGB of Cen. Radial velocities with uncertainties of 0.5 km s-1 are derived for 650 radial velocity members of Cen, and are in very good agreement with previous literature measurements. The main result obtained is that all the three sub-populations of Cen show the same rotation pattern. These findings appear in contradiction with the results presented by Norris et al. (1997). We show that a combination of higher precision in the Vr measurements and of a larger sample size, especially for metal-rich stars (RGB-MInt and RGB-a), is the most likely cause for the discrepancy.
The results by Norris et al. (1997) were the main piece of evidence in support of a merger event in the past evolution of Cen. The evidence presented here suggests that there is no rotational anomaly in Centauri. The only other remaining evidence, apart from the radial velocity dispersion paradox mentioned above, that still points towards a complicated dynamical history is the structural difference among populations found by Pancino et al. (2003) and the somewhat debated differential proper motion for the RGB-a found by Ferraro et al. (2002), questioned by Platais et al. (2003) but supported by Hughes et al. (2004). Clearly, a deeper investigation into these aspects is now needed to finally settle the issue.
References
- Anderson (1997) Anderson, J., 1997, Ph.D. Thesis, Univ. California, Berkeley
- Bedin et al. (2004) Bedin, L. R., Piotto, G., Anderson, J., Cassisi, S., King, I. R., Momany, Y., & Carraro, G. 2004, ApJ, 605, L125
- Ferraro et al. (2002) Ferraro, F. R., Bellazzini, M., & Pancino, E. 2002, ApJ, 573, L95
- Ferraro et al. (2004) Ferraro, F. R., Sollima, A., Pancino, E., Bellazzini, M., Straniero, O., Origlia, L., & Cool, A. M. 2004, ApJ, 603, L81
- Ferraro et al. (2006) Ferraro, F. R., Sollima, A., Rood, R. T., Origlia, L., Pancino, E., & Bellazzini, M. 2006, ApJ, 638, 433
- Geyer et al. (1983) Geyer, E. H., Nelles, B., & Hopp, U. 1983, A&A, 125, 359
- Hilker & Richtler (2000) Hilker, M., & Richtler, T. 2000, A&A, 362, 895
- Hughes & Wallerstein (2000) Hughes, J., & Wallerstein, G. 2000, AJ, 119, 1225
- Hughes et al. (2004) Hughes, J., Wallerstein, G., van Leeuwen, F., & Hilker, M. 2004, AJ, 127, 980
- Jaquinet-Husson et al. (2003) Jaquinet-Husson, N., Scott, N. A., Chedin, A., & Chursin, A. A. 2003, Atmospheric and Oceanic Optics. 3, 256
- Kupka et al. (1999) Kupka, F., Piskunov, N., Ryabchikova, T. A., Stempels, H. C., & Weiss, W. W. 1999, A&AS, 138, 119
- Lee et al. (1999) Lee, Y.-W., Joo, J.-M., Sohn, Y.-J., Rey, S.-C., Lee, H.-C., & Walker, A. R. 1999, Nature, 402, 55
- Lupton (1993) Lupton, R. 1993, Princeton, N.J.: Princeton University Press, —c1993,
- Mackey & van den Bergh (2005) Mackey, A. D., & van den Bergh, S. 2005, MNRAS, 360, 631
- Mayor et al. (1997) Mayor, M., et al. 1997, AJ, 114, 1087
- Merritt et al. (1997) Merritt, D., Meylan, G., & Mayor, M. 1997, AJ, 114, 1074
- Meylan et al. (1995) Meylan, G., Mayor, M., Duquennoy, A., & Dubath, P. 1995, A&A, 303, 761
- Norris & Da Costa (1995) Norris, J. E., & Da Costa, G. S. 1995, ApJ, 447, 680
- Norris et al. (1996) Norris, J. E., Freeman, K. C., & Mighell, K. J. 1996, ApJ, 462, 241
- Norris et al. (1997) Norris, J. E., Freeman, K. C., Mayor, M., & Seitzer, P. 1997, ApJ, 487, L187
- Norris (2004) Norris, J. E. 2004, ApJ, 612, L25
- Pancino et al. (2000) Pancino, E., Ferraro, F. R., Bellazzini, M., Piotto, G., & Zoccali, M. 2000, ApJ, 534, L83
- Pancino et al. (2002) Pancino, E., Pasquini, L., Hill, V., Ferraro, F. R., & Bellazzini, M. 2002, ApJ, 568, L101
- Pancino et al. (2003) Pancino, E., Seleznev, A., Ferraro, F. R., Bellazzini, M., & Piotto, G. 2003, MNRAS, 345, 683
- Pancino (2003) Pancino, E. 2003, Ph.D. Thesis, Bologna University
- Pasquini et al. (2002) Pasquini, L. et al. 2002, The Messenger 110, 1
- Piotto et al. (2005) Piotto, G., et al. 2005, ApJ, 621, 777
- Platais et al. (2003) Platais, I., Wyse, R. F. G., Hebb, L., Lee, Y.-W., & Rey, S.-C. 2003, ApJ, 591, L127
- Reijns et al. (2006) Reijns, R. A., Seitzer, P., Arnold, R., Freeman, K. C., Ingerson, T., van den Bosch, R. C. E., van de Ven, G., & de Zeeuw, P. T. 2006, A&A, 445, 503
- Robin et al. (2003) Robin, A. C., Reylé, C., Derrière, S., & Picaud, S. 2003, A&A, 409, 523
- Smith et al. (2000) Smith, V. V., Suntzeff, N. B., Cunha, K., Gallino, R., Busso, M., Lambert, D. L., & Straniero, O. 2000, AJ, 119, 1239
- Sollima et al. (2005a) Sollima, A., Ferraro, F. R., Pancino, E., & Bellazzini, M. 2005a, MNRAS, 357, 265
- Sollima et al. (2005b) Sollima, A., Pancino, E., Ferraro, F. R., Bellazzini, M., Straniero, O., & Pasquini, L. 2005b, ApJ, 634, 332
- Suntzeff & Kraft (1996) Suntzeff, N. B., & Kraft, R. P. 1996, AJ, 111, 1913
- van de Ven et al. (2006) van de Ven, G., van den Bosch, R. C. E., Verolme, E. K., & de Zeeuw, P. T. 2006, A&A, 445, 513
- van den Bosch et al. (1999) van den Bosch, F. C., Lewis, G. F., Lake, G., & Stadel, J. 1999, ApJ, 515, 50
- van Leeuwen et al. (2000) van Leeuwen, F., Le Poole, R. S., Reijns, R. A., Freeman, K. C., & de Zeeuw, P. T. 2000, A&A, 360, 472