Why are accreting T Tauri stars observed to be less luminous in X-rays than non-accretors?
Abstract
Accreting T Tauri stars are observed to be less luminous in X-rays than non-accretors, an effect that has been detected in various star forming regions. To explain this we have combined, for the first time, a radiative transfer code with an accretion model that considers magnetic fields extrapolated from surface magnetograms obtained from Zeeman-Doppler imaging. Such fields consist of compact magnetic regions close to the stellar surface, with extended field lines interacting with the disc. We study the propagation of coronal X-rays through the magnetosphere and demonstrate that they are strongly absorbed by the dense gas in accretion columns. The reduction in the observed X-ray emission depends on the field geometry, which may explain why accreting T Tauri stars show a larger scatter in their observed X-ray luminosity compared to non-accreting stars.
keywords:
Stars: pre-main sequence – Stars: magnetic fields – Stars: coronae – Stars: activity – X-rays: stars1 Introduction
Accreting T Tauri stars are observed to be less luminous in X-rays than non-accretors (Stelzer & Neuhäuser 2001; Flaccomio et al. 2003a, c, 2006; Stassun et al. 2004; Preibisch et al. 2005; Telleschi et al. 2007a). Accreting stars appear to be a factor of less luminous, and show a larger variation in their X-ray activity compared to non-accreting stars (Preibisch et al., 2005). However, it is only in recent years that this result has become clear, with previous studies showing conflicting results (e.g. Feigelson et al. 2003 and Flaccomio et al. 2003b). The apparent discrepancy arose from whether stars were classified as accreting based on the detection of excess IR emission (a disc indicator) or the detection of accretion related emission lines. However, with careful re-analysis of archival data (Flaccomio et al., 2003a) and recent large X-ray surveys like the Chandra Orion Ultradeep Project (COUP; Getman et al. 2005) and the XMM-Newton Extended Survey of the Taurus Molecular Cloud (XEST; Güdel et al. 2007a) the result is now clear, namely that accreting T Tauri stars are observed to be, on average, less luminous in X-rays than non-accreting stars. Although the difference is small it has been found consistently in various star forming regions, namely Taurus-Aurigae (Stelzer & Neuhäuser 2001; Telleschi et al. 2007a), the ONC (Flaccomio et al. 2003c; Stassun et al. 2004; Preibisch et al. 2005), NGC 2264 (Flaccomio et al. 2003a, 2006) and Chamaeleon I (Flaccomio et al. 2003a).
It should be noted, however, that such observations from CCD detectors are not very sensitive to X-rays that are produced in accretion shocks. High resolution X-ray spectroscopic measurements have indicated emission from cool and high density plasma, most likely associated with accretion hot spots, in several (but not all) accreting stars (e.g. Telleschi et al. 2007b; Günther et al. 2007). In this letter we only consider coronal X-ray emission such as is detected by CCD measurements.
It is not yet understood why accreting stars are under luminous in X-rays, although a few ideas have been put forward. It may be related to higher extinction due to X-ray absorption by circumstellar discs, however the COUP results do not support this suggestion (Preibisch et al., 2005). It may be related to magnetic braking, whereby the interaction between the magnetic field of an accreting star with its disc slows the stellar rotation rate leading to a weaker dynamo action and therefore less X-ray emission; although the lack of any rotation-activity relation for T Tauri stars has ruled out this idea (Flaccomio et al. 2003c; Preibisch et al. 2005; Briggs et al. 2007). A third suggestion is that accretion may alter the stellar structure affecting the magnetic field generation process and therefore X-ray emission (Preibisch et al., 2005). However, the most plausible suggestion is the attenuation of coronal X-rays by the dense gas in accretion columns (Flaccomio et al. 2003c; Stassun et al. 2004; Preibisch et al. 2005; Güdel et al. 2007b). X-rays from the underlying corona may not be able to heat the material within accretion columns to a high enough temperature to emit in X-rays. Field lines which have been mass-loaded with dense disc material may obscure the line-of-sight to the star at some rotation phases, reducing the observed X-ray emission. In this letter we demonstrate this in a quantitative way by developing an accretion flow model and simulating the propagation of coronal X-rays through the stellar magnetosphere.
2 Realistic Magnetic Fields
In order to model the coronae of T Tauri stars we need to assume something about the form of the magnetic field. Observations suggest it is compact and inhomogeneous and may vary not only with time on each star, but also from one star to the next. To capture this behaviour, we use as examples the field structures of two different main sequence stars, LQ Hya and AB Dor determined from Zeeman-Doppler imaging (Donati et al., 2003). Although we cannot be certain whether or not the magnetic field structures extrapolated from surface magnetograms of young main sequence stars do represent the magnetically confined coronae of T Tauri stars, they do satisfy the currently available observational constraints. In future it will be possible to use real T Tauri magnetograms derived from Zeeman-Doppler images obtained using the ESPaDOnS instrument at the Canada-France-Hawaii telescope (Donati et al., 2007). However, in the meantime, the example field geometries used in this letter (see Fig. 1) capture the essential features of T Tauri coronae. They reproduce X-ray emission measures (EMs) and coronal densities which are typical of T Tauri stars (Jardine et al., 2006). The surface field structures are complex, consistent with polarisation measurements (Valenti & Johns-Krull, 2004) and X-ray emitting plasma is confined within unevenly distributed magnetic structures close to the stellar surface, giving rise to significant rotational modulation of X-ray emission (Gregory et al., 2006b).
We extrapolate from surface magnetograms by assuming that the magnetic field is potential such that . This condition is satisfied by writing the field in terms of a scalar flux function , such that . Thus, in order to ensure that the field is divergence-free (), must satisfy Laplace’s equation, ; the solution of which is a linear combination of spherical harmonics,
| (1) |
where denote the associated Legendre functions. The coefficients and are determined from the radial field at the stellar surface obtained from Zeeman-Doppler maps and also by assuming that at some height above the surface (known as the source surface) the field becomes radial and hence , emulating the effect of the corona blowing open field lines to form a stellar wind (Altschuler & Newkirk, 1969). In order to extrapolate the field we used a modified version of a code originally developed by van Ballegooijen, Cartledge & Priest (1998).
2.1 The coronal field
For a given surface magnetogram we calculate the extent of the closed corona for a specified set of stellar parameters. As this process has been described in detail by Jardine et al. (2006) and Gregory et al. (2006a, b) we provide only a brief outline here. We assume that the corona is isothermal and that plasma along field line loops is in hydrostatic equilibrium. The pressure is calculated along the path of field lines loops and is set to zero for open field lines and for field lines where, at some point along the loop, the gas pressure exceeds the magnetic pressure. The pressure along a field line scales with the pressure at its foot point, and we assume that this scales with the magnetic pressure (). This technique has been used successfully to calculate mean coronal densities and X-ray EMs for the Sun and other main sequence stars (Jardine et al., 2002) as well as T Tauri stars (Jardine et al., 2006). The extent of the corona depends both on the value of and also on which is determined directly from surface magnetograms and varies across the stellar surface. Jardine et al. (2006) determined the best value of for a given surface magnetogram which results in the best fit to the X-ray EMs of stars from the COUP database. We have adopted the same values in this letter. We note that we make a conservative estimate of the location of the source surface by calculating the largest radial distance at which a dipole field line would remain closed, with the same average field strength. The AB Dor-like coronal field has an X-ray EM111The X-ray EM is given by where and are the coronal density and volume. The EM-weighted density is . of (without considering accretion) and a mean EM-weighted coronal density of , consistent with estimates from the modelling of individual flares (Favata et al., 2005). The LQ Hya-like field has a more extended corona and consequently a lower coronal density and EM, .
2.2 The accreting field
We consider a thin disc and assume that the disc normal is aligned with the stellar rotation axis. We consider a steady state flow model and assume that the structure of the magnetic field remains undistorted by the in-falling material and that the magnetosphere rotates as a solid body. Jardine et al. (2006) and Gregory et al. (2006a) demonstrated that for most stars the closed field region is confined close to the stellar surface. T Tauri stars have hot coronae, with temperatures in excess of several tens of mega-Kelvin [e.g. see the COUP database, Getman et al. (2005)]. Such high temperatures lead to closed field lines being opened by the gas pressure, limiting the closed field region to close to the stellar surface. In such cases the inner disc may sit in a reservoir of open field (Gregory et al., 2006a). This can be seen in Fig. 1 where the field lines that are carrying accreting gas are open. The question of where the disc is truncated remains a major problem for accretion models. It is still unknown if the disc is truncated in the vicinity of the corotation radius, the assumption of traditional accretion models (e.g. Königl 1991), or whether it extends closer to the stellar surface (e.g. Matt & Pudritz 2005). For this letter we consider that accretion occurs over a range of radii within the corotation radius. This is equivalent to the approach taken previously by Hartmann, Hewett & Calvet (1994), Muzerolle, Calvet & Hartmann (2001), Symington, Harries & Kurosawa (2005) and Azevedo et al. (2006) who have demonstrated that such an assumption reproduces observed spectral line profiles and variability. It should also be noted that the accreting field geometries which we consider here are only snap-shots in time, and in reality will evolve due to the interaction with the disc. The accretion filling factors are for the AB Dor-like field and for the LQ Hya-like field, smaller than would be expected for accretion to a dipole, but consistent with observationally inferred values (e.g. Valenti & Johns-Krull 2004).
We assume that material is supplied by the disc and accretes onto the star at a constant rate. For a dipolar magnetic field accretion occurs into two rings in opposite hemispheres centred on the poles. In this case, half of the mass supplied by the disc accretes into each hemisphere. For complex magnetic fields accretion occurs into discrete hotspots distributed in latitude and longitude (Gregory et al., 2006a). It is therefore not clear how much of the available mass from the disc accretes into each hot spot. We use a spherical grid and assume that each grid cell within the disc which is accreting supplies a mass accretion rate that is proportional to its surface area. For example, if an accreting grid cell has a surface area that is of the total area of all accreting grid cells, then this grid cell is assumed to carry of the total mass that is supplied by the disc. Therefore, as an example, if grid cells which constitute half of the total area of all accreting cells in the disc carry material into a single hotspot, then half of the mass accretion rate is carried from the disc to this hot spot. In this way the accretion rate into each hot spot is different and depends on the structure of the magnetic field connecting the star to the disc.
2.3 Accretion flow model
We consider a star of mass , radius , rotation period , a coronal temperature of and assume that the disc supplies a mass accretion rate of . In order to model the propagation of coronal X-rays through the magnetosphere we first need to determine the density of gas within accretion columns. Provided that the flow of accreting material is along the path of the field ( is parallel to ) then
| (2) |
where is the mass density (see e.g. Mestel 1968). If an individual accreting field line carries material onto an area of the stellar surface of with velocity and density , then the mass accretion rate into is,
| (3) |
It then follows from (2) and (3) that the density profile along the path of the field line may be written as,
| (4) |
The density profiles therefore do not depend on the absolute field strength, but instead on how the field strength varies with height above the star. The density profiles are typically steeper than those derived for accretion flows along dipolar field lines since the strength of a higher order field drops faster with height above the star (see Fig. 2). Gas is assumed to free-fall under gravity along the path of the field after leaving the disc with a small initial velocity of (Muzerolle et al., 2001). Accretion occurs from a range of radii as discussed in §2.2. For the AB Dor-like field accretion occurs from , whilst for the LQ Hya-like field, which is more extended, from .

In order to estimate the number density of gas within the accretion columns we require the temperature distribution along the path of the field lines. The temperature variation within the accretion columns of T Tauri stars is uncertain. The most comprehensive model is that of Martin (1996) who considers both heating and cooling processes. Here we elect to take the simplest approach and assume an isothermal accretion flow temperature of - a reasonable estimate for the temperature of accreting material (see e.g. Hartmann et al. 1994; Martin 1996). We obtain the number density profiles from,
| (5) |
where is the mass of a hydrogen atom and the dimensionless atomic weight. Fig. 2 shows the variation of the number density along the paths of a selection of accreting field lines, with those obtained for dipolar field lines shown for comparison. For our assumed accretion rate of the flow densities range from , whilst for a lower accretion rate of the range is .
3 Simulated X-Ray Variability
We extend our previous work on optically thin X-ray emission from the coronae of young stars (e.g. Jardine et al. 2002, 2006; Gregory et al. 2006b) to include the effects of absorption by the dense accretion columns. In this model we assume the X-ray emission from the 20 MK coronae is optically thin, but that the X-rays may be subsequently absorbed in the cool (7000 K) and hence optically thick accretion columns. For the X-ray absorptive opacity we adopt a value of , typical of neutral gas at temperatures below K at X-ray energies of a few keV (e.g. Krolik & Kallman 1984). At these energies the opacity of hot gas (above K) is several orders of magnitude lower (e.g. Krolik & Kallman 1984, Fig. 1) justifying our assumption that the 20 MK coronal X-ray emission is optically thin.
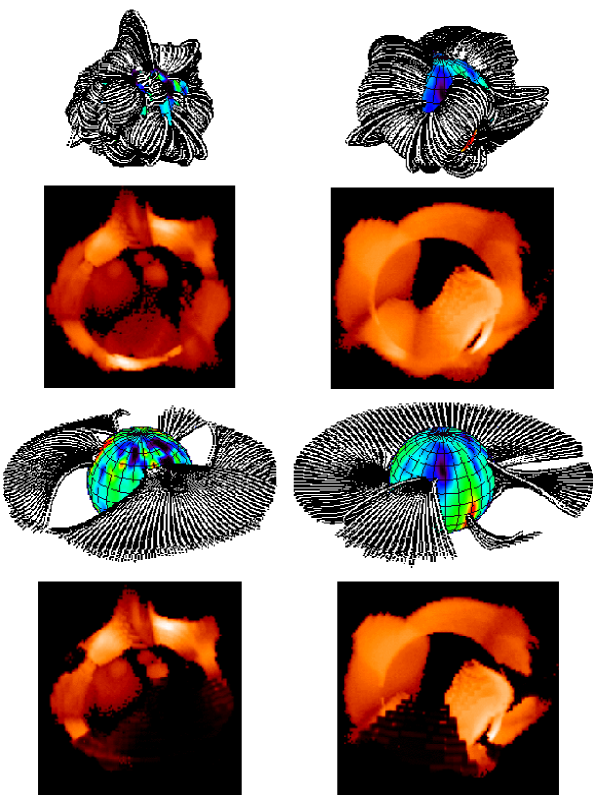
As in our previous work, for the radiation transfer we use Monte Carlo techniques and discretise the emissivity and density onto a spherical polar grid (e.g. Jardine et al. 2002; Whitney et al. 2003). In our simulations we adopt a stellar inclination of . For inclinations above the star and hence coronal emission, will be blocked by the vertically extended (i.e. flared) discs typical of T Tauri stars (e.g. D’Alessio et al. 1998; Wood et al. 2002). Because we are focusing on inclinations where the star is not blocked by the disc, our simulations only require our emissivity and density grid to include the accretion columns and therefore our grid extends to the inner edge of the disc. In the Monte Carlo X-ray radiation transfer simulations we assume the scattering opacity is negligible, so our results in Fig. 1 show the effects of attenuation of the coronal emission by the accretion columns. The second row in Fig. 1 shows the X-ray images in the absence of attenuation (i.e. X-ray opacity in the accretion columns is set to zero) whilst the fourth row shows the same X-ray emission models, but with our adopted value for the soft X-ray opacity in the accretion columns.
For the AB Dor-like field structure the observed X-ray EM is reduced by a factor of 1.4 when accretion flows are considered, whereas for the LQ Hya-like field the reduction is by a factor of 2.0 (where the reduction factor is the average for an entire rotation cycle). For the AB Dor-like field there are large accretion curtains which cross the observers line-of-sight to the star as it rotates (see Fig. 1). For the LQ Hya-like field accretion is predominantly along field lines which carry material into low latitude hot spots, however, one of the brightest X-ray emitting regions is obscured by an accretion column which attenuates the coronal X-rays and produces a large reduction in the observed X-ray emission. This immediately suggests that the geometry of the accreting field is a contributory factor in causing the large scatter seen in the X-ray luminosities of accreting stars.
4 Conclusions
We have demonstrated that the suppression of X-ray emission in accreting stars apparent from CCD observations can, at least in part, be explained by the attenuation of coronal X-rays by the dense material in accretion columns. The reduction in the observed X-ray emission depends on the structure of the accreting field. For stars where accretion columns rotate across the line-of-sight, X-rays from the underlying corona are strongly absorbed by the accreting gas which reduces the observed X-ray emission. This however does not rule out the fact that other mechanisms may also be responsible for reducing the X-ray emission in accreting stars. Jardine et al. (2006) have demonstrated that some stars (typically those of lower mass) have their outer coronae stripped away via the interaction with a disc. This also reduces the observed X-ray emission and this effect, combined with the radiative transfer calculations presented in this letter, is likely to lead to a larger reduction in the observed X-ray emission. This would reduce the number of field lines which could be filled with coronal gas, such as is also suggested by Preibisch et al. (2005) and Telleschi et al. (2007a), with the observed X-ray emission being further reduced due to obscuration by the accreting gas. A subsequent paper will give a detailed analysis of both of these effects drawing on X-ray data from the COUP and XEST.
Acknowledgements
The authors thank the referee for positive comments and Ad van Ballegooijen who wrote the original version of the potential field extrapolation code.
References
- Altschuler & Newkirk (1969) Altschuler M. D., Newkirk G., 1969, SoPh, 9, 131
- Azevedo et al. (2006) Azevedo R., Calvet N., Hartmann L., Folha D. F. M., Gameiro F., Muzerolle J., 2006, A&A, 456, 225
- Briggs et al. (2007) Briggs K. R. et al., 2007, A&A, in press (astro-ph/0701422)
- D’Alessio et al. (1998) D’Alessio P., Canto J., Calvet N., Lizano S., 1998, ApJ, 500, 411
- Donati et al. (2003) Donati J.-F. et al., 2003, MNRAS, 345, 1145
- Donati et al. (2007) Donati J.-F. et al., 2007, Proceedings of the 14th Meeting on Cool Stars, Stellar Systems and the Sun, in press (astro-ph/0702159)
- Favata et al. (2005) Favata F., Flaccomio E., Reale F., Micela G., Sciortino S., Shang H., Stassun K. G., Feigelson E. D., 2005, ApJS, 160, 469
- Feigelson et al. (2003) Feigelson E. D., Gaffney III J. A., Garmire G., Hillenbrand L. A., Townsley L., 2003, ApJ, 584, 911
- Flaccomio et al. (2003b) Flaccomio E., Damiani F., Micela G., Sciortino S., Harnden Jr. F. R., Murray S. S., Wolk S. J., 2003b, ApJ, 582, 382
- Flaccomio et al. (2003c) Flaccomio E., Damiani F., Micela G., Sciortino S., Harnden Jr. F. R., Murray S. S., Wolk S. J., 2003c, ApJ, 582, 398
- Flaccomio et al. (2003a) Flaccomio E., Micela G., Sciortino S., 2003a, A&A, 397, 611
- Flaccomio et al. (2006) Flaccomio E., Micela G., Sciortino S., 2006, A&A, 455, 903
- Getman et al. (2005) Getman K. V. et al., 2005, ApJS, 160, 319
- Gregory et al. (2006b) Gregory S. G., Jardine M., Cameron A. C., Donati J.-F., 2006b, MNRAS, 373, 827
- Gregory et al. (2006a) Gregory S. G., Jardine M., Simpson I., Donati J.-F., 2006a, MNRAS, 371, 999
- Güdel et al. (2007a) Güdel M. et al., 2007a, A&A, in press (astro-ph/0609160)
- Güdel et al. (2007b) Güdel M., Telleschi A., Audard M., Skinner S. L., Briggs K. R., Palla F., Dougados C., 2007b, A&A, in press (astro-ph/0609182)
- Günther et al. (2007) Günther H. M., Schmitt J. H. M. M., Robrade J., Liefke C., 2007, A&A, in press (astro-ph/0702579)
- Hartmann et al. (1994) Hartmann L., Hewett R., Calvet N., 1994, ApJ, 426, 669
- Jardine et al. (2006) Jardine M., Cameron A. C., Donati J.-F., Gregory S. G., Wood K., 2006, MNRAS, 367, 917
- Jardine et al. (2002) Jardine M., Wood K., Collier Cameron A., Donati J.-F., Mackay D. H., 2002, MNRAS, 336, 1364
- Königl (1991) Königl A., 1991, ApJL, 370, L39
- Krolik & Kallman (1984) Krolik J. H., Kallman T. R., 1984, ApJ, 286, 366
- Martin (1996) Martin S. C., 1996, ApJ, 470, 537
- Matt & Pudritz (2005) Matt S., Pudritz R. E., 2005, MNRAS, 356, 167
- Mestel (1968) Mestel L., 1968, MNRAS, 138, 359
- Muzerolle et al. (2001) Muzerolle J., Calvet N., Hartmann L., 2001, ApJ, 550, 944
- Preibisch et al. (2005) Preibisch T. et al., 2005, ApJS, 160, 401
- Stassun et al. (2004) Stassun K. G., Ardila D. R., Barsony M., Basri G., Mathieu R. D., 2004, AJ, 127, 3537
- Stelzer & Neuhäuser (2001) Stelzer B., Neuhäuser R., 2001, A&A, 377, 538
- Symington et al. (2005) Symington N. H., Harries T. J., Kurosawa R., 2005, MNRAS, 356, 1489
- Telleschi et al. (2007a) Telleschi A., Güdel M., Briggs K. R., Audard M., Palla F., 2007a, A&A, in press (astro-ph/0612338)
- Telleschi et al. (2007b) Telleschi A., Güdel M., Briggs K. R., Audard M., Scelsi L., 2007b, A&A, in press (astro-ph/0611024)
- Valenti & Johns-Krull (2004) Valenti J. A., Johns-Krull C. M., 2004, Ap&SS, 292, 619
- van Ballegooijen et al. (1998) van Ballegooijen A. A., Cartledge N. P., Priest E. R., 1998, ApJ, 501, 866
- Whitney et al. (2003) Whitney B. A., Wood K., Bjorkman J. E., Wolff M. J., 2003, ApJ, 591, 1049
- Wood et al. (2002) Wood K., Lada C. J., Bjorkman J. E., Kenyon S. J., Whitney B., Wolff M. J., 2002, ApJ, 567, 1183