La Laguna, Sta. Cruz de Tenerife, SPAIN. angelrls@iac.es, cel@iac.es
Interactions and star formation activity
in Wolf-Rayet galaxies
Abstract
We present the main results of the PhD Thesis carried out by López-Sánchez (2006) LS06 , in which a detailed morphological, photometrical and spectroscopical analysis of a sample of 20 Wolf-Rayet (WR) galaxies was realized. The main aims are the study of the star formation and O and WR stellar populations in these galaxies and the role that interactions between low surface companion objects have in the triggering of the bursts. We analyze the morphology, stellar populations, physical conditions, chemical abundances and kinematics of the ionized gas, as well as the star-formation activity of each system.
1 Introduction
WR galaxies are a subtype of H ii galaxies whose integrated spectra show broad emission lines attributed to WR stars, indicating the presence of an important population of massive stars and the youth of the starburst. Studying a sample of WR galaxies, Mendez99 and ME00 suggested that interactions with or between dwarf objects could be the main star formation triggering mechanism in dwarf galaxies and noted that the interacting and/or merging nature of WR galaxies can be detected only when deep and high-resolution images and spectra are available. Subsequent works (i.e., IPV01 ; VM01 ; VM02 ; Tran03 ) also found a relation between massive star formation and the presence of interaction signatures in this kind of galaxies. Therefore, we have performed a detailed analysis of a sample of 20 of these objects extracted from the latest catalogue of WR galaxies SCP99 combining deep optical and near-infrared (NIR) broad band and H imaging together with optical spectroscopy (long slit and echelle) data. Additional X-ray, far-infrared and radio data were compiled from literature.
2 Optical and NIR imaging
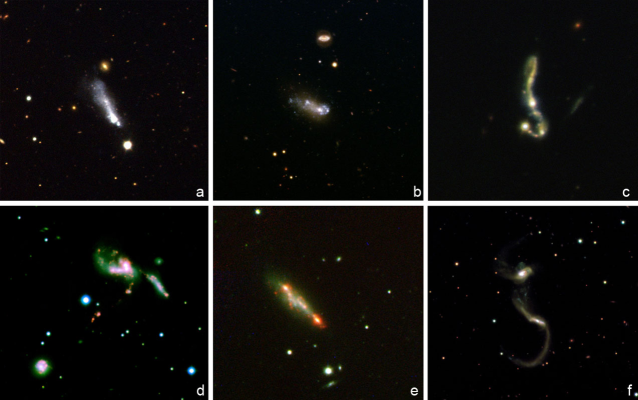
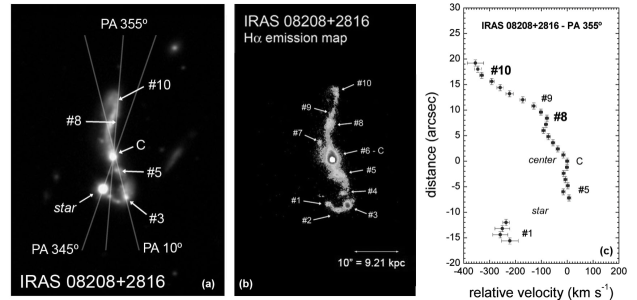
Deep and high spatial resolution imagery in optical and NIR broad band filters have been used to study the morphology of the stellar component of the galaxies, looking for morphological features that reveal interaction processes with external galaxies or low surface brightness objects. Optical imagery was mainly obtained with ALFOSC instrument at 2.56m NOT, but also CAFOS at 2.2m CAHA and WFC and 2.5m INT were used. In Figure 1 we show false color images of 6 galaxies of our sample. The quality of the data has allowed to detect faint features surrounding the galaxies, including tails (i.e, IRAS 08208+2816 and Arp 252, see Figure 1), independent dwarf galaxies (i.e., Mkn 1087 LSER04b ), mergers (i.e. HCG 31 LSER04a ) and candidate to tidal dwarf galaxies (TDGs) and arcs (i.e., IRAS 08339+6517, LSEGR06 ).
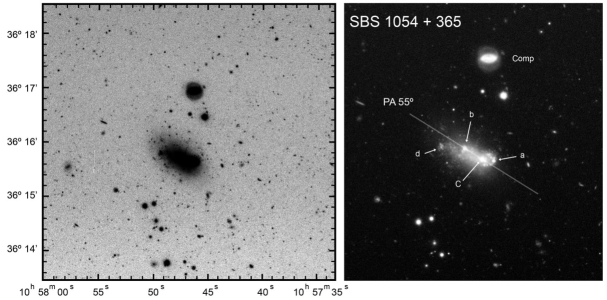
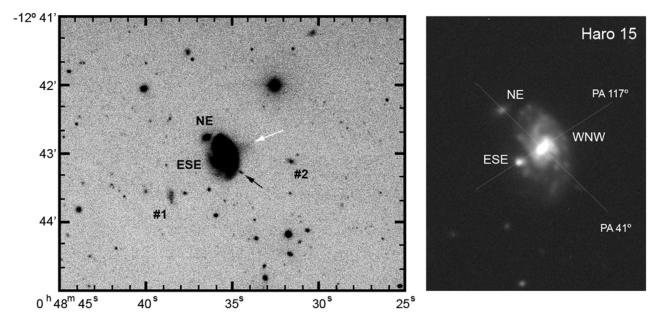
Figures 2, 3, 5a and 6 show some examples of our morphological analysis: the blue compact dwarf galaxy (BCDG) SBS 1054+365 (Figure 2), the blue compact galaxy (BCG) Haro 15 LSE03 (Figure 3; this image reveals that Haro 15 is in interaction with two nearby objects labeled as ESE and NE), the infrared luminous galaxy IRAS 08208+2818 (Figure 5) and Tol 9 (Figure 6). The photometric analysis of the galaxies and the use of population synthesis models (i.e. STARBURTS99 L99 ; PEGASE.2, PEGASE97 ) has permitted to analyze their colors, stellar populations (young, intermediate and old) and the age of the last star-forming burst.
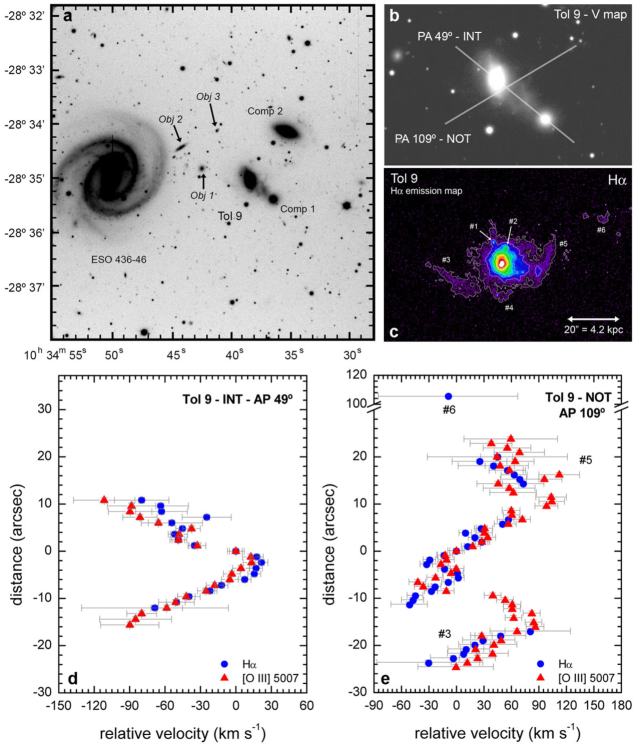
An interesting object is the WR galaxy Tol 9 within the Klemola 13 group, located a 43.3 Mpc. Our false color image of Tol 9 is shown in Figure 4: several independent objects are found in its neighbourhood, being the more important the nearby spiral galaxy ESO 436-46 (at 96” 20.2 kpc). The images also reveal a bridge from Tol 9 towards a dwarf companion object located 10 kpc at SW, indicating probable interaction phenomena between both galaxies. No ionized gas is detected in the bridge, indeed, the analysis of its optical and NIR colors suggests that it is mainly dominated by a relatively old stellar population with ages higher than 500 Myr.
3 H imaging
Deep continuum-subtracted H images have been used to know the distribution and intensity of the ionized gas throughout the galaxies, see Figure 1 d (HCG 31) & e (SBS 1319+579), Figure 4 (Tol 9), Figure 5b (IRAS 08208+2816) and Figure 6c (Tol 9) as examples. The data have been also used to estimate the H luminosity, the number of ionizing stars, the mass of the ionized gas and the star formation rate (SFR) of each burst. The SFR derived from H data is compared with that obtained using other methods.
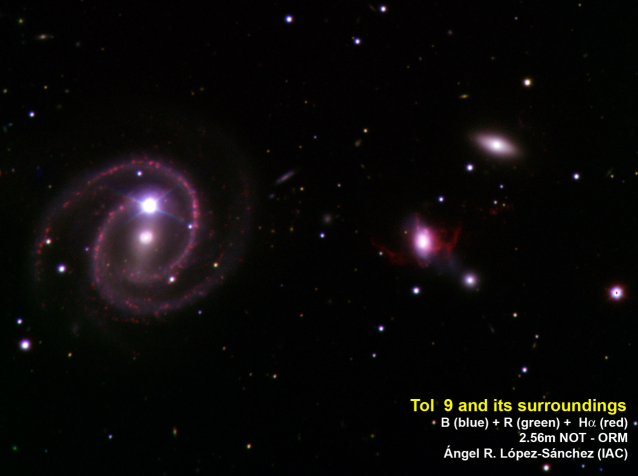
As we see in Figures 4 and 6c, the continuum-subtracted H emission map of Tol 9 reveals a kind of filamentary structure that is more extended than that seen in broad-band filters, suggesting that an outflow of material or a galactic wind exists in the starburst. The total H luminosity of this galaxy indicates a total ionized mass of = (3.4 0.2) 106 and a star formation rate of = 1.82 0.13 a-1.
4 Intermediate resolution spectra
Long slit and echelle (only for NGC 5253, see LSEGRPR07 and §7) spectroscopy have been used to study the physical conditions (electron density and temperature, reddening, ionization nature), the chemistry of the gas (chemical abundances of He, O, N, S, Ne, Ar, Fe, Cl) and the kinematics of the ionized gas, as well as the massive star population content and its spatial location in each galaxy. The metallicity of each galaxy has be estimated by the direct method (assuming that electron temperature is known) and by the so-called empirical calibrations.
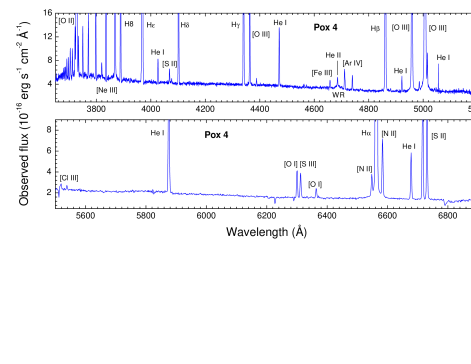
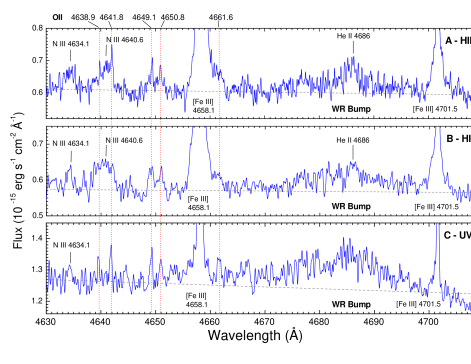
In Figure 7 we show our deep spectrum of the BCDG POX 4, showing the emission features that reveal the presence of WR stars (the so-called WR bump and the He ii emission line at 4686). Our study also led to disentangle the tidal/pre-existing nature of the companion objects surrounding the main galaxies. For example, the oxygen abundance of object NE in Mkn 1199 is 12+log(O/H)=8.46, whereas its center has 8.75, confirming that NE is an external galaxy in interaction with it. This interaction triggers star-formation activity in the external zone of Mkn 1199.
The kinematics of the ionized gas was studied via the analysis of emission line profiles using the 2D spectra. In objects in which solid-body rotation is found, the Keplerian mass have been estimated. Sometimes, prominent tidal tails (i.e. HCG 31 LSER04a , Mkn 1087 LSER04b and the evident case of IRAS 08208+2816, see Figure 5) or outflows (Tol 9) have been detected. Indeed, the position-velocity diagram of Tol 9 using the NOT data (AP 109∘; see Figure 6e) reveals a velocity pattern that can not be attributed to rotation; our analysis suggests that it could be explained considering a bipolar bubble expanding at about 80 km s-1.
5 Interactions and star formation in galaxy groups
Specially interesting are the cases of the groups of galaxies HCG 31 LSER04a and Mkn 1087 LSER04b , where interactions involving more than two objects are needed to explain the tails, bridges, mergers and tidal dwarf galaxies (TDGs) observed in them. We find that member F in HCG 31 hosts the youngest starburst of the group (2.5 Myr), showing a substantial population of WR stars and, like member E, seems to be a TDG formed from material stripped from the brightest galaxy of the group.
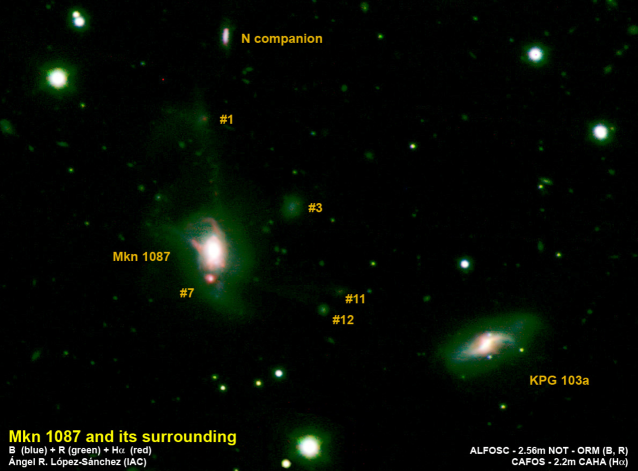
On the contrary, one nearby dwarf companion object located at the north of Mkn 1087 (see Figure 8) is not a TDG but an independent dwarf galaxy that is in interaction with it. A nearby encounter between them created a long tidal tail. However, other surrounding objects seem to be TDGs (objects #1, #3, #11 and #12 in Figure 8) Mkn 1087 can be classified as a low-z Luminous Compact Blue Galaxy (LCBG), rare objects in the local Universe but common at high redshift. LCBGs are especially interesting for studies of galaxies evolution and formation because they could be the equivalent of the high-z Lyman-break galaxies in the local universe EP03 .
6 Star formation and stellar populations
in IRAS 08339+6517
An excellent example of the analysis we have performed for each system is found in our detailed study of the star formation activity and stellar populations in the bright starburst galaxy IRAS 08339+6517 LSEGR06 . All data (broad and narrow-band imagery and spectra) were obtained using ALFOSC at NOT. Our new deep images reveal interactions features between IRAS 08339+6517 and a nearby dwarf object, as well as strong H emission in its inner part. The chemical composition of the ionized gas of both galaxies is rather similar. Our deep spectra seem to show, for the first time, WR features in the center of IRAS 08339+6517. The kinematics also indicates interaction features and reveals an object that could be a candidate tidal dwarf galaxy or a remnant of an earlier merger. Our data suggest that a prominent H i tidal tail found by CSK04 has been mainly formed from material stripped from the main galaxy.
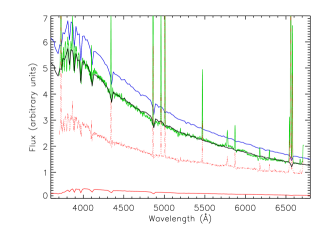
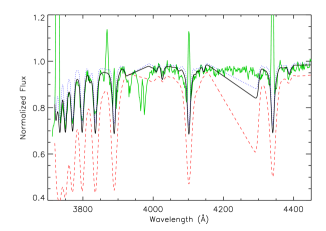
We estimate that the age of the most recent burst is around 4 – 6 Ma, but a more evolved underlying stellar population, with a minimal age between 100 – 200 Ma, is also detected and fits an exponential intensity profile. A model which combines 85% young and 15% old populations can explain both the spectral energy distribution (see Figure 9, up) and the H i Balmer and He i absorption lines (see Figure 9, down) observed in our spectrum. We finally conclude that IRAS 08339+6517 does satisfy the criteria of Luminous Compact Blue Galaxy (LCBG), rare objects in the local Universe but common at high redshift. There are very few local LCBGs nowadays detected but nearly half of them have optical companions, present disturbed morphologies and/or are clearly interacting GPW04 . If interactions were the responsible of the activity in LCBGs, it would indicate that they were perhaps more common at high redshifts, as the hierarchical galaxies formation models predict (i.e., KW93 ; Springel05 ). This fact would also support the idea that interaction with dwarf companion objects could be an important trigger mechanism of the star formation activity in local starbursts.
7 The localized chemical pollution in NGC 5253
One of our main goals is the detection of the weak O ii and C ii recombination lines in our deep VLT spectra of the dwarf galaxy NGC 5253, the first time reported in a starburst (see Figure 10 and LSEGRPR07 ). The ionic abundances derived from the recombination lines are from 0.20 to 0.40 dex higher than those calculed from collision excited lines, in agreement with the result found in other Galactic and extragalactic H ii regions. This conclusion suggests that temperature fluctuations may be present in the ionized gas of this galaxy. Furthermore, we detect a localized nitrogen enrichment in two of the central starburst of the galaxy, an well as a possible slight helium pollution in the same zones. The enrichment pattern completely agrees with that expected by the pollution of the winds of massive stars in the WR phase. The amount of enriched material needed to produce the observed overabundance is consistent with the mass lost by the number of WR stars estimated in the starbursts.
8 Global properties
Finally, we have performed a global analysis of our sample of 20 Wolf-Rayet galaxies. It is the more complete and exhaustive data set of this kind of galaxies, involving multiwavelength results and being every one analyzed following the same procedures. The main global results are the following:
-
1.
The analysis of WR features in our sample suggests that aperture effects and localization of the bursts with WR stars seem to play a fundamental role in the detection of this sort of massive stars in starburst galaxies.
-
2.
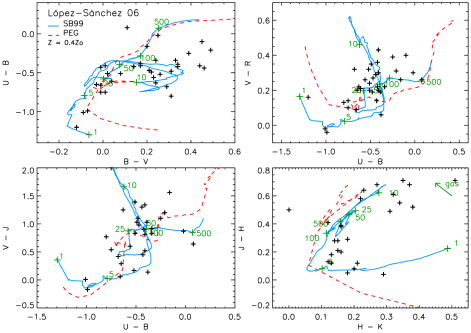
Photometric data have been corrected for both extinction and nebular emission using our spectroscopic values. As we see in Figure 11, a good agreement between our optical and NIR colors and theoretical models is found; small discrepancies are explained by the existence of several (young and older) stellar populations.
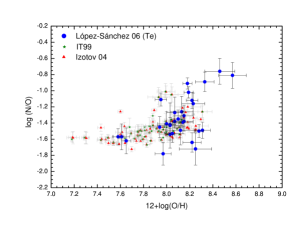
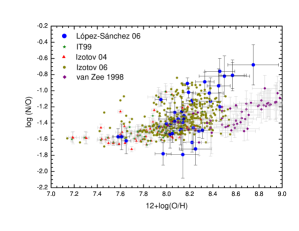
Figure 12: N/O vs. O/H diagram comparing the data obtained for our sample with previous analysis of BCDGs. (Top) Blue circles: Data with direct estimation of electron temperature. Green stars: Data presented by Izotov & Thuan (1999) IT99 . Red triangles: Izotov et al. (2004) IPG04 data. (Down) Blue circles: all data obtained for our galaxy sample using both direct and empirical methods. Yellow stars: Izotov et al. (2006) ISMGT06 data. Purple rhombuses: van Zee et al. (1998) vZee98 data. Green stars and red triangles as the same that before. -
3.
Physical and chemical properties are in agreement with both previous observations and models of chemical evolution of galaxies (see Figure 12). We have compared abundances obtained by the direct method with those obtained for several empirical calibrations: Pilyugin (2001a,b) P01a ; P01b seems to give similar results whereas calibrations based in photoionization models such as McGaugh (1994) M94 and Kewley & Dopita (2002) KD02 give abundances higher (0.20 dex) than expected.
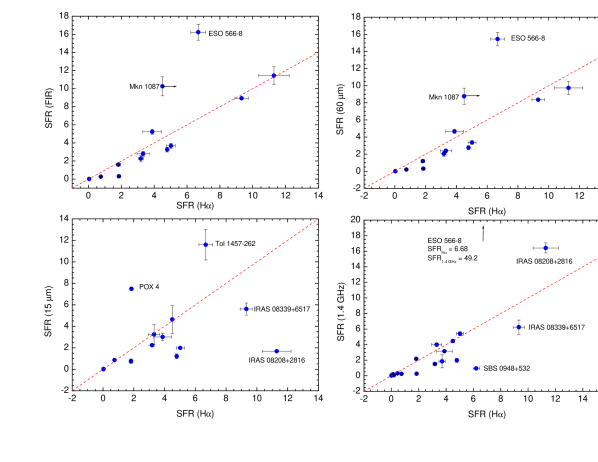
Figure 13: Comparison between the SFR determined using our H flux (corrected by both extinction and [N II] emission, abscissa axis) with those obtained using far-infrared (FIR), 15 m, 60 m and 1.4 GHz radio-continuum luminosities. The H flux for Mkn 1087 is a lower limit. The galaxy ESO 566-8 seems to have some kind of radio-activity. Dotted lines indicate equal values for the SFR. -
4.
The comparison of the SFR derived from our H data (corrected by both extinction and [N II] emission using our spectroscopic data) is in good agreement with the SFR obtained using multiwavelength relations (see Figure 13). We have also derived an X-ray based SFR for this kind of starburst galaxies.
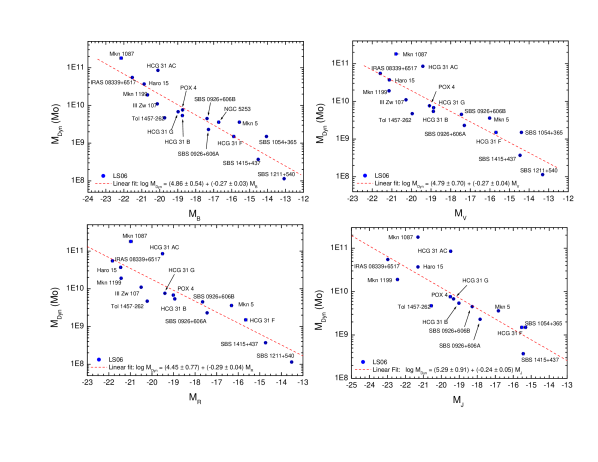
Figure 14: Dynamical mass vs. absolute magnitude in , , and for the individual galaxies analyzed in this work. A linear fit is also shown in each case. -
5.
We have determine the ionized gas mass (, using our H images), neutral gas mass (, using 21 cm H I data from the literature), mass of the ionizing stellar cluster (), warm dust mass (, using FIR fluxes), Keplerian mass (, using the kinematics of the ionized gas) and the dynamical mass (, considering the kinematics of the neutral gas). As it expected, all mass values increase with the luminosity of the galaxy (Figure 14). Furthermore, we find a good correlation between and the luminosity (absolute magnitude in , , and filters) of the galaxy. We also find a good relation between the reddening coefficient derived from the Balmer decrement, (H), and , as we see in Figure 15. This fact suggests that extinction is mainly produced within the starburst.
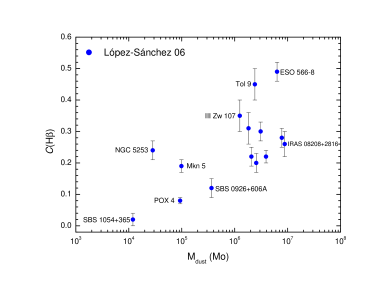
Figure 15: Reddening coefficient, (H), vs. warm dust mass, , for all our galaxies for which both quantities are available.
9 Conclusions
Our multiwavelength study has allowed to achieve a global vision of the star formation activity and evolution of each system, but also have permitted to find general results involving all the galaxy sample. The main conclusion is that the majority of studied galaxies (16 up to 20, 80% of the objects) show clear interaction features such as plumes, tails, TDGs, regions with very different chemical abundances inside galaxies, perturbed kinematics of the ionized gas or lack of neutral hydrogen gas, confirming the hypothesis that interaction with or between dwarf objects triggers the star formation activity in Wolf-Rayet galaxies.
10 Acknowledgements
Á.R. L-S thanks César Esteban (his PhD supervisor) for all the help and very valuable explanations, talks and discussions during all last 5 years. He also acknowledges Jorge García-Rojas and Sergio Simón-Díaz for their help and friendship. He extends this acknowledge to all people at Instituto de Astrofísica de Canarias (IAC, Spain). Á.R. L-S. deeply thanks to Universidad de La Laguna (Spain) for force him to translate the PhD thesis from English to Spanish; nowadays he is translating from Spanish to English in order to publish his research.
References
- (1) J.M. Cannon, E.D. Skillman, D. Kunth, C. Leitherer, M. Mas-Hesse, M. Östlin & A. Petrosian: ApJ, 608, 768 (2004)
- (2) D.K. Erb, A.E. Shapley, C.C. Steidel, M. Pettini, et al.: ApJ, 591, 101 (2003)
- (3) M. Fioc & B. Rocca-Volmerange: A&A, 326, 950 (1997)
- (4) C.A. Garland, D.J. Pisano, J.P. Williams, R. Guzmán & F.J. Castander: ApJ, 615, 689 (2004)
- (5) R.M. González-Delgado, C. Leitherer. & T. Heckman: ApJS, 125, 489 (1999)
- (6) J. Iglesias-Páramo & J.M. Vílchez: ApJ, 550, 211 (2001)
- (7) Y.I. Izotov & T.X. Thuan: ApJ, 511, 639 (1999)
- (8) Y.I. Izotov, P. Papaderos, N.G. Guseva, K.J. Fricke & T.X. Thuan: A&A, 421, 539 (2004)
- (9) Y.I. Izotov, G. Stasińska, G. Meynet, N.G. Guseva & T.X. Thuan: A&A, 448, 955 (2006)
- (10) G. Kauffman & S.D.M. White: MNRAS, 261, 921 (1993)
- (11) L.J. Kewley & M.A. Dopita: ApJS, 142, 35 (2002)
- (12) C. Leitherer, D. Schaerer, J.D. Goldader, R.M. González-Delgado, C. Robert, D.F. Kune, D.F. de Mello, D. Devost & T.M. Heckman: ApJS, 123, 3 (1999)
- (13) Á.R. López-Sánchez: Massive star formation in dwarf Wolf-Rayet galaxies. PhD Thesis, La Laguna University, Tenerife, Spain (2006)
- (14) Á.R. López-Sánchez & C. Esteban: Rev. Mex. Astron. Astrofis. Conf. Ser., 18, 48 (2003)
- (15) Á.R. López-Sánchez, C. Esteban & M. Rodríguez: ApJS, 153, 243 (2004a)
- (16) Á.R. López-Sánchez, C. Esteban & M. Rodríguez: A&A, 428, 445 (2004b)
- (17) Á.R. López-Sánchez, C. Esteban & J. García-Rojas: A&A, 449, 997 (2006)
- (18) Á.R. López-Sánchez, C. Esteban, J. García-Rojas, M. Peimbert & M. Rodríguez: ApJ, 656, 168 (2007)
- (19) S.S. McGaugh: ApJ, 426, 135 (1994)
- (20) D.I. Méndez: Gas ionizado y formación estelar en galaxias Wolf-Rayet. PhD Thesis, La Laguna University, Tenerife, Spain (1999)
- (21) D.I. Méndez & C. Esteban: A&A, 359, 493 (2000)
- (22) L.S. Pilyugin: A&A, 369, 594 (2001a)
- (23) L.S. Pilyugin: A&A, 374, 412 (2001b)
- (24) D. Schaerer, T. Contini, & M. Pindao: A&AS 136, 35 (1999)
- (25) V. Springel, S. White et al.: Nature, 435, 629 (2005)
- (26) H.D. Tran et al.: ApJ 585, 750 (2003)
- (27) L. Verdes-Montenegro, M.S. Yun, B.A. Williams, W.K. Huchtmeier, A. del Olmo & J. Perea: A&A, 377, 812 (2001)
- (28) L. Verdes-Montenegro, A. del Olmo, J.I. Iglesias-Páramo, J. Perea, J., J.M. Vílchez, M.S. Yun & W.K. Huchtmeier: A&A, 396, 815 (2002)
- (29) L. van Zee, J.J. Salzer & M.P. Haynes: ApJ, 497, 1 (1998)
Index
- Ángel R. López-Sánchez Interactions and star formation activity in Wolf-Rayet galaxies
- César Esteban Interactions and star formation activity in Wolf-Rayet galaxies
- Jorge García-Rojas Interactions and star formation activity in Wolf-Rayet galaxies