The 3D soft X-ray cluster-AGN cross-correlation function in the ROSAT NEP survey
Abstract
X-ray surveys facilitate investigations of the environment of AGNs. Deep Chandra observations revealed that the AGNs source surface density rises near clusters of galaxies. The natural extension of these works is the measurement of spatial clustering of AGNs around clusters and the investigation of relative biasing between active galactic nuclei and galaxies near clusters.The major aims of this work are to obtain a measurement of the correlation length of AGNs around clusters and a measure of the averaged clustering properties of a complete sample of AGNs in dense environments. We present the first measurement of the soft X-ray cluster-AGN cross-correlation function in redshift space using the data of the ROSAT-NEP survey. The survey covers deg2 around the North Ecliptic Pole where 442 X-ray sources were detected and almost completely spectroscopically identified. We detected a 3 significant clustering signal on scales 50 Mpc. We performed a classical maximum-likelihood power-law fit to the data and obtained a correlation length =8.7 Mpc and a slope =1.7 ( 1 errors). This is a strong evidence that AGNs are good tracers of the large scale structure of the Universe. Our data were compared to the results obtained by cross-correlating X-ray clusters and galaxies. We observe, with a large uncertainty, that the bias factor of AGN is similar to that of galaxies.
1. Introduction
In the present paper, we concentrate on the study of the relative clustering between X-ray selected AGNs and galaxy clusters. Our work improves on most previous work on the large-scale structure of X-ray selected AGNs in two important aspects. First, with the exception of Mullis et al. (2004), our sample is the only one that is spectroscopically complete (99.6%). Gilli et al. (2005) used the CDFS (35%) and the CDFN (50%). The Basilakos et al. (2005) sample had almost no spectroscopic redshifts. Yang et al. (2006) used the CLASXS sample (52% complete) and the CDFN (56% complete). Second, with the exception of Mullis et al. (2004) and part of Yang et al. (2006), we measure a three dimensional redshift space correlation function as opposed to deprojecting the two dimensional angular correlation function.
Another motivation for our work is that over the last several years, X-ray observations revealed that a significant fraction of high- clusters of galaxies show overdensities of AGNs in their outskirts (i.e. between 3 Mpc and 7 Mpc from the center of the cluster) (Henry et al., 1991; Cappi et al., 2001; Ruderman & Ebeling 2005, Cappelluti et al., 2005, and references therein). These overdensities were however detected in randomly selected archive targeted observations of galaxy clusters. While these overdensities are highly significant (up to 8) when compared to cluster-free fields, the incompleteness of the samples does not allow drawing any conclusion about the average clustering properties of AGNs around clusters. The majority of the sources making these overdensities have no spectroscopical identification and therefore any information on their spatial clustering is lost. More recently Branchesi et al. (2007) showed that at high- the source surface density of AGNs significantly increases even in the central regions of the clusters. These results imply that further progress will come from studying the three dimensional spatial distribution of AGNs around clusters. A natural way to characterize this specific type of clustering is given by the three-dimensional cross-correlation of AGNs and galaxy clusters, the computation of which needs complete redshift information for all objects, which is rare in X-ray surveys.
2. The Cluster AGN cross-correlation function
The cross-correlation function of clusters and AGNs is defined by the joint probability to find, at a distance , one cluster in the infinitesimal comoving volume element and one AGN in the comoving volume element , , where and are the mean comoving number densities of clusters and AGNs, respectively. In calculating the differential cross-correlation in redshift space we used an adapted version of the Landy–Szalay estimator (Landy & Szalay, 1993; see also e.g. Blake et al., 2006).
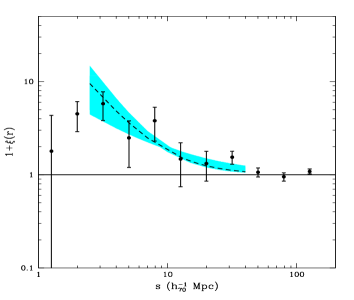

We present the spatial cross-correlation function between clusters and AGNs in left panel of Fig. 1. A positive clustering signal is detected in the distance interval 50 Mpc. In order to test the strength of the clustering we performed a canonical power-law fit, , with and as free parameters. The best fit parameters obtained are =8.7 Mpc and =1.7 where the uncertainty is at the 1 confidence level. With fixed to 1.8 (i.e. a typical value found in galaxy-galaxy correlation function) we find Mpc. A similar value was obtained by extending the fitting region to 60 Mpc and restricting it to the 2.5–40 Mpc.
3. Discussion
We presented here the first direct evidence of spatial clustering of soft X-ray
selected AGNs around X-ray selected clusters of galaxies. Indirect evidence
was presented by Henry et al. (1991), Cappi et al. (2001),
Cappelluti et al. (2005) (and references therein). These authors found
significant X-ray point source overdensities (about a factor 2) around distant
clusters of galaxies when compared to cluster-free fields. If the
overdensities were at the cluster redshift they would arise at scales
smaller than 7 Mpc. Since the correlation function is proportional
to , a =1 implies an
overdensity of a factor 2 with respect to a randomly distributed field.
We can conclude that, since the correlation length found in this work
reflects the scale of the overdensities known up to now, we observe a physical
overdensity (of at least a factor 2) of AGNs around clusters between
2 and 8 Mpc from the center of the clusters.
Because of the shallowness of the NEP survey, the AGN surface density
(i.e. 30 deg-2 in the central region)
does not allow detection of such a correlation via overdensity analysis since it
would be dominated by small number statistics. In fact, from our results we expect to detect
AGNs overdensities on scales 7-8 Mpc from the center of clusters. At 0.18 (i.e. the
median of the cluster sample of the NEP survey) these overdensities arise on scales
of 0.6 deg-2 which are easily resolved by the NEP survey.
However to significantly detect these overdensity on single clusters,
a conspicuous number of sources is necessary to disentangle real overdensities
from shot noise.
As a final check we
compared our to the X-ray cluster-galaxy cross-correlation
function (hereinafter CGCCF) computed by Sánchez et al. (2005).
They used the X-ray selected clusters of the REFLEX survey (Böhringer et al. 2002)
and the galaxies from the APM survey (Maddox et al. 1990) limited to bj=20.5 mag.
They found that the CGCCF behaves like a broken power-law with a cut-off
distance of 2 Mpc with a steeper slope at small distances.
We can define the following approximate biasing relations:
| (1) |
Here is the autocorrelation of matter, and are the bias factors relative to galaxies, AGNs and clusters, respectively. By dividing the two equations we can then derive . In order to perform this operation several effects must be taken in account. The ratio is plotted in right panel of Fig. 1 as a function of the distance from the center of the cluster. The shaded region shows the value of our measurement that implies that =1 when taking into account the difference between real and redshift space measurements discussed in the previous paragraph. The ratio is consistent with 1 on almost all scales. We cannot exclude, within the errors, much different values of the relative bias. Our data suggest an average relative bias consistent with unity but allow an upper limit of 6 (at 1) at separations Mpc. For separations Mpc no lower limits bigger than zero can be given. On larger scales the error increase thus it is difficult to draw any conclusion. At large separations the power-law shape of becomes uncertain, this makes a comparison of our data with those of Sánchez et al. (2005) less meaningful. We cannot exclude a significant antibiasing of AGNs when compared to galaxies, especially at low separations. Though the amplitude of the uncertainties of our data still allows a fluctuation in the relative biasing of more than a factor 2, we can conclude with a precision of 1 that the probability for a galaxy to become an AGN is constant in the range of separations sampled in this work and that AGNs can be considered as good tracers of the dark matter distribution as are galaxies.
References
- Basilakos et al. (2005) Basilakos, S., Plionis, M., Georgakakis, A., & Georgantopoulos, I. 2005, MNRAS, 356, 183
- Blake et al. (2006) Blake, C., Pope, A., Scott, D., & Mobasher, B. 2006, MNRAS, 368, 732
- Böhringer et al. (2002) Böhringer, H., et al. 2002, ApJ, 566, 93
- Branchesi et al. (2007) Branchesi, M., Gioia, I. M., Fanti, C., Fanti, R., & Cappelluti, N. 2007, A&A, 462, 449
- Cappelluti et al. (2005) Cappelluti, N., Cappi, M., Dadina, M., Malaguti, G., Branchesi, M., D’Elia, V., & Palumbo, G. G. C. 2005, A&A, 430, 39
- Cappi et al. (2001) Cappi, M., et al. 2001, ApJ, 548, 624
- Gilli et al. (2005) Gilli, R., et al. 2005, A&A, 430, 811
- Henry et. al. (1991) Henry, J. P., & Briel, U. G. 1991, A&A, 246, L14
- Landy & Szalay (1993) Landy, S. D., & Szalay, A. S. 1993, ApJ, 412, 64
- Maddox et al. (1990) Maddox, S. J., Efstathiou, G., Sutherland, W. J., & Loveday, J. 1990, MNRAS, 242, 43P
- Mullis et al. (2004) Mullis, C. R., Henry, J. P., Gioia, I. M., Böhringer, H., Briel, U. G., Voges, W., & Huchra, J. P. 2004, ApJ, 617, 192
- Ruderman & Ebeling (2005) Ruderman, J. T., & Ebeling, H. 2005, ApJ, 623, L81
- Sánchez et al. (2005) Sánchez, A. G., Lambas, D. G., Böhringer, H., & Schuecker, P. 2005, MNRAS, 362, 1225
- Yang et al. (2006) Yang, Y., Mushotzky, R. F., Barger, A. J., & Cowie, L. L. 2006, ApJ, 645, 68