Rotational Widths for Use in the Tully-Fisher Relation. II. The Impact of Surface Brightness
Abstract
Using a large sample of spiral galaxies for which 21 cm single-dish and/or long-slit optical spectra are available, we make a detailed comparison between various estimates of rotational widths. Different optical width estimators are considered and their limitations discussed, with emphasis on biases associated with rotation curve properties (shape and extent) and disk central surface brightness. The best match with Hi rotational velocities is obtained with Polyex widths, which are measured at the optical radius (encompassing a fixed fraction of the total light of the galaxy) from a model fit to the rotation curve. In contrast with Polyex widths, optical rotational velocities measured at 2.15 disk scale lengths deviate from Hi widths by an amount that correlates with the central surface brightness of the disk. This bias occurs because the rotation curves of galaxies are in general still rising at 2.15 , and the fraction of total mass contained within this radius decreases with increasing disk surface brightness. Statistical corrections, parameterized by the radial extent of the observed rotation curve, are provided to reduce Polyex and Hi width measurements into a homogeneous system. This yields a single robust estimate of rotational velocity to be used for applications of disk scaling relations.
Subject headings:
galaxies: kinematics and dynamics — galaxies: distances and redshifts — galaxies: spiral — galaxies: structure — cosmology: observations1. Introduction
The importance of rotational velocities of spiral galaxies for extragalactic astronomy and observational cosmology stems in large part from their use in the Tully-Fisher (TF; Tully & Fisher, 1977) relation. TF surveys initially relied on rotational velocities measured from global (i.e., spatially integrated) Hi line profiles, typically obtained using the Arecibo, Nançay, Green Bank, Parkes, and Effelsberg radiotelescopes. Owing to sky coverage or sensitivity limitations of single-dish antennas, optical long-slit spectroscopy has been widely used to complement 21 cm Hi observations for TF applications. The accuracy of the velocity width measurement is particularly important for a TF survey, since the associated uncertainties play a dominant role in the overall error budget of the technique (Giovanelli et al., 1997b, hereafter G97b).
The observed velocity width of a spiral galaxy spectrum is primarily determined by the shape of its rotation curve (RC), the distribution of the adopted kinematic tracer, the inclination of the plane of the disk, and the measurement method. Integrated, single-dish Hi profiles provide very limited information regarding the distribution of the Hi gas, the shape of the RC, the presence of disk asymmetries, departures from planarity or non–circular motions. However, the Hi gas is largely distributed in the outer parts of disks, sampling preferentially regions where the RC is flat or slowly rising; in addition, these measurements are completely independent of uncertainties in the determination of the disks’ projected major axis. Long-slit, major axis spectra yield an estimate of the shape of the galaxy’s RC, and they do so with substantial angular resolution, allowing one to gauge departures from circular motion and disk asymmetries. Furthermore, they can probe the internal kinematics of galaxies in high density environments, where the Hi signal could be confused by the presence of more than one target within the telescope beam, or where the Hi emission could be truncated because of interaction with the intracluster medium (Hi deficiency; see, e.g., Haynes & Giovanelli, 1984; Solanes et al., 2001). Long-slit optical RCs are also easier and faster to obtain at higher redshifts (i.e., larger than a few thousand km s-1) compared to Hi spectra. However, they only sample the actively star forming regions of the disk, which typically extend only about half as far out as the detectable Hi gas, and are sensitive to errors in the estimate of the major axis position angle, high internal extinction, and other resolution-related effects (these issues are particularly important for intermediate redshift galaxies; see, e.g., Kapferer et al. 2006). Thus widths obtained with the two methods are differently affected by systematic effects.
The cross-calibration of and Hi velocity width scales and the understanding of the systematics involved in each technique are essential for the combined use of heterogeneous data sets in TF work. In fact, systematic differences between measures of rotational velocities derived separately from optical and radio spectra could mimic spurious bulk motions in peculiar velocity surveys, if the samples are segregated in the sky or in redshift space. Such width conversion is also important for kinematic studies of intermediate redshift () galaxies that must rely on other tracers, such as [O II]3727. Widths measured with these diagnostics must be calibrated with those obtained with Hi and spectroscopy of local spirals (Kobulnicky & Gebhardt, 2000).
As discussed in the first paper of this series (Catinella, Haynes, & Giovanelli, 2005, hereafter Paper I), the choice of the best algorithm to measure rotational velocities from long-slit spectra is not an obvious one. Therefore here we compare optical widths obtained from velocity histograms and from model fits to the RCs and, for the latter, address the issue of the choice of the reference radius for width measurement. In particular, we discuss the vulnerability of optical widths to systematic effects associated with RC shape and extent and disk central surface brightness (SB). For the RC width estimator that is least affected by these biases, we provide the cross-calibration with single-dish Hi widths. For a discussion of how rotational velocities derived from global Hi profiles may differ from those derived from Hi RCs, the reader is referred to, e.g., Verheijen (2001). Comparisons between Hi and velocity widths have been previously carried out by other authors, including Mathewson, Ford, & Buchhorn (1992), Raychaudhury et al. (1997), and Courteau (1997, hereafter C97), based on overlap samples substantially smaller than the one used here. However, the conversion relations suggested by previous authors do not take into account the biases discussed in this work. In particular, we show that the cross-calibration of optical and radio widths depends on the shape and extent of the observed RCs and, for widths measured at 2.15 disk scale lengths (e.g., C97), on the SB of the galaxies.
In Paper I we presented the latest installment of spectroscopy for the SFI++ sample (Springob et al., 2007) and described our technique to measure rotational velocities from long-slit spectra. We also showed that RC extent and Hi content are correlated, in the sense that for a given optical size, galaxies with larger Hi content are characterized by more extended RCs. This result, which holds for objects with normal Hi content (i.e., not only for Hi-deficient, cluster members), will be used here to explain observed trends in the comparison between optical and radio widths. The average, or template, RCs of disk galaxies binned in luminosity intervals obtained by Catinella, Giovanelli, & Haynes (2006, hereafter CGH06), together with the SB effects on observed disk scale lengths and optical sizes discussed therein, are also relevant for the analysis presented here.
The plan of this paper is as follows. The sample and velocity width measurements from optical RCs and Hi-line profiles used in this work are described in §2. The comparison between optical and radio rotational velocities is presented in §3. Systematic and SB effects are discussed in §4 and our conclusions summarized in §5.
2. Data Sample and Velocity Width Measurement
Our data set, referred to as SFI++, is a homogeneous compilation of I-band photometry and long-slit and/or Hi rotational parameters for 5000 galaxies, mostly late spirals. The SFI++ catalog was designed for peculiar velocity studies in the local universe using the TF method and is presented in Springob et al. (2007). Most of the SFI++ galaxies (85%) have velocity in the CMB frame cz10,000 km s-1 (97% have cz15,000 km s-1). Corrected velocity widths range between 53 and 834 km s-1 (and between 200 and 500 km s-1 for 80% of the objects), with a mean of 331 km s-1.
The sample used in this work consists of 2753 SFI++ galaxies with high quality long-slit /[N II] RCs and I-band photometry, for which good quality Polyex fits (see §2.1) are also available. Disk central SB values, (measured from the I-band profiles and corrected for Galactic and internal extinction, cosmological k-term, and converted to face-on perspective), for this sample vary between 14.0 and 21.3 mag arcsec-2 (only two objects have mag arcsec-2); the distribution of peaks at 18.6 mag arcsec-2. This data set was used for the comparisons involving optical widths only. For those involving radio widths, we used the subset of galaxies with high quality Hi spectra (uncertain or confused Hi profiles were discarded, as well as a few outliers whose optical and radio widths are clearly inconsistent, yielding a final sample of 873 objects).
2.1. Optical Widths from Long-slit Rotation Curves
The algorithms commonly used to measure rotational widths from long-slit spectra are based on either velocity histograms or functional fits to the RCs. For the former, the width is obtained as the difference between two percentile points of the RC velocity histogram; for the latter, the width is measured at a fixed radial distance in the disk (obtained from photometry) from the RC model fit. The histogram technique is simple, resembles that used to measure rotational widths from Hi integrated line profiles (although not intensity weighted), and does not require accompanying photometry. However, all the spatial information contained in the RC is lost and systematic biases arise as a consequence. In this work we characterize the biases affecting histogram width determinations and compare model widths measured at two different radial distances. We adopt the following RC width definitions:
(a) , the difference between the 90th and 10th percentile points of the velocity histogram (e.g., Vogt, 1995). We determined and for our RCs by linear interpolation between the nearest velocity data points. This definition is preferable over the difference between the maximum and the minimum velocity of the RC (e.g., Mathewson, Ford, & Buchhorn, 1992; Mathewson & Ford, 1996), because it is less sensitive to the noise level of the RC (the maximum and the minimum velocities typically correspond to the outermost detectable Hii regions, where the emission is usually fainter).
(b) . This is our algorithm of choice for RC width measurement and is described in detail in Paper I. In summary, we fold each RC and fit the following function (Polyex model) to it:
| (1) |
where , , and determine the amplitude, the exponential scale of the inner region, and the slope of the outer part of the RC, respectively. The Polyex width is measured from the fit at the optical radius111 is defined as the radius encompassing 83% of the total integrated light. It is equivalent to 3.2 disk scale lengths for a Freeman disk, i.e. an exponential disk with central surface brightness mag arcsec-2 in B-band (corresponding to mag arcsec-2 in I-band, adopting an average color index of 1.7 from de Jong 1996). : =2 (). Other fitting functions have been proposed, either empirical (e.g., C97; Kratsov et al., 1998; Vogt et al., 2004) or based on physical models of disk galaxies (e.g., Persic, Salucci & Stel, 1996). The Polyex model has no physical motivation, but has enough flexibility to fit the vast majority (94%) of the individual RCs in our data set, as well as the average RCs in luminosity intervals presented in CGH06. For , it also allows one to fit declining RCs.
(c) . We also discuss model widths measured from the Polyex fit at 2.15 (hence ) disk scale lengths , another common choice of reference radius for RC width measurement (see §2.1.1).
Observed velocity widths derived from RCs must be corrected for cosmological broadening (to obtain the rest-frame velocities) and deprojected to an edge-on view:
| (2) |
where and are redshift and inclination to the line of sight of the galaxy, respectively. The uncertainties introduced by the inclination correction are discussed in Giovanelli et al. (1997a, hereafter G97a) and Dale et al. (1997). Corrections for turbulent (i.e., non-circular) motions of the gas, usually applied to widths derived from Hi-line spectra (see §2.2), are considered negligible for RC widths. The reason is that, at any spatial location along the slit, the RC is obtained from the velocity of the peak of the line emission, and the broadening of the line due to turbulent motions only affects its width (more details on RC extraction can be found in Paper I). Two other effects that could distort the observed RCs are slit smearing (because of the finite width of the spectrograph slit, regions that are slightly off the major axis could contribute to the flux, smearing the RC) and slit misalignment. These effects preferentially act in the sense of underestimating the true velocity widths. Numerical simulations (to be presented elsewhere) show that the combined effect of slit smearing and misalignment has a typical amplitude of the order of 1-2%, significantly smaller than the accuracy of width measurements. Therefore we do not correct the observed widths for these effects.
Velocity widths used in this work are corrected for cosmological broadening only; the sin correction is not applied in order to minimize the uncertainties in our analysis, but we checked our results for possible dependences on inclination. The plots shown in this paper do not change significantly when the inclination-corrected widths are used instead.
2.1.1 Which Reference Radius for RC Width Measurement?
The choice of the radius at which the model velocity widths should be measured is subject to some debate. As discussed in Paper I, observed RCs usually do not show a feature that could be easily associated with the maximum circular velocity. In particular, RCs are in general flat or even rising beyond 2.15 , i.e. the location of the peak velocity for a pure exponential disk (Freeman, 1970). Compared to rotational velocities measured at 2.15 , widths evaluated at are less affected by extinction and are more resilient, in the sense that a given error on the spatial scale translates into a smaller scatter in the measured widths, because velocity gradients are smaller in the outer disk. Moreover, is a cumulative parameter, and hence more straightforward to measure than and less subject to extinction effects. The use of avoids an additional complication. When the reference radius is a photometric quantity, such as a multiple of or an isophotal radius, its location on the disk will vary with the inclination of the galaxy to the line of sight. As a result, the corresponding measured width will in general depend on inclination in a more complex form than purely sinusoidal. The process could be standardized by using the radius at a fixed inclination, e.g. face-on. However, the measured scale length of a given galaxy varies by about 50% purely as the disk inclination varies from intermediate to high values (see e.g. Giovanelli et al. 1994, Fig. 12), and the conversion is quite uncertain. Thus, the reference radius should be chosen in the very outer disk, where one may safely assume nearly total transparency and the conversion to a face-on value is straightforward.
One advantage of width measurements at 2.15 is that most observed RCs are mapped as far out as this radial distance, whereas only 60% reach . Thus, the measurement of at requires more frequently an extrapolation of the fit. However, such extrapolation is mild, because, even if the RCs still rise near , they do so at a small rate. Moreover, most of the RCs in our sample (84%) extend to at least 0.8 (only 2% have extent smaller than 0.5 . These are not used for TF applications).
For all the above reasons and in our experience, the total uncertainty associated with the width measurement at is smaller than that at 2.15 . Ultimately, optical widths need to be compared to Hi ones, which sample the galaxy kinematics out to larger radial distances in the disks. These should therefore provide more reliable estimates of the maximum rotational velocity, at least for objects in low density environments, where the Hi distribution is undisturbed. Such a comparison is presented in § 3.2.
2.2. Radio Widths from Hi-line Profiles
Observations with single dish radio telescopes, whose beam areas significantly exceed the angular size of the Hi distribution of a target galaxy, yield a spectrum of the galaxy’s spatially integrated Hi profile. Such profiles reveal neither the shape of the RC nor the details of the Hi distribution, an argument that has sometimes been used to suggest limited usefulness for single dish 21cm widths (e.g. C97, §11). Nonetheless, such widths yield TF relations of low scatter. This occurs because of the small slopes of RCs in the outer parts of disks, where much of the gas tends to be located (typically half of the Hi lies outside of about three scale lengths from the center). This produces sharp outer edges to the spectral profiles, so that a width measurement can be obtained with high precision (generally 10 km s-1). This circumstance is more significant for luminous objects. For galaxies with rotational velocities of km s-1 or less, the outer slope of the RC is large and the turbulent motions become relatively more important. As discussed in G97b, the TF scatter among less luminous objects is quite large, partly because the shape of the RC and the presence of turbulence make the derivation of rotational velocity more uncertain, as are estimates of disk inclination, but principally because the TF intrinsic scatter is larger among them (see Hoffman et al. 1996 as well as G97b). Therefore, these objects are ill-suited as targets for TF studies for the determination of distances or peculiar velocities, and such studies may be better off without them.
Rotational widths of disk galaxies are commonly obtained from double-horned Hi profiles by measuring the velocity difference between the outer N% levels of each peak. Our technique is described in detail in Haynes et al. (1999) and Springob et al. (2005, hereafter S05). In summary, a straight line is fitted to the receding side of the Hi profile, between the 15% and 85% levels of the peak flux; is the velocity for which the line fit has a flux equal to 50% of that of the peak. The analogous process on the approaching side of the profile yields ; thus the measured width is .
Standard corrections applied to Hi-line widths include those for instrumental and cosmological broadening, turbulent motions, and deprojection to edge-on view:
| (3) |
The cosmological and inclination corrections are the same as those applied to the optical widths (see eq. 2). The term accounts for the effects of the spectrometer resolution, the amount of smoothing applied, and the signal-to-noise quality of the spectrum; the exact functional dependence of on the latter two quantities must be modeled with numerical simulations (S05). This correction is of the order of the width of the velocity channels, typically between 5 and 11 km s-1 for our data. The correction for turbulent motions, , is somewhat uncertain, and different values have been adopted in the literature. S05 derived it for our data by introducing a random, isotropic 10 km s-1 turbulent motion to their simulations, and obtained 6.5 km s-1, independent of profile width and signal-to-noise ratio.
As for the optical data, no inclination correction is applied to
the Hi widths.
For convenience, the definitions of all the radial distances and
rotational velocities adopted in this work are summarized in Table
1.
3. Velocity Width Comparisons
3.1. Optical Widths
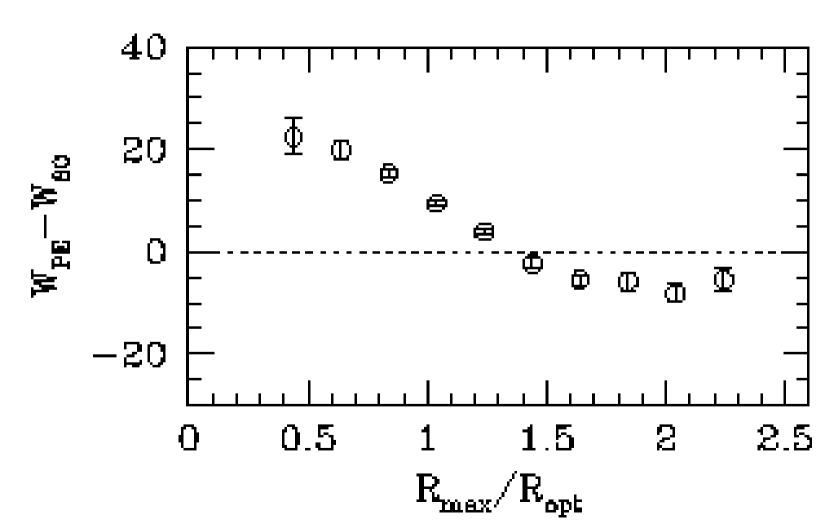
As mentioned in §2.1, width determinations based on velocity histograms do not make use of the spatial information contained in the RCs and this causes systematic deviations with respect to measurements performed at a fixed radial scale. On average, since the RCs are typically rising within the optical disks (CGH06), histogram widths are expected to be systematically smaller (larger) than for RCs less (more) extended than , where the Polyex width is evaluated. This is shown in Figure 1, where we plot the difference between Polyex and histogram widths as a function of RC extent (expressed in units of ). The effect is smaller for RCs with larger extent, because galaxies with intrinsically large disks are also more luminous, and therefore their RCs tend to be flatter (CGH06).
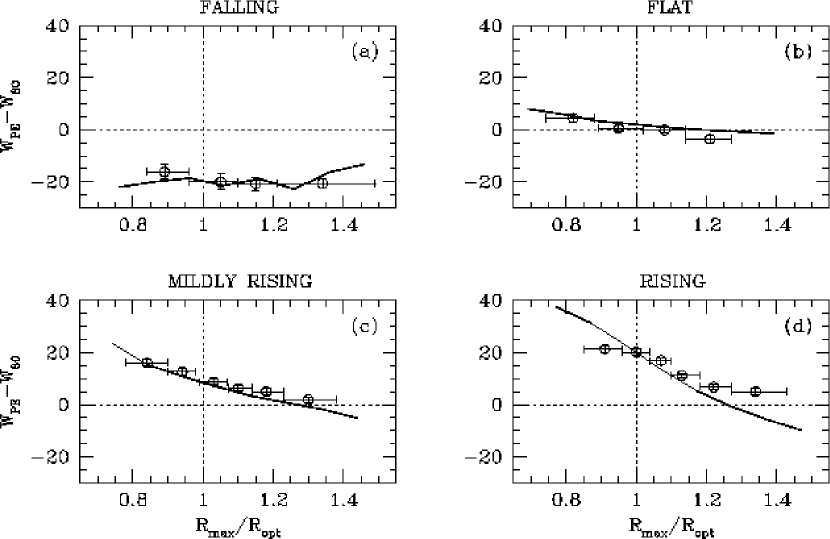
In order to characterize the dependence of histogram width measurements on the velocity gradient of the RCs, we divided our sample into four bins with increasing RC outer slope, as obtained from the Polyex fit between 0.5 and 1.0 . Figure 2 shows the difference between and as a function of RC extent for the four bins, roughly corresponding to falling (a), flat (b), mildly rising (c), and rising (d) RCs. Several features can be noticed: (1) the difference depends on both extent and slope of the RC; (2) and yield the same results only for flat RCs, traced out to a radial distance of the order of ; (3) over the / range considered here, is smaller than for rising RCs, the difference increasing for RCs with steeper outer slope and smaller extent. In the case of falling RCs, is larger than ; (4) the intercept of the relation with the axis /=1 increases from approximately 20 to 20 km s-1 from falling to rising RCs.
We performed numerical simulations to model the trends observed in Figure 2. We simulated mock catalogs of galaxies with ideal, perfectly symmetric and noiseless RCs, assigning RC extent (/) and Polyex fitting parameters with the same frequency distributions observed in the SFI++ sample (paying attention to the fact that the distributions of the RC parameters are not independent from each other). We calculated RC slopes and widths, and binned the simulated data as done for our observations. The results are shown as solid lines in Figure 2. Even with the simplistic RC description adopted, our simulations are able to reproduce the systematic trends observed in the data. A more realistic modeling, taking into account statistical distributions of emission extent, RC asymmetry, and measurement errors, could easily explain the remaining (small) differences between the data and the results of the simulations presented here. These results demonstrate that the systematic biases affecting histogram width measurements are completely explained, once the extents and shapes of the RCs are taken into account. RC widths based on velocity histograms will not be further discussed.
The next issue we want to address is the choice of the reference radius at which model widths should be evaluated, or 2.15 . The uncertainties affecting the measurement of and have been discussed in §2.1.1; in this section and in §3.2 we will compare and with each other and with velocity widths derived from Hi spectra.
The mean width difference for our sample is 17 km s-1 (with a dispersion =19 km s-1). This offset is expected from the fact that, on average, the RCs are still rising at 2.15 (CGH06, Fig. 1) and is measured farther out in the disk. However, values of for individual galaxies show a large variation, from 32 to over 100 km s-1 (see Fig. 3 below).
As opposed to histogram widths, model widths do not depend on RC extent, as long as the RC is sampled to a radius large enough to warrant a reliable fit. In fact, does not show systematic variations when plotted as a function of / (not shown). On the other hand, the difference between widths measured at and 2.15 should increase for larger / ratios, and thus should depend on SB, because galaxies with larger values of / are typically of higher optical SB (CGH06).
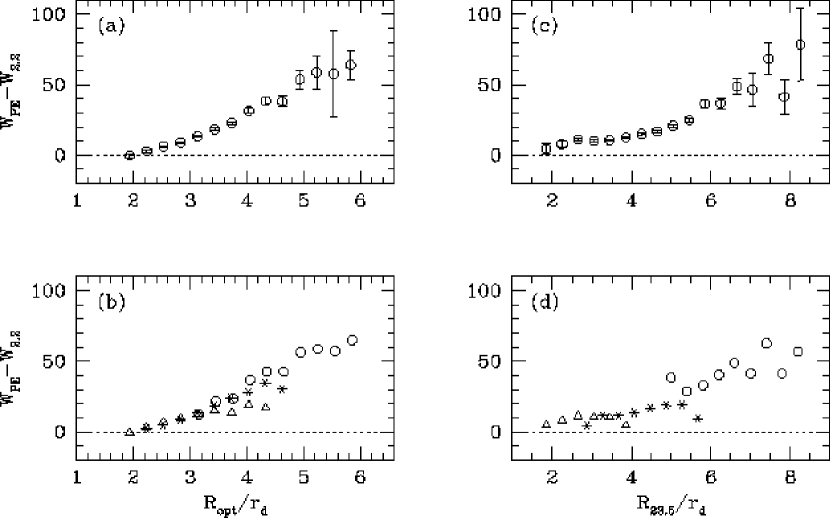
In order to quantify these biases and gain more insights on the role of the SB of a galaxy, we studied the variation of the width difference as a function of the / and / ratios222 is the isophotal radius measured at an I-band surface brightness of 23.5 mag arcsec-2. This approximately corresponds to in B-band, assuming an average color index of 1.7 (from de Jong, 1996). and of the I-band disk central SB, . Figure 3a shows the dependence of on the / ratio for the whole sample. This correlation is entirely expected from the fact that the RCs are typically still rising at 2.15 , where is measured. Therefore, for a given , will increase for smaller values of , i.e. larger / ratios, as observed. The bins corresponding to larger width differences have larger error bars, due to both smaller number statistics and larger scatter among the individual data that were combined.
As already mentioned, galaxies of higher have typically larger values of / and thus, based on Figure 3a, they should also have larger width differences. This is confirmed in panel (b), where the sample has been divided into three intervals of central SB (corresponding to those adopted in Fig. 9 of CGH06, except that the two central bins in that figure have now been combined).
It is perhaps more insightful to study the dependence of the width difference on the / ratio, since an isophotal radius has a more straightforward dependence on the disk central SB than . In fact, the observed brightness profile of an exponential disk, expressed in magnitude terms, can be written as:
which implies a linear relationship between and the / ratio:
Since and are clearly correlated, this also implies a correlation between and /, but the scatter is of course larger. To this extent, it is worth remembering that is defined as the radius encompassing a fixed fraction of the total light of the galaxy, i.e. it is not a pure disk quantity. Therefore, its value depends on the degree of concentration of the light as well as on the possible presence of a spheroidal component. For a given total luminosity, smaller exponential disks clearly have larger / ratios. For a Freeman disk, / (see footnote 1); galaxies of higher SB and similar values of have larger / ratios. However, notice that a galaxy harboring a bulge has a smaller / than a galaxy with the same exponential disk but no bulge. Figures 3c and 3d illustrate the behavior of the width difference as a function of / for the whole sample and separately for the three SB intervals, respectively. Panel (d) shows that galaxies of different SB are well segregated in the / parameter space and that larger width differences are clearly associated with higher disk central SB. This will be further discussed in §4.
In order to decide which model width, or , is best suited for use in the TF relation, we will compare these with width measurements obtained from Hi spectra in §3.2. The optical width of choice will be that providing the best match to based on the amount of offset and scatter of the correlation and, most importantly, vulnerability to systematic effects.
3.2. Optical vs. Radio Widths
The results presented in the previous section showed that the difference between optical model widths measured at and 2.15 depends on the SB of the galaxy. Thus we first evaluate the impact of SB-related biases on comparisons between radio and optical rotational velocities by plotting the corresponding width differences as functions of the / ratio. As Figure 4 clearly demonstrates, provides a more reliable estimate of the full width of disk galaxies, as measured from spatially integrated Hi-line profiles, than does . In fact, not only is the difference between and always smaller than that between and , but it is also not affected by systematic trends, whereas increases for larger / ratios, i.e. galaxies of higher SB. Plotting the width differences as functions of the central SB yields analogous results. Therefore we will only cross-calibrate Hi and Polyex widths and discuss the implications of the SB effects associated with RC widths measured at 2.15 in §4.
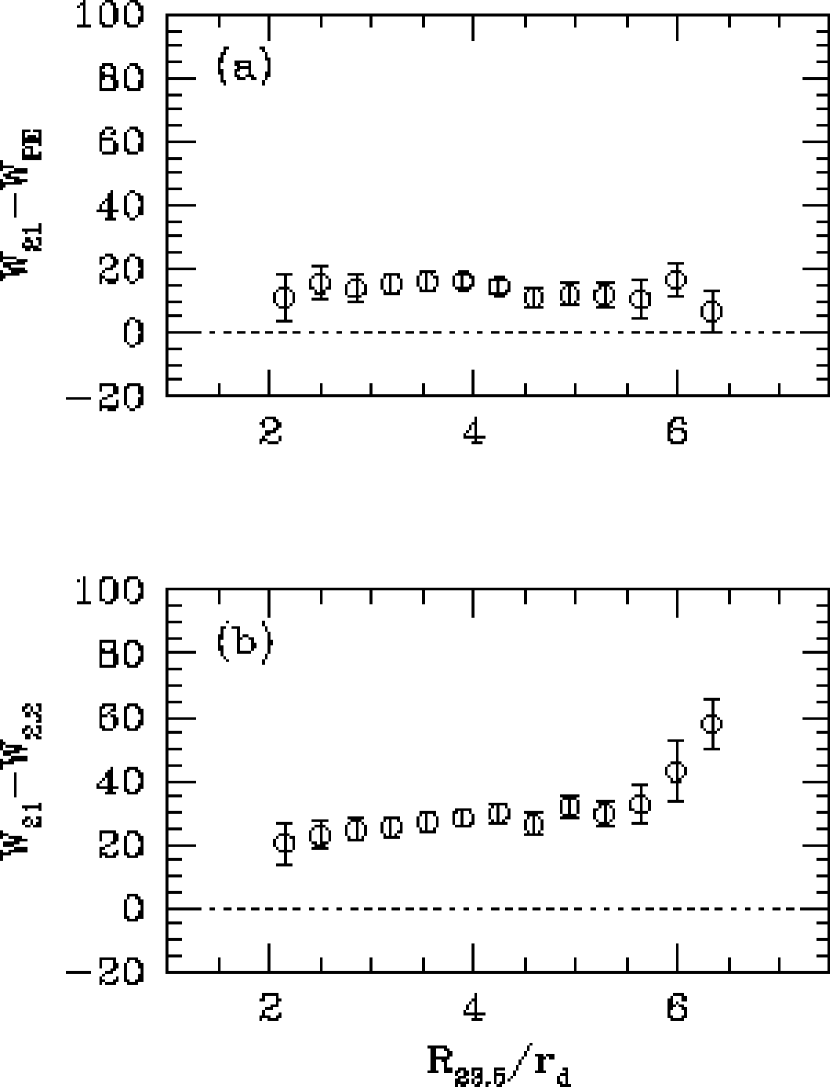
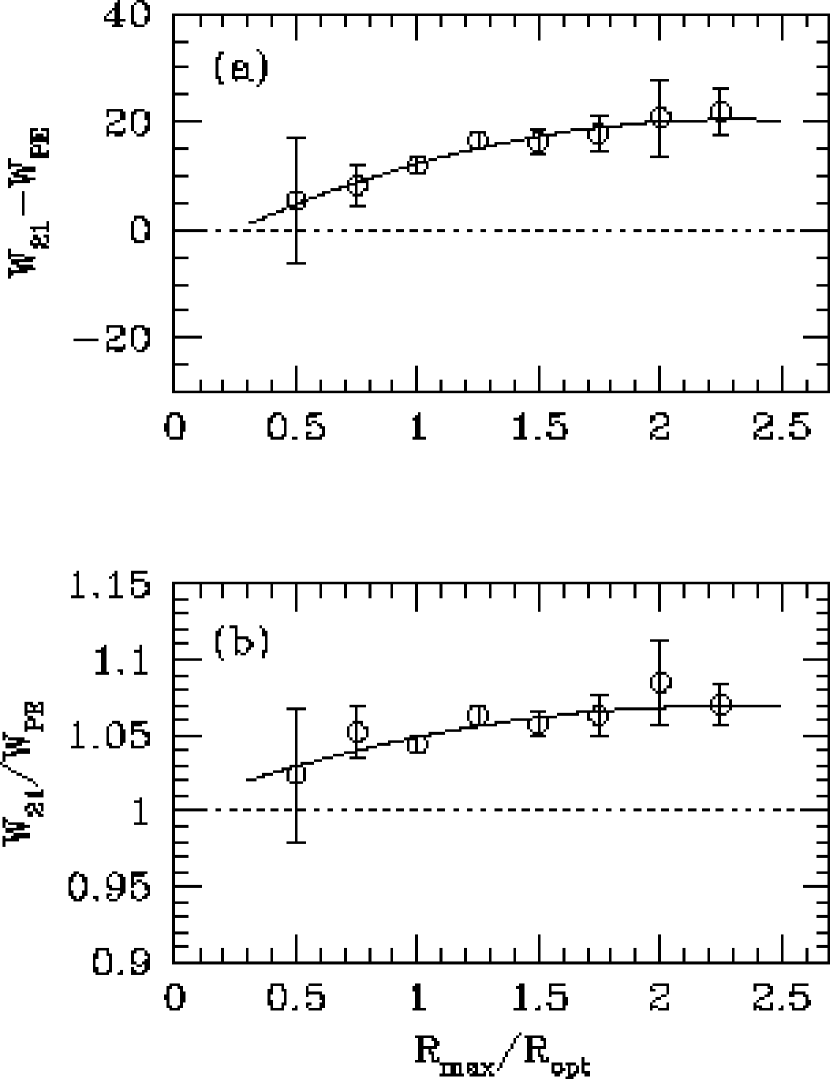
As seen in Figure 4, Hi widths are systematically larger than ones; the average value of is km s-1 (with a dispersion =29 km s-1). Interestingly, the width difference tends to increase for galaxies with extended RCs, as shown in Figure 5a. The velocity increase is small for the whole sample and the scatter is large (excluding the two bins with /2, which include less than 20 objects each, the velocity dispersion increases monotonically from 20 to 53 km s-1 with decreasing RC extent), nonetheless the effect is systematic. The same bias can be seen in panel (b), where the ratio, rather than the difference, of the two widths is plotted. The solid lines in panels (a) and (b) are quadratic fits to the data; their analytical expressions can be found in the first two rows of Table 2, respectively.
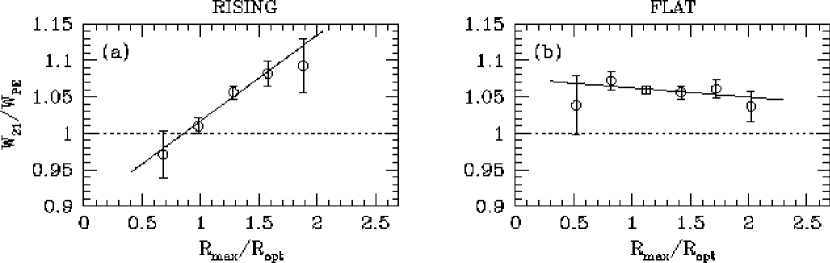
The fact that the RCs might still be rising beyond could explain the offset between and (as long as Hi emission is detected beyond ), but not the dependence of their ratio on RC extent. The latter requires that RC and Hi extents are also correlated. In Paper I we showed that, for a given optical size, star formation can be traced farther out in disks of galaxies with larger Hi content. We also pointed out that this result is not limited to the well known case of truncated star formation in Hi-poor cluster objects, but also holds for Hi-normal, field spirals. From the analysis of a sample of 108 Hi-rich galaxies with available Hi synthesis maps, Broeils & Rhee (1997) showed that Hi mass and Hi diameter are tightly correlated; moreover the Hi diameter correlates well with the optical size of the galaxy. Therefore, a correlation between RC extent and Hi size seems to be a reasonable assumption. Thus, biases might arise because for galaxies with larger extent the Hi width traces farther out into the halo, while we continue to measure at . This also implies that the dependence of the width ratio (or difference) on RC extent should be larger for rising RCs and negligible for flat ones. This is clearly demonstrated in Figure 6, where the sample is divided into two classes with different RC slopes at the optical radius. The dependence of / on RC extent is present for galaxies with rising RCs (a), but effectively disappears for the rest of the sample (b). Linear fits to the data points are shown as solid lines and listed in the last two rows of Table 2. Notice that, for rising RCs with extent smaller than , tends to be larger than , implying that the extrapolation of the RC to (where is measured) often overestimates the width measured from Hi profiles. However, it should also be noticed that the first bin of panel (a) includes only 20 elements and that the scatter in these plots is large (the value of the 1 dispersion around the mean is 0.15 for the first bin and 0.10 for the other bins of panel [a], and varies between 0.07 and 0.20 for panel [b]).
The common assumption that optical widths underestimate radio ones, because RCs are often rising and the Hi gas extends farther out in the disk compared to emission, is confirmed by our data. As argued above, the observed dependence of / on RC extent is also in agreement with this picture, if one assumes that galaxies with larger RC extent also have larger Hi size. However, these arguments do not explain why Hi widths are systematically larger than ones for galaxies with flat RCs (Fig. 6b). Even adopting a much stricter definition of flat RC (i.e., , a requirement met by 161 objects) yields an average velocity offset of km s-1. At least part of this offset might indicate that the turbulent motion correction applied to radio widths (6.5 km s-1, see § 2.2) is underestimated. Not only is such a correction somewhat uncertain, with various values being advocated by different authors, but also it does not take into account tidal disturbances, bars, and non-planar motions which can occur frequently and with varying amplitude. Another important factor to keep in mind is that widths obtained from global Hi profiles depend on both RC shape and distribution of the Hi gas. Resolved Hi RCs of nearby galaxies show that, for most intermediate and bright objects, a velocity peak is often reached before or near 3 , followed by a small decline and a flat outer part (e.g., Casertano & van Gorkom 1991; Broeils 1992; C97; Verheijen 2001). In these cases, the width of the global Hi profile measures the peak velocity, whereas the Polyex width obtained from the RC would yield the amplitude of the flat part (as typically /3.2 for high SB galaxies).
The results presented in this section indicate that, in order to cross-calibrate optical and radio rotational velocities, both extent and shape of the RCs should be taken into account. The relations presented in Table 2 allow us to combine Polyex and Hi velocity widths into a homogeneous data set, which can be used for applications of the TF distance method without introducing significant systematic biases.
4. Discussion
4.1. Systematic Effects
The comparison between Hi and velocity widths has been carried out by several authors. Courteau (1992), Mathewson, Ford, & Buchhorn (1992), Vogt (1995), and Raychaudhury et al. (1997) found tight correlations between radio and optical histogram widths, with slopes approximately equal to unity, small zero points ( km s-1), and dispersions ranging between 10 and 30 km s-1. The most comprehensive calibration to date is that of C97, who compared optical widths measured with several algorithms for a sample of 304 galaxies with Hi widths obtained by G97a (we note that the G97a data set is part of the SFI++ sample, but the Hi widths have recently been recomputed using different instrumental and turbulent motion corrections, following S05). He concluded that the best match to 21 cm widths is obtained with model optical widths measured at 2.15 (using a fitting function different from the Polyex model adopted here). This was based on the observation that the other RC widths examined in his work (including histogram types and model widths measured at 3.2 ) yield correlations with radio widths having larger zero points and scatters (but similar slopes).
However, direct comparisons between different width estimators are not the best way to establish the most suitable algorithm for optical width measurement, because they are not sensitive to the presence of systematic biases in the data. In this paper, we argue that model widths measured at the optical radius (defined as a cumulative quantity and not as a fixed multiple of exponential disk scale lengths) provide the best match to Hi widths because they are the least affected by systematic effects. In fact, we have demonstrated that histogram widths deviate with respect to measurements performed at a fixed radial scale in a systematic and predictable way, depending on the shape and extent of the RCs. Next, we have compared model widths measured at and 2.15 , and , and shown that their difference is larger for galaxies with higher disk central SB. The comparison with Hi rotational velocities indicates that measurements are not affected by SB effects, contrary to ones. As shown in Figure 4, the difference between Hi and Polyex widths plotted as a function of the / ratio shows no systematic trends, whereas increases for larger / values (i.e. higher SB objects), varying from 20 to 60 km s-1. However, even Polyex widths are not completely immune to systematic effects, as the difference (or their ratio) still shows a slight dependence on the radial extent of the observed RC, for which we provide a statistical correction. Such dependence also exists for histogram and widths (see Catinella 2005).
Systematic effects such as those mentioned above must be taken into account in order to avoid biases in the analysis of TF surveys. As mentioned in Paper I, a width difference of 20 km s-1 translates into approximately a 0.2 mag offset on the TF plane, or 500 km s-1 in peculiar velocity, at km s-1. Thus spurious bulk flows of significant size can arise when heterogeneous data sets (e.g., optical and radio) are combined that do not share similar distribution properties, such as in sky projection or redshift. The same considerations apply to a homogeneous sample of galaxies spanning a range of central SB and redshift, if is used as width estimator. In fact, higher redshift bins would preferentially include higher SB objects and these require larger width corrections, as seen in Figure 4b.
4.2. Surface Brightness
In this section we discuss in more detail the impact of galaxy SB and RC shape on optical width measurements.
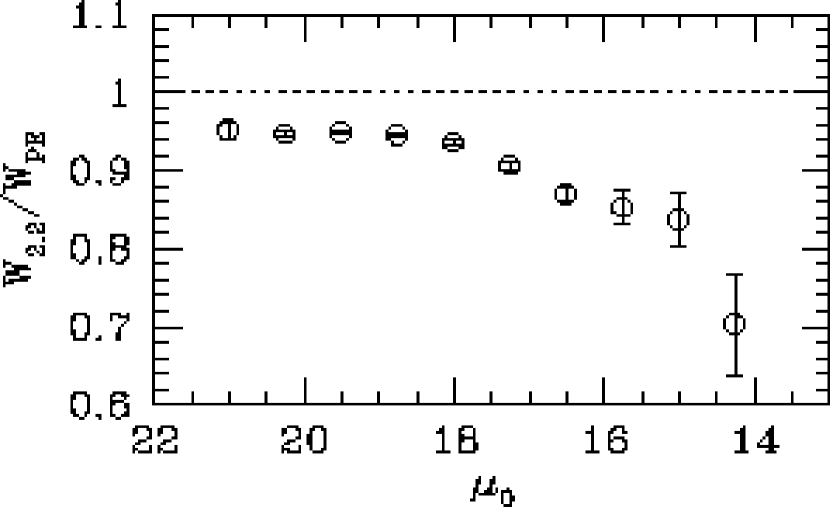
Velocity widths obtained from model fits to the RCs depend on both RC shape and radius at which the measurement is performed. When model widths measured at 2.15 and are compared, a dependence on disk central SB is also observed. This was shown in Figure 3 and is illustrated more clearly in Figure 7, where / is plotted as a function of the I-band disk central SB, . The width ratio is approximately constant for low SB (LSB) galaxies333 We use “LSB” to indicate the lower end of the SB interval spanned by our data. However, it should be noted that our sample includes very few truly low SB systems (see § 2). and decreases for high SB (HSB) ones. The reason for this trend is that HSB galaxies have larger / ratios. Since the RCs are typically rising at 2.15 , this implies that reaches a smaller fraction of the velocity at in HSB galaxies.
Observed rotational widths yield information on the total (i.e., baryonic and dark) mass contained within the radius where they are measured. In particular, is measured at the radius where the RC of the exponential, stellar disk would peak (i.e., where the contribution of the baryonic component to the total velocity field is maximized), whereas is measured at a larger radius, where the contribution of the dark matter to the RC is expected to be larger. The dependence of the width ratio on SB seen in Figure 7 indicates that the fraction of total mass contained within 2.15 decreases for galaxies of higher disk central SB. This yields support to the commonly accepted notion that in HSB galaxies the dark matter contribution becomes important only at large radii, whereas LSB galaxies are already dark matter dominated at small radii (e.g., Casertano & van Gorkom 1991; de Blok & Bosma 2002). In particular, the severity of the mass discrepancy correlates with central SB, being larger for lower SB (e.g., McGaugh & de Blok 1998 and references therein).
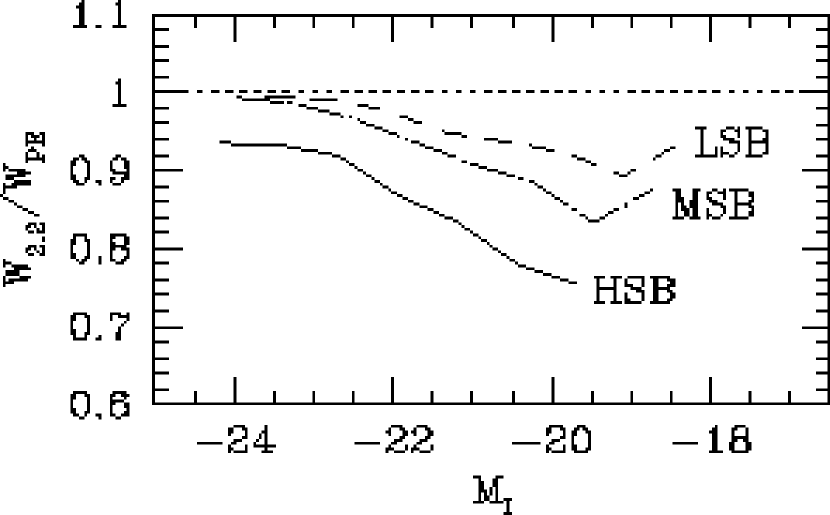
Since RC shapes are known to depend strongly on luminosity (e.g., Rubin et al. 1985; Persic, Salucci & Stel 1996; CGH06), it is interesting to look at the dependence of the / ratio on both central SB and luminosity. Figure 8 shows how the ratio between the two model widths varies with I-band absolute magnitude, for galaxies of different central SB. The three SB classes correspond to those defined in Figure 3 (namely, the HSB/MSB and MSB/LSB divisions occur at of 17.5 and 19.5 mag arcsec-2, respectively). Since the shape of the RCs depends on luminosity and the / ratio depends on , this plot clarifies the interplay between RC shape and choice of reference radius when one measures velocity widths from RCs. Typically, galaxies on the left (right) hand side of the plot have flat (rising) RCs, and the / ratio increases from top (LSB) to bottom (HSB). For a given luminosity, the / width ratio is smaller for HSB galaxies, because the RC shape is approximately fixed but the separation between the radii where the widths are measured increases. Conversely, along a “constant” SB line the / ratio does not vary strongly, but the RC shape changes substantially, and larger width discrepancies are associated with rising RCs. and show the best agreement for high luminosity, LSB galaxies and the largest discrepancy for lower luminosity, HSB objects.
As mentioned above, the shapes of the RCs are known to depend strongly on luminosity but also, as numerous authors have pointed out, on SB. Disentangling the relative importance of these two quantities for the shapes of the observed RCs of galaxies spanning a wide range of properties is not a trivial task. Nonetheless, this would be helpful to improve our understanding of the systematic trends affecting optical width measurements discussed here. A detailed study of how RC shapes vary with the SB of a galaxy for the SFI++ sample is beyond the scope of this paper and will be explored in a future work.
5. Summary and Conclusions
In this work we have made a detailed comparison of rotational widths obtained from long-slit optical and single-dish 21 cm spectra. Because the combination of heterogeneous data sets is necessary for the study of many astrophysical problems, this comparison is important in underscoring potential sources of bias.
Since the choice of the best RC width for TF applications is somewhat debated, we have considered different RC width estimators and discussed their limitations. In particular, we have studied their vulnerability to biases related to the shape and extent of the RCs and to the disk central SB of the galaxies. Our main conclusions are:
(a) Optical rotational widths obtained from RC velocity histograms are affected by systematic biases that correlate with the shape and the extent of the RCs. The systematics observed in the data are well reproduced by our numerical simulations.
(b) A more reliable width estimate that makes use of the spatial information contained in the RCs is obtained by fitting a function to the RC and measuring the velocity at a fixed radial distance from the center of the disk. We refer to these as model widths. In this work, we used the Polyex model (eq. 1) to fit the RCs. Velocity widths measured from the RC fit at the optical radius, , are referred to as Polyex widths, .
(c) The comparison between model widths measured at and 2.15 , and , shows a dependence on disk central SB. Larger width differences are observed for galaxies of higher SB, which are characterized by larger / ratios. For a fixed SB, the / ratio decreases for galaxies of lower luminosity, which typically have rising RCs. Thus this bias occurs because RCs are in general still rising at 2.15 , and the fraction of total mass included within that radius is smaller for HSB galaxies.
(d) The best match with Hi rotational velocities is obtained with RC widths measured at the optical radius. In fact, is always smaller than and, most importantly, is not affected by SB effects, whereas is larger for galaxies of higher disk central SB.
(e) When compared with 21 cm measurements, all the optical widths examined in this work show a dependence on the radial extent to which RCs are measured. For the model widths, larger offsets from are observed for galaxies with emission traced farther out in the disk. If the radial extent of the Hi emission and that of the detectable Hii regions are correlated (see § 3.2), galaxies with larger disks and rising RCs should also have larger Hi extents and widths. In fact, we have shown that the dependence of / on RC extent exists only for rising RCs and effectively disappears for flat ones.
Lastly, we have provided statistical corrections, parameterized by the radial extent of the observed optical RC, that can be applied to Polyex measurements in order to approximate consistency with Hi rotational widths. Such cross-calibration has been used for the derivation of a TF template relation for the SFI++ sample (Masters et al., 2006). Failure to correct observed rotational widths for the systematic effects discussed here will produce biases in astrophysical inferences, most notably in the measurement of the peculiar velocity field and the study of the evolution of galactic mass–to–light ratios. These biases can become particularly significant when data sets are combined that do not share similar distribution properties, such as in sky projection or redshift.
References
- Broeils (1992) Broeils, A. H. 1992, Ph.D. thesis, Univ. Groningen
- Broeils & Rhee (1997) Broeils, A. H., & Rhee, M.-H. 1997, A&A, 324, 877
- Casertano & van Gorkom (1991) Casertano, S., & van Gorkom, J. H. 1991, AJ, 101, 1231
- Catinella (2005) Catinella, B. 2005, Ph.D. thesis, Cornell Univ.
- Catinella, Giovanelli, & Haynes (2006) Catinella, B., Giovanelli, R., & Haynes, M. P. 2006, ApJ, 640, 751 (CGH06)
- Catinella, Haynes, & Giovanelli (2005) Catinella, B., Haynes, M. P., & Giovanelli, R. 2005, AJ, 130, 1037 (Paper I)
- Courteau (1992) Courteau, S. 1992, Ph.D. thesis, University of California, Santa Cruz
- Courteau (1997) Courteau, S. 1997, AJ, 114, 2402 (C97)
- Dale et al. (1997) Dale, D. A., Giovanelli, R., Haynes, M. P., Scodeggio, M., Hardy, E., & Campusano, L. E. 1997, AJ, 114, 455
- de Blok & Bosma (2002) de Blok, W. J. G., & Bosma, A. 2002, A&A, 385, 816
- de Jong (1996) de Jong, R. S. 1996, A&A, 313, 377
- Freeman (1970) Freeman, K. C. 1970, ApJ, 160, 811
- Giovanelli et al. (1997a) Giovanelli, R., Haynes, M. P., Herter, T., Wegner, G., Salzer, J. J., da Costa, L. N., & Freudling, W. 1997a, AJ, 113, 22 (G97a)
- Giovanelli et al. (1997b) Giovanelli, R., Haynes, M. P., Herter, T., Vogt, N. P., da Costa, L. N., Freudling, W., Salzer, J. J., & Wegner, G. 1997b, AJ, 113, 53 (G97b)
- Giovanelli et al. (1994) Giovanelli, R., Haynes, M. P., Salzer, J. J., Wegner, G., da Costa, L. N., & Freudling, W. 1994, AJ, 107, 2036
- Haynes & Giovanelli (1984) Haynes, M. P., & Giovanelli, R. 1984, AJ, 89, 758
- Haynes et al. (1999) Haynes, M. P., Giovanelli, R., Chamaraux, P., da Costa, L. N., Freudling, W., Salzer, J. J., & Wegner,G. 1999, AJ, 117, 2039
- Hoffman et al. (1996) Hoffman, G. L., Salpeter, E. E., Farhat, B., Roos, T., Williams, H., & Helou, G. 1996, ApJS, 105, 269
- Kapferer et al. (2006) Kapferer, W., Kronberger, T., Schindler, S., Böhm, A., & Ziegler, B. L. 2006, A&A, 446, 847
- Kobulnicky & Gebhardt (2000) Kobulnicky, H. A., & Gebhardt, K. 2000, AJ, 119, 1608
- Kratsov et al. (1998) Kratsov, A. V., Klypin, A. A., Bullock, J. S. & Primack, J. R. 1998, ApJ, 502, 48
- Masters et al. (2006) Masters, K. L., Springob, C. M., Haynes, M. P., & Giovanelli, R. 2006, ApJ, 653, 861
- Mathewson & Ford (1996) Mathewson, D. S., & Ford, V. L. 1996, ApJS, 107, 97
- Mathewson, Ford, & Buchhorn (1992) Mathewson, D. S., Ford, V. L., & Buchhorn, M. 1992, ApJS, 81, 413
- McGaugh & de Blok (1998) McGaugh, S. S., & de Blok, W. J. G. 1998, ApJ, 499, 41
- Persic, Salucci & Stel (1996) Persic, M., Salucci, P. , & Stel, F. 1996, MNRAS, 281, 27
- Raychaudhury et al. (1997) Raychaudhury, S., von Braun, K., Bernstein, G. M., & Guhathakurta, P. 1997, AJ, 113, 2046
- Rubin et al. (1985) Rubin, V. C., Burstein, D., Ford, W. K., & Thonnard, N. 1985, ApJ, 289, 81
- Solanes et al. (2001) Solanes, J. M., Manrique, A., García-Gómez, C., González-Casado, G., Giovanelli, R., & Haynes, M. P. 2001, ApJ, 548, 97
- Springob et al. (2005) Springob, C. M., Haynes, M. P., Giovanelli, R., & Kent, B. R. 2005, ApJS, 160, 149 (S05)
- Springob et al. (2007) Springob, C. M., Masters, K. L., Haynes, M. P., Giovanelli, R., & Marinoni, C. 2007, ApJS, submitted
- Tully & Fisher (1977) Tully, R. B., & Fisher, J. R. 1977, A&A, 54, 661
- Verheijen (2001) Verheijen, M. A. W. 2001, ApJ, 563, 694
- Vogt (1995) Vogt, N. P. 1995, Ph.D. thesis, Cornell Univ.
- Vogt et al. (2004) Vogt, N. P., Haynes, M. P., Herter, T. & Giovanelli, R. 2004, AJ, 127, 3273
| Symbol | Definition |
|---|---|
| Scale length of the exponential disk from the I-band profile | |
| Scale length of the exponential part of the Polyex fit to the RC | |
| RC extent (i.e., maximum radius up to which the folded RC is sampled) | |
| Radius encompassing 83% of the total I-band light | |
| Isophotal radius measured at an I-band surface magnitude of 23.5 mag arcsec-2 | |
| Difference between the 90th and 10th percentile points of the RC velocity histogram | |
| Twice the velocity at , measured from a Polyex fit to the RC | |
| Twice the velocity at 2.15 , measured from a Polyex fit to the RC | |
| Velocity width measured at the 50% level of peak intensity on each side of the HI profile |
Note. — Throughout this work, radii are expressed in arcsec and velocity widths in km s-1. The corrections applied to optical and radio widths are discussed in §2.
| (=/) | RCs | |
|---|---|---|
| = 5.21 +22.46 4.88 | all | |
| / | = 1.004 +0.058 0.012 | all |
| / | = 0.899 +0.118 | rising |
| / | = 1.075 0.013 | flat |