Boolean network model predicts cell cycle sequence of fission yeast
Abstract
A Boolean network model of the cell-cycle regulatory network
of fission yeast (Schizosaccharomyces Pombe)
is constructed solely on the basis of the known
biochemical interaction topology. Simulating the model in the
computer, faithfully reproduces the known sequence of
regulatory activity patterns along the cell cycle of the living cell.
Contrary to existing differential equation models, no parameters
enter the model except the structure of the regulatory circuitry.
The dynamical properties of the model indicate that the
biological dynamical sequence is robustly implemented in
the regulatory network, with the biological stationary state G1
corresponding to the dominant attractor in state space, and with
the biological regulatory sequence being a strongly attractive trajectory.
Comparing the fission yeast cell-cycle model to a similar model
of the corresponding network in S. cerevisiae, a remarkable
difference in circuitry, as well as dynamics is observed. While
the latter operates in a strongly damped mode, driven
by external excitation, the S. pombe network represents
an auto-excited system with external damping.
Keywords: Gene regulatory network; yeast cell cycle; Boolean
network models; computer simulations; robustness
Introduction
Predicting the dynamics of complex molecular networks that control living organisms is a central challenge of systems biology. While cell-wide, or organism-wide, models of genetic and molecular interactions appear well out of reach, predictive models of single pathways and small modular molecular networks of living cells have been studied with great success and are a matter of active research Gunsalus2005 ; Hasty2001 ; Riel2006 ; Smolen2000 .
Given that the biochemical details of a chemical molecular network are known, standard techniques are at hand for their computer simulation. A method capturing molecular details is to use chemical Monte-Carlo simulations Gillespie1976 ; Gillespie1977 , less computationally costly and perhaps the most commonly used approach to modeling biochemical pathways and networks are differential equations which capture the underlying reaction kinetics in terms of rates and concentrations Glass1973 . This method is highly developed today and is broadly applied to predictive dynamical modeling from single pathways to complex biochemical networks Tyson2003 .
Such mathematical models contain detailed information about the time evolution of the system which, in some circumstances, is more than we are interested in. For many biological questions, knowledge of the sequential pattern of states of the central control circuit of a cell would be a sufficient answer, as, for example, in cell cycle progression, cell commitment (e.g. to apoptosis), and in stem cell control and differentiation. When we are interested in the path that a cell takes, the exact time course of the control circuit dynamics may not be needed, however, its modeling takes most effort and often one needs to know large numbers of biochemical parameters that are not easily obtained Sveiczer2000 ; Tyson2001a .
Indeed, recent research indicates that some molecular control networks are so robustly designed that timing is not a critical factor Braunewell2006 . Vice versa, as a working hypothesis, this observation bears the chance for vastly simplified dynamical models for molecular networks, as soon as one drops the requirement for accurate reproduction of timing by the model, just asking for the sequence of dynamical patterns of the network. Recent studies demonstrate, that such more simplified models indeed can reproduce the sequence of states in biological systems. For example, a class of discrete dynamical systems with binary states, mathematically similar to models used in artificial neural networks, has recently proven to predict specific sequence patterns of expressed genes as observed in living cells Albert2003 ; Li2004 .
Such models are in the mathematical tradition of random Boolean networks which, for decades, served as a simplistic analogy for how gene regulation networks could in principle work Kaufmann . In these historical studies, dynamical properties of random networks of discrete dynamical elements were studied to derive possible properties of (the then hardly known) regulatory circuits Kauffman1993 . In the new approach outlined above, however, similar mathematical elements now serve to simulate one specific known biological control network. From a different perspective, they can be viewed as a further simplification of the differential equation approach Bornholdt2005 . Recent application of this model class to modeling real biological genetic circuits show that they can predict expression pattern sequences with much less input (e.g. parameters) to the model as the classical differential equations approach. Examples are models of the genetic network of A. thaliana Espinosa-Soto2004a ; Mendoza1999 ; Thum2003 , the cell-cycle networks of S. cerevisiae Li2004 and of the mammalian cell-cycle Faure2006 , as well as the segment polarity gene network in D. melanogaster Albert2003 ; Sanchez2001 .
For example, the model by Albert and Othmer Albert2003 of the segment polarity gene network in D. melanogaster, as well as the model by Li et al. Li2004 of the S. cerevisiae cell-cycle control network, yield accurate predictions of sequential expression patterns, previously not obtained from such a simple model class. In these models, the dynamics can be viewed in terms of flow in state space of possible states of the network, converging towards so-called attractors, or fixed points, which here correspond to specific biological states. These attractors and their basins of attraction in state space mainly depend on the circuitry of the network, and their analysis yields further information about the robustness of the dynamics against errors or mutations.
How generic is this approach? In this article we address the question whether the approach of discrete dynamical network models is a more general method, namely whether constructing predictive dynamical models for gene regulation from Boolean networks is a straightforward procedure that generalizes to other organisms. We choose the fission yeast (Schizosaccharomyces Pombe) cell-cycle as an example system that on the one hand is well understood in terms of conventional differential equation models, but on the other hand is markedly different from the above examples, as S. cerevisiae. S. Pombe has been sequenced in 1999 and has been used as a model organism only relatively recently Forsburg . Models exist Novak1997 ; Novak2001 that mathematically model the fission yeast cell-cycle with a common ODE (ordinary differential equation) approach. These are based on a set of differential equations for the biochemical concentrations that take part in the network and their change in time (and space). This approach allows to predict the dynamics of the fission yeast cell-cycle for the wild-type and some known mutant cells Tyson2001a ; Tyson2002b .
We will in the following construct a discrete dynamical model for the fission yeast cell cycle network. An interesting question will be, how far we will get without considering parameters, as kinetic constants etc., that are a key ingredient of the existing models. We will base our model on the circuitry of the known biochemical network, only. Let us in the next section briefly review the fission yeast cell cycle network, then define our discrete dynamical model in the subsequent section. This is followed by a section reporting our results, and then we will compare our findings with a similar model of the budding yeast (S. cerevisiae) network and conclude with a discussion.
The fission yeast cell cycle network
Let us briefly review the regulatory processes that control the cell cycle in Saccharomyces Pombe. The full process of one cell division consists of four stages, named G1–S–G2–M. At the first stage (G1), the cell grows and, under specific conditions, commits to division. At the second stage (S), DNA is synthesized and chromosomes are replicated. This is followed by a ”gap” stage G2. The final stage (M) corresponds to mitosis, in which chromosomes are separated and the cell divides itself. Eventually, after the M stage, the cell enters G1 again, thereby completing one cycle.
The biochemical reactions that form the network that controls the fission yeast cell-cycle have been studied in detail over the last years Novak2001 ; Buck2003 ; Correabordes1995 ; Jaspersen1999 ; Lundgren1991 ; Martin-Castellanos1996 ; Russel1987 ; Visintin1998 ; Yamaguchi2000 . The major role is played by a cyclin-dependent protein kinase complex Cdc2/Cdc13 with a protein Tyr-15, a residue of Cdc2. Tyr-15 acts as a label for high Cdc2/Cdc13 concentration. It is inactive during the G2 phase, when Cdc2/Cdc13 is phosphorylated, and becomes active during the G2–M transition Novak2001 ; Tyson2002b . The other members that participate in the cell-cycle control can be attributed to two different classes. The first class consists of positive regulators of the kinase Cdc2/Cdc13: ”Start kinase” (SK), a group of Cdk/cyclin complexes (Cdc2 with Cig1, Cig2 and Puc1 cyclins), and the phosphatase Cdc25. A second class is composed of the antagonists of the complex Cdc2/Cdc13: Slp1, Rum1, Ste9, and the phosphatase PP Sveiczer2000 .
We give a full compilation of the network of key-regulators of the fission yeast cell cycle network in Table 1, corresponding to our current knowledge as given in Sveiczer2000 ; Novak2001 ; Tyson2002b .
| Parent node | Daughter node | Rule of activation (comments) | Rule of inhibition (comments) |
|---|---|---|---|
| Start node | Starter Kinases (SK): Cdc2/Cig1, Cdc2/Cig2, Cdc2/Puc1 | Starter kinases, take part in first transition G1/S, +1 Sveiczer2000 . | |
| SK | Ste9, Rum1 | Phosphorylate, thereby inactivate, -1 Sveiczer2000 ; Tyson2002b | |
| Cdc2/Cdc13 | Cdc25 | Cdc25 is phosphorylated thereby activated, +1 Sveiczer2000 . | |
| Wee1, Mik1 | Tyr15 | Phosphorylate, inactivating, -1 Sveiczer2000 | |
| Rum1 | Cdc2/Cdc13 | Binds and inhibits activity, -1 Cdc2/Cdc13 Sveiczer2000 . | |
| Cdc2/Cdc13 | Rum1 | Phosphorylates and thereby targets Rum1 for degradation. -1 Sveiczer2000 ; Tyson2002b | |
| Ste9 | Cdc2/Cdc13 | Labels Cdc13 for degradation Tyson2002b ; Sveiczer2000 , -1. | |
| Tyr15, Cdc2/Cdc13 | Slp1 | Highly activated Cdc2/Cdc13 activates Slp1, Tyr15 has to be active, too Novak2001 ; Sveiczer2000 +1. | |
| Slp1 | Cdc2/Cdc13 | Promotes degradation of Cdc13, thereby the activity of Cdc2/Cdc13 drops -1 Sveiczer2000 | |
| Slp1 | PP | Activates, +1 Sveiczer2000 | |
| PP(Unknown phosphatase) | Ste9, Rum1, Wee1, Mik1 | Activates Rum1, Ste9, and the tyrosine-modifying enzymes (Wee1, Mik1, Sveiczer2000 , +1 | |
| Cdc25 | Tyr15 | Cdc25 reverses phosphorylation of Cdc2, thereby Tyr15 becomes active, +1 Sveiczer2000 ; Novak2001 | |
| Wee1, Mik1 | Tyr15 | Phosphorylates, thereby inactivating, -1 Novak2001 | |
| PP | Cdc25 | inhibits, Sveiczer2000 -1 |
Also our translation into an interaction graph with activating and inhibiting links is given in the table, which is the starting point for our discrete dynamical network simulation of this network. Let us in the next section define the discrete dynamics that we will simulate on this graph.
A discrete dynamical model of the cell cycle network
We assume proteins to be the nodes of the network and assign a binary value to each node , denoting whether the protein is present or not (due to different possible biochemical mechanisms, as, e.g., gene expression of a corresponding protein, or fast biochemical reactions as phosphorylization). The interactions between the nodes, as compiled in Table 1, are denoted as links, or arrows, see Figure 1.
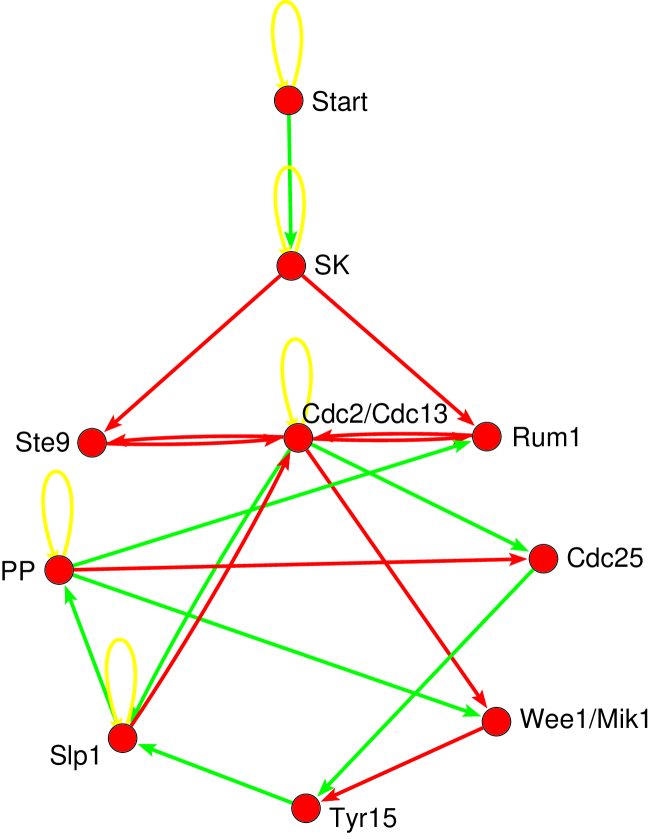
We do not quantify any interaction strength, except whether a link is present or not, and whether it is activating or inhibiting. Again, different biochemical mechanisms are subsumed under this simplified picture, as, e.g., transcriptional regulation, or faster enzymatic interactions. The dynamics of the nodes are updated (in parallel) in discrete time steps according to the following rule:
| (1) |
where for an activating interaction (green link) from node to node , and for an inhibiting (red) link from node to node , and for no interaction at all. This definition follows closely the approach in Li2004 . The dramatic simplification steps in constructing this model consist in not differentiating between absolute values of interaction strengths on the one hand, and not distinguishing between the different time scales of the biochemical interactions involved on the other. This corresponds to dropping all biochemical parameter values, time constants as well as binding constants, from the differential equation models. As we will see below, dynamical models on networks can be built to be insensitive to these parameters, provided that the interaction topology has certain properties.
Two of the ten proteins included in the model exhibit a slightly different activation behavior, which we account for by the two following rules (which alternatively could be incorporated into the above equations as a non-zero activation threshold). Slp1 is only activated by a highly active complex Cdc2/Cdc13, which corresponds to both active Cdc2/Cdc13 as well as active Tyr15, since Tyr15 labels the level of activity of Cdc2. This mechanism acts as a barrier for entering mitosis. The second special rule is to add ”self-activation” (corresponding to adding a negative activation threshold) to the node Cdc2/Cdc13, as it is otherwise not positively regulated.
We also follow Li2004 by adding ”self-degradation” (yellow loops) to those nodes that are not negatively regulated by others, representing the continuous degradation of proteins in the cell, which corresponds to .
Nodes, that have the same function as, for example, Wee1/Mik1 and SK (Cdc2/Cig1, Cdc2/Cig2, Cdc2/Puc1) are joined together in a single node (see Figure 1), as it does not make a difference in the specific mathematical model dynamics considered here.
Finally let us define the initial condition of the model at the start of the simulation, which is chosen to correspond to the biological start condition, i.e. all nodes being in the OFF (inactive) state, except for the proteins Start, Ste9, Rum1, and Wee1/Mik1 Tyson2002b .
Results
Simulation of the fission yeast cell cycle
Let us first consider the time evolution of the proteins of the dynamical model described above. Let us run the cell-cycle model by exciting the G1 stationary state with the cell size signal (”Start” node). This initiates a sequence of network activation states (”expression patterns”) that, eventually, return to the G1 stationary state. The temporal evolution of the protein states is presented in Table 2,
| Time Step | Start | SK | Cdc2 /Cdc13 | Ste9 | Rum1 | Slp1 | Tyr15 | Wee1 Mik1 | Cdc25 | PP | Phase | comments |
| 1 | 1 | 0 | 0 | 1 | 1 | 0 | 0 | 1 | 0 | 0 | START | Cdc2/Cdc13 dimers are inhibited, antagonists are active. |
| 2 | 0 | 1 | 0 | 1 | 0 | 0 | 0 | 1 | 0 | 0 | G1 | SK are becoming active |
| 3 | 0 | 0 | 0 | 0 | 0 | 0 | 0 | 1 | 0 | 0 | G1/S | When Cdc2/Cdc13 and SK dimers switch off Rum1 and Ste9/APC, the cell passes ’Start’ and DNA replication takes place, Cdc2/Cdc13 starts to accumulate |
| 4 | 0 | 0 | 1 | 0 | 0 | 0 | 0 | 1 | 0 | 0 | G2 | Activity of Cdc2/Cdc13 achieves moderate level, which is enough for entering G2 phase but not mitosis, since Wee1/Mik1 inhibits the residue of Cdc2–Tyr15 |
| 5 | 0 | 0 | 1 | 0 | 0 | 0 | 0 | 0 | 1 | 0 | G2 | moderate activity Cdc2/Cdc13 activates Cdc25 |
| 6 | 0 | 0 | 1 | 0 | 0 | 0 | 1 | 0 | 1 | 0 | G2/M | Cdc25 reverses phosphorylation, removing the inhibiting phosphate group and activating Tyr15 |
| 7 | 0 | 0 | 1 | 0 | 0 | 1 | 1 | 0 | 1 | 0 | G2/M | Cdc2/Cdc13 reaches high activity level sufficient to activate Slp1/APC (Cdc2/Cdc13 and Tyr15 are both active) and cell enters mitosis |
| 8 | 0 | 0 | 0 | 0 | 0 | 1 | 1 | 0 | 1 | 1 | M | Slp1 degrades Cdc13 and activates unknown phosphase |
| 9 | 0 | 0 | 0 | 1 | 1 | 0 | 1 | 1 | 0 | 1 | M | Antagonists of Cdc2/Cdc13 are reset |
| 10 | 0 | 0 | 0 | 1 | 1 | 0 | 0 | 1 | 0 | 0 | G1 | Cdc13 is degraded, Cdc2 thereby downregulated, cell reaches G1 stationary state |
where one observes a sequence of states which exactly matches the corresponding biological expression pattern along the cell-cycle, from the excited G1 state (START) through S and G2 to the M phase and finally back to the stationary G1 state. It corresponds to the biological time sequence of the protein states in the cell-cycle control network. This is a remarkable observation as it is unlikely to occur by chance due to the size of the state space.
In the next step we run the model starting from each one of the possible initial states. We find that each initial state flows into one of 15 stationary states (fixed points). The largest attractor belongs to a fixed point attracting of all network states. Our first observation is that this fixed point exactly coincides with the biological G1 stationary state (see Table 3) of the cell.
| Attractor | Basin size | Start | SK | Cdc2/Cdc13 | Ste9 | Rum1 | Slp1 | Tyr15 | Wee1/Mik1 | Cdc25 | PP |
| 1 | 788 | 0 | 0 | 0 | 1 | 1 | 0 | 1 | 0 | 0 | 0 |
| 2 | 136 | 0 | 0 | 0 | 0 | 1 | 0 | 0 | 1 | 0 | 0 |
| 3 | 33 | 0 | 0 | 0 | 1 | 0 | 0 | 1 | 0 | 1 | 0 |
| 4 | 28 | 0 | 0 | 0 | 1 | 0 | 0 | 0 | 1 | 0 | 0 |
| 5 | 11 | 0 | 0 | 0 | 1 | 0 | 0 | 0 | 1 | 1 | 0 |
| 6 | 8 | 0 | 0 | 0 | 1 | 0 | 0 | 1 | 1 | 1 | 0 |
| 7 | 6 | 0 | 0 | 0 | 1 | 1 | 0 | 1 | 0 | 1 | 0 |
| 8 | 4 | 0 | 0 | 1 | 0 | 0 | 0 | 1 | 0 | 0 | 0 |
| 9 | 3 | 0 | 0 | 0 | 0 | 1 | 0 | 0 | 0 | 0 | 0 |
| 10 | 2 | 0 | 0 | 0 | 1 | 1 | 0 | 1 | 1 | 1 | 0 |
| 11 | 1 | 0 | 0 | 0 | 1 | 0 | 0 | 0 | 0 | 0 | 0 |
| 12 | 1 | 0 | 0 | 0 | 1 | 0 | 1 | 0 | 0 | 0 | 0 |
| 13 | 1 | 0 | 0 | 0 | 1 | 0 | 0 | 1 | 0 | 0 | 0 |
| 14 | 1 | 0 | 0 | 0 | 1 | 1 | 0 | 0 | 0 | 0 | 0 |
| 15 | 1 | 0 | 0 | 0 | 1 | 1 | 0 | 1 | 0 | 0 | 0 |
Thus, the biological target state is the dominant attractor of the network dynamics. As soon as the system reaches this state with the specific corresponding combination of active and inactive proteins, it stays there, and is likely to do so even in the presence of perturbations.
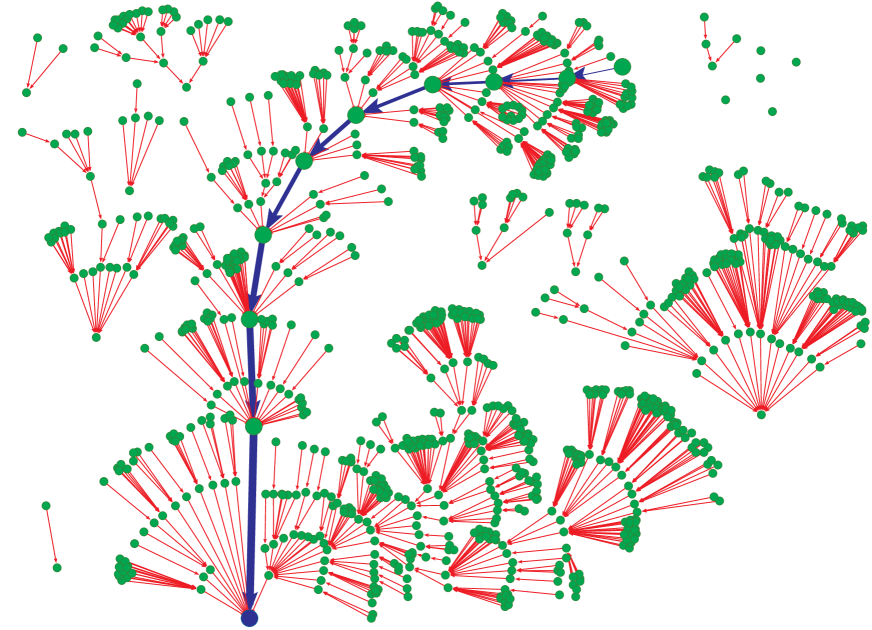
A further observation is best depicted by Figure 2, showing the dynamical flow of the network states, and how it converges towards the biological fixed point. In this figure, the dynamical trajectories in the state space starting from all 1024 possible initial states of the network are shown. Each network state is represented by a dot, with the arrows between them indicating the dynamical transition from one state to its temporally subsequent state. At the root of the largest attractor (tree) the G1 state is found and the blue arrows show the biological time sequence that leads to it. This attractor tree consists of of all network states.
We further performed a robustness test by reversing the state of a single, randomly chosen node while the network proceeds through the biological sequence. This deviation from the biological pathway by the activity state of one single protein at one randomly chosen step of the cycle, the system returns to the fixed point G1 in 90 out of 100 possible cases. Thus we observe an additional robustness in the fission yeast cell-cycle network, meaning that there is an increased probability to stay in the attractor basin of the biological fixed point when perturbing states along the biological trajectory.
An immediate question about the specific network structure considered here is whether the architecture of the network has special properties as, for example, traces of being optimized by biological evolution. We compare the network dynamics to the null model of random networks with the same number of inhibiting and activating links, self-degrading and self-activating nodes and the same activation thresholds. Indeed one finds that the corresponding random networks typically have smaller attractors. The mean size of the biggest attractors is about of all initial states (averaged over 1000 random networks). This may indicate that attractor basin size of the biological attractor is optimized, possibly in order to provide additional dynamical robustness.
Comparison with S. cerevisiae
The two yeasts, S. cerevisiae and S. pombe, are remarkably different cells and a comparison may provide insights relevant for the understanding of higher eukaryotic organisms. As we now have discrete dynamical models for the cell cycle network of both of them at hand (this work, as well as Li2004 ), let us discuss how they compare.
As these two organisms are closely related genetically, one might expect a large overlap also in the biochemical control machinery. On the other hand, the biology of the two is markedly different, so there have to be some differences on the biochemical level as well. As an overview, the second model is shown in Figure 3.

There are a number of closely related genes (see Table 4) between the two yeasts Tyson2001a which, however, can have vastly differing functions Forsburg .
| Fission yeast | Rum1 | Ste9 | Slp1 | Cdc2 | Cdc13 |
| Budding yeast | Sic1 | Cdh11 | Cdc20 | Cdc28 | Clb1-6 |
In fission yeast, for example, phosphatase Cdc25 is required for the G2–M transition, while in the model of budding yeast Li2004 the corresponding homologue Mih1 is insignificant. The reason is that in the fission yeast cell cycle, Cdc25 removes an inhibitory phosphate group from the residue Tyr-15 of Cdc2, which is important for the right timing of the G2–M transition. In contrast, the tyrosine residue in S. cerevisiae Cdc28 kinase (fission yeast: Cdc2) is not as critical and usually not phosphorylated. Therefore, for a model of fission yeast, Cdc25 is essential, whereas the homologue Mih1 in budding yeast is not Li2004 . One other example is the role of the protein Cdc13. In fission yeast it acts in a complex with Cdc2, while in the budding yeast model its functionality is represented by two complexes Clb1,2/Cdc28 and Clb5,6/Cdc28, which exhibit some differences in interactions, as well as in timing.
Despite of the differences in many details, the general logic of both yeast cell cycles is surprisingly similar and exhibits a number of ”structural homologues”. For example both exhibit a negative feedback loop similar in role: Clb1,2/Cdc28 activates Cdc20 which inhibits Clb1,2/Cdc28 (fission yeast: Cdc2/Cdc13, Tyr15 activate Slp1,which inhibits Cdc2/Cdc13).
The most interesting comparison is in our view on the level of the global network dynamics. From this point of view, the S. cerevisiae network is a strongly damped system, driven by external excitation. External signals are entering the network, triggering signal cascades in the network that induce the subsequent phases. In contrast, the network of S. pombe corresponds to an auto-excited system (there are two nodes with self-excitation - Cdc2/Cdc13 and Wee1/Mik1) with additional damping. Here, an external signal works as a trigger mechanism that counteracts internal damping, causing the auto-excitation to spread its activity in the system.
While these differences in the ”mechanics” of the signalling networks are considerable, the overall dynamics is surprisingly similar. The state space picture is quite similar in both cases: one observes only a small number of attractors and just one big global attractor (with resp. of all initial states) which for both organisms corresponds to the stationary G1 state.
Finally, a most prominent difference between the two yeast networks is their choice in biochemical machinery: S. cerevisiae relies more on transcriptional factors while S. pombe mostly relies on post-translational regulation Simanis2003 . From the methodological point of view, we note that for this reason we were surprised to find our model for the S. pombe cell cycle network so robust against neglecting the vastly different time scales of interactions, which we expected to be the major difficulty in constructing a discrete dynamical model for S. pombe as compared to S. cerevisiae.
Discussion
We have constructed a Boolean model for the biochemical network that controls the cell cycle progression in fission yeast S. pombe, and found a number of interesting results. The dynamics of this network reproduces the time sequence of expression patterns along the biological cell cycle, solely on the basis of the connectivity graph of the network, neglecting all biochemical kinetic parameters. The dynamics of the network is characterized by a dominant attractor in the space of all possible states, with an attractor basin that attracts most of all states. The network dynamics are robust against perturbation of the biological expression pattern.
The results obtained from our model are in accordance with the existing ODE model of fission yeast Tyson2001a . Let us discuss the differences between these two approaches. The S. pombe ODE system Tyson2001a has several steady state solutions. One can identify every such solution with the corresponding physiological stage. The growth of cell size brings the cell from one phase to another via a series of bifurcations. At the same time, other variables indicate the degree of activity of various components of the cell regulatory nodes. One observes Tyson2002b that the typical curves depicting this activity have almost rectangular shape. This motivates our choice of binary valued function to approximate protein concentrations in time. Further, the ODE-based model makes use of continuous system parameters, which we omit and replace by their signs, only. As a result, the ODE bifurcation curve then corresponds to the Boolean biological path. The main advantage of our Boolean model is that we were able to drop 47 kinetic constants that were necessary in the ODE approach and, while doing so, still reproduce the biological activation pattern of the system.
This fact and our further observations point at built-in dynamical robustness of the network, which may provide a further mechanism for organisms to ensure functional robustness Alon1999 . In return, our study indicates that the regulatory robustness of biological chemical networks may allow for ”robust” modeling approaches: Our paradigm here is nothing but assuming that biochemical networks are functioning in a parameter-insensitive way — which motvated us to eliminate all tunable parameters from the model. That our model reproduces the biological sequence instantly without any further parameter tuning, confirms our assumption a posteriori. We therefore encourage further modeling experiments with the here presented quite minimalistic approach, as it may prove a quick approach to predicting biologically relevant dynamical features of genetic and protein networks in the living cell.
References
- (1) Gunsalus KC, Ge H, Schetter AJ, Goldberg DS, Han J-DJ et al (2005) Predictive models of molecular machines involved in Caenorhabditis elegans early embryogenesis. Nature 436 (11): 861-865.
- (2) Hasty J, McMillen D, Isaacs F, Collins JJ (2001) Computational studies of gene regulatory networks: in numero molecular biology. Nat Rev Genet 2: 268-279.
- (3) Riel NAW (2006) Dynamic modelling and analysis of biochemical networks: mechanism-based models and model-based experiments. Briefings in Bioinformatics 7(4): 364-374.
- (4) Smolen P, Baxter DA, Byrne JH (2000) Mathematical modeling of gene networks. Neuron 26: 567-580.
- (5) Gillespie DT (1976) A general method for numerically simulating the stochastic time evolution of coupled chemical reactions, J Comp Phys 22: 403-434.
- (6) Gillespie DT (1977) Exact stochastic simulation of coupled chemical reactions. J Phys Chem 81: 2340-2361.
- (7) Glass L, Kauffman SA (1973) The logical analysis of continuous, nonlinear biochemical control networks. J Theor Biol 39: 103-129.
- (8) Tyson JJ, Chen KC, Novak B (2003) Sniffers, buzzers, toggles and blinkers: dynamics of regulatory and signaling pathways in the cell. Curr Op Cell Biol 15: 221-231.
- (9) Sveiczer A, Csikasz-Nagy A, Gyorffy B, Tyson JJ, Novak B (2000) Modeling the fission yeast cell cycle: Quantized cycle times in wee1-cdc25 mutant cells. Proc Natl Acad Sci U S A 97(14): 7865-7870.
- (10) Tyson JJ, Chen KC, Novak B (2001) Network dynamics and cell physiology. Nature Rev Mol Cell Biol 2: 908-916.
- (11) Braunewell S, Bornholdt S (2006) Superstability of the yeast cell-cycle dynamics: Ensuring causality in the presence of biochemical stochasticity. J Theor Biol 245(4): 638-643.
- (12) Albert R, Othmer HG (2003) The topology of the regulatory interactions predicts the expression pattern of the Drosophila segment polarity genes. J Theor Biol 223: 1-18.
- (13) Li F, Long T, Lu Y, Quyang Q, Tang C (2004) The yeast cell-cycle network is robustly designed. Proc Natl Acad Sci U S A 101(14): 4781-4786.
- (14) Kauffmann SA (1969) Metabolic stability and epigenesis in randomly constructed genetic nets. J Theor Biol 22: 437-467.
- (15) Kauffman, SA (1993) The Origins of Order: Self-Organization and selection in evolution. Oxford, UK: Oxford University Press.
- (16) Bornholdt S (2005) Systems biology: Less is more in modeling large genetic networks. Science 310 (5747): 449-451.
- (17) Espinosa-Soto C, Padilla-Longoria P, Alvarez-Buylla ER, (2004) A gene regulatory network model for cell-fate determination during Arabidopsis Thaliana flower development that is robust and recovers experimental gene expression profiles. Plant Cell 16: 2923-2939.
- (18) Mendoza L, Thieffry D, Alvarez-Buylla ER, (1999) Genetic control of flower morphogenesis in Arabidopsis Thaliana: a logical analysis. Bioinformatics 15: 593-606.
- (19) Thum KE, Shasha DE, Lejay LV, Coruzzi GM (2003) Light- and carbonsignaling pathways. Modeling circuits of interactions. Plant Physiol 132: 440-452.
- (20) Faure A, Naldi A, Chaouiya C, Thieffry D (2006) Dynamical analysis of a generic Boolean model for the control of the mammalian cell cycle. Bioinformatics 22(14): e124-e131.
- (21) Sanchez L, Thieffry D, (2001) A logical analysis of the drosophila gap-gene system. J Theor Biol 211: 115-141.
- (22) Forsburg SL (1999) The best yeast? Trends in Genetics 15 (9): 340-344.
- (23) Novak B, Tyson JJ (1997) Modeling the control of DNA replication in fission yeast. Cell biology. Proc Natl Acad Sci U S A 94: 9147-9152.
- (24) Novak B, Pataki Z, Ciliberto A, Tyson JJ (2001) Mathematical model of the cell division cycle of fission yeast. Chaos 11(1): 277-286.
- (25) Tyson JJ, Csikasz-Nagy A, Novak B (2002) The dynamics of the cell-cycle regulation. BioEssays 24: 1095-1109.
- (26) Buck V, Ng SS, Ruiz-Garcia1 AB, Papadopoulou K, Bhatti S et al. (2003) Fkh2p and Sep1p regulate mitotic gene transcription in fission yeast J Cell Science 116: 4263-4275.
- (27) Correabordes J, Nurse P (1995) P25(rum1) orders s-phase and mitosis by acting as an inhibitor of the p34(cdc2) mitotic kinase. Cell 83: 1001-1009.
- (28) Jaspersen S, Charles J, Morgan D (1999) Inhibitory phosphorylation of the APC regulator Hct1 is controlled by the kinase Cdc28 and phosphatase Cdc14. Curr Biol 9: 227-236.
- (29) Lundgren K, Walwortha N, Booherb R, Dembskia M, Kirschnerb M, et al (1991) Mik1 and wee1 cooperate in the inhibitory tyrosine phosphorylation of cdc2. Cell 64(6): 1111-1122.
- (30) Martin-Castellanos C, Labib K, Moreno S (1996) B-type cyclins regulate G1 progression in fission yeast in opposition to the p25rum1 cdk inhibitor. J EMBO 15(4): 839-849.
- (31) Russel P, Nurse P, (1987) Negative regulation of mitosis by wee1[+], a gene encoding a protein kinase homologue. Cell 49: 559-567.
- (32) Visintin R, Craig K, Hwang ES, Prinz S, Tyers M. et al. (1998) The phosphatase Cdc14 triggers mitotic exit by reversal of Cdk-dependent phosphorylation. Mol Cell 2: 709-718.
- (33) Yamaguchi S, Okayama H, Nurse P (2000) Fission yeast Fizzy-related protein srw1 is a G1-specific promoter of mitotic cyclin B degradation. J EMBO 19(15): 3968-3977.
- (34) Simanis V, (2003) Events at the end of mitosis in the budding and fission yeasts. J Cell Sci 116: 4263-4275.
- (35) Alon U, Surette MG, Barkai N, Leibler S (1999) Robustness in bacterial chemotaxis. Nature 397: 168-171.