Stirring the Embers: High Sensitivity VLBI Observations of GRB 030329
Abstract
We present high sensitivity Very Long Baseline Interferometry (VLBI) observations 806 days after the -ray burst of 2003 March 29 (GRB 030329). The angular diameter of the radio afterglow is measured to be mas, corresponding to pc at the redshift of GRB 030329 (). The evolution of the image size favors a uniform external density over an wind-like density profile (at distances of cm from the source), although the latter cannot be ruled out yet. The current apparent expansion velocity of the image size is only mildly relativistic, suggesting a non-relativistic transition time of yr. A rebrightening, or at least a significant flattening in the flux decay, is expected within the next several years as the counter-jet becomes visible (this has not yet been observed). An upper limit of is set on the proper motion of the flux centroid.
1 Introduction
Our understanding of the origin of gamma-ray bursts (GRBs) has advanced rapidly in recent years since the first X-ray (Costa et al. 1997), optical (van Paradijs et al. 1997) and radio (Frail et al. 1997) afterglows were discovered. We now know that a GRB represents the quick (s) release of a large amount of energy – about erg, when corrected for jet collimation (Frail et al. 2001; Bloom, Frail & Kulkarni 2003). The prompt -ray emission is usually attributed to internal shocks due to variability within the ultra-relativistic outflow (with a Lorentz factor ), while the afterglow is from a strong relativistic shock that is driven into the external medium as it decelerates the ejecta (for a review see Piran 2005). The afterglow emission is predominantly synchrotron radiation, and its spectral and temporal evolution (Sari, Piran & Narayan 1998; Granot & Sari 2002) are governed by such factors as the structure and dynamical evolution of the relativistic jet (for a review see Granot 2006), and the environment (e.g., constant density versus a wind-like density profile; Chevalier & Li 2000) which are not well constrained.
GRB 030329, discovered by HETE-2 (Vanderspek et al. 2003), and localized rapidly in the optical bands by Peterson & Price (2003) represents a unique opportunity for VLBI observations. At a redshift of (Greiner et al. 2003) this is the second nearest cosmological burst in the northern sky detected to date (only GRB 060218 is nearer at a redshift , Mirabal & Halpern 2006). Observation with the VLA show the GRB 030329 radio afterglow to be the brightest detected to date, with a maximum flux density of 55 mJy at 43 GHz one week after the burst (Berger et al. 2003).
Most VLBA studies so far have been restricted to rather distant GRBs (). While these observations have proved to be invaluable in studying the flux evolution of the afterglow and providing accurate positions (in one case localizing the GRB within 0.3 kpc of the center of its radio host galaxy; Berger et al. 2001), in all cases the afterglow faded before it could be resolved by the VLBA. In the case of GRB 030329 we have an exceptional instance of a radio afterglow near and bright enough that it can be resolved with VLBI. Its exceptional brightness enables the radio afterglow to be studied for much longer times than has been typical.
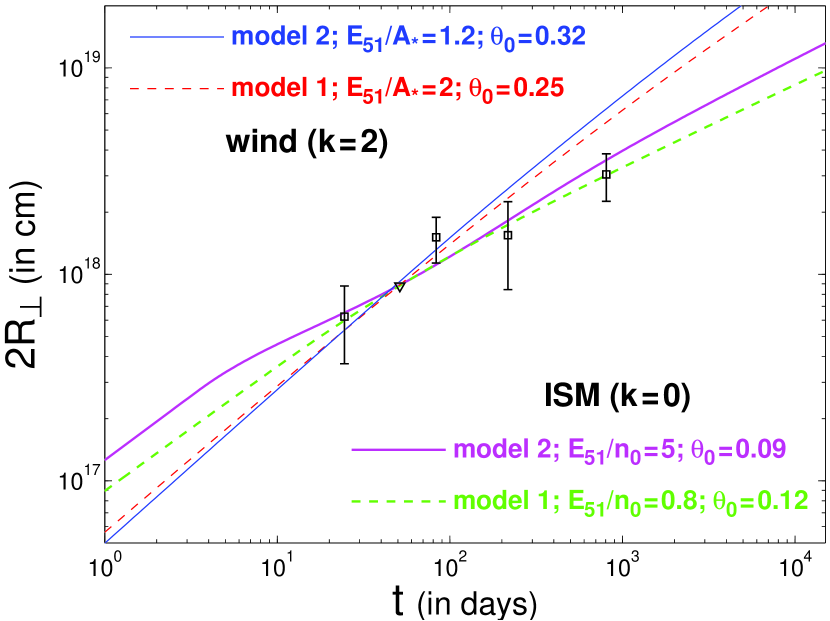
The VLBA campaign on GRB 030329 (Taylor et al. 2004, 2005) resolved the afterglow image and showed an increase in its diameter from as at days after the burst to as at days. Only slow growth was seen out to days when the diameter was measured to be as, possibly indicating a transition to non-relativistic expansion. Here we present very late time observations of GRB 030329 that were performed at days after the burst with the goal of differentiating between afterglow models, and constraining the jet structure and dynamics as well as the environment. Such observations can also test the hypothesis of a double-sided jet, which would imply a significant contribution from the counter-jet as the flow becomes sub-relativistic at late times.
Assuming a cosmology with , and , the angular-diameter distance of GRB 030329 at is Mpc, and 1 milliarcsec corresponds to 2.85 pc.
2 Observations
2.1 Late Time VLBI Observations
Late time observations require high sensitivity to detect the fading afterglow. To achieve this high sensitivity we employed the largest aperture radio telescopes available, and used a bandwidth of MHz in two circular polarizations. The VLBI observations were taken at GHz on 2005 June 12, days after the burst, with a global array including the m Green Bank Telescope (GBT) of the NRAO111The National Radio Astronomy Observatory is operated by Associated Universities, Inc., under cooperative agreement with the National Science Foundation., the Effelsberg m telescope222The m telescope at Effelsberg is operated by the Max-Planck-Institut für Radioastronomie in Bonn., the m Arecibo telescope333The Arecibo Observatory is part of the National Astronomy and Ionosphere Center, which is operated by Cornell University under a cooperative agreement with the National Science Foundation., the Westerbork (WSRT) tied array444The Westerbork Synthesis Radio Telescope is operated by the ASTRON (Netherlands Foundation for Research in Astronomy) with support from the Netherlands Foundation for Scientific Res earch (NWO), and the m MarkII telescope of Jodrell Bank555Jodrell Banks Observatory’s VLBI participation is hosted by the national Facility of the Particle Physics and Astronomy Research Council (PPPARC) (replaced from the initially scheduled Lovell telescope due to the fast source-switching phase-reference schedule). In all, the combined effective collecting area is . The on-source time on GRB 030329 was hr for all telescopes except for Arecibo (hr). Data were recorded at and 2-bit sampling at all stations except for Green Bank, where data were recorded at and 1-bit sampling. The correlator saw the Green Bank data as 2-bit data, with the magnitude bit always set to high. The post-correlation 2-bit van Vleck correction thereafter processed the data as usual. The observations were correlated at the Joint Institute for VLBI in Europe (JIVE).
The nearby (0.8∘) source J1048+2115 was used as the phase-reference calibrator, and was observed regularly in a cycle of 2 minutes on the target and 1 minute on the calibrator. Since J1048+2115 is not tied to the International Celestial Reference Frame (ICRF), the ICRF source J1051+2119 was observed every 30 minutes. This allowed an accurate determination of the position of the phase-reference source and subsequently the target. Self-calibration solutions for the amplitude were transferred from the stronger J1051+2119 calibrator, which corrected for a large amplitude offset affecting all the left hand circular polarization IFs of the MarkII telescope. In proposing these observations, we aimed for a theoretical noise of around 6 Jy/beam. However, a number of factors resulted in a decreased sensitivity in our final map. These factors includes the replacement of Lovell with the smaller MarkII telescope, and missing or bad data. As a result, a noise of 15 Jy/beam is reached in the final image.
2.2 VLA Observations
Multi-frequency VLA observations of GRB 030329 have been presented (Berger et al. 2003; Frail et al. 2005) between day and yr after the burst. Here we present VLA observations at 5 GHz taken from the NRAO archive between 380 and 740 days after the burst (see Table 1 for more details). The VLA data were reduced in AIPS following standard procedures (Taylor et al. 1999). The nearby (1.6∘ separation) calibrator J1051+213 was used to determine the complex antenna gains. Absolute flux density calibration was tied to short observations of 3C286.
Using this VLA data in combination with published WSRT data (van der Horst et al. 2005), we find that the fall in flux densities from day 59 to day 806 (Fig. 1) are well described by a power law, , with a slope . In the end of 2009, the data recording rate of the VLBA is planned to increase to compared to its current limit of . The inclusion of the VLBA at this recording rate, as well as the large antennas used for this experiment, should provide an increase in sensitivity by a factor , or a theoretical rms noise of Jy. Assuming that GRB 030329 continues to fade in the same way, then we expect a flux density in the end of 2009 (6.6 years after the burst) of Jy. Thus it should be quite practical to follow the growth of GRB 030329 for at least another 3-5 years.
3 Results
We fit a symmetric, two-dimensional circular Gaussian to the measured visibilities on GRB 030329 and find a full-width at half maximum (FWHM) size of mas. As in Taylor et al. (2004) the error on the size is estimated from signal-to-noise ratios and from Monte-Carlo simulations of the data using identical (,) coverage, similar noise properties, and a Gaussian component of known size added. The standard deviation of the recovered sizes, model-fitted in the same way as we treat the observations, was found to be mas. Given two similar estimates of the error, we adopt the more conservative limit of 0.09 mas based on signal-to-noise ratios and the resolution of the observations.
We also obtain a position for GRB 030329 of R.A. 10h44m49.95957s and Dec. 21∘31’17.4375” with an uncertainty of mas in each coordinate.
4 Discussion
4.1 Angular Size Measurements
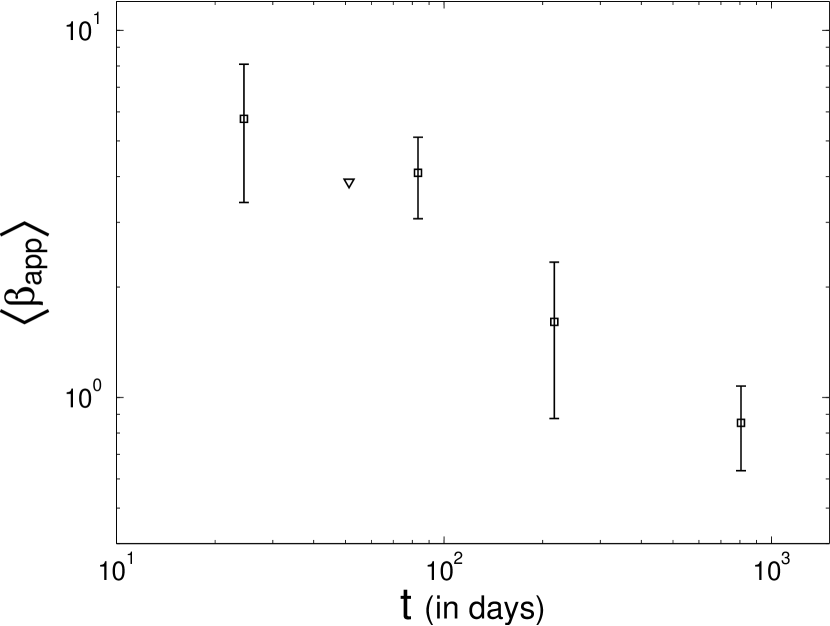
The entire history of expansion for GRB 030329 is shown in Fig. 2. The first measurement at 15 days comes from a model-dependent estimate of the quenching of the scintillation (Berger et al. 2003). The uncertainties on this size estimate are large due to the dependence of the measurement on estimated properties of the interstellar medium along this particular line-of-sight. Furthermore, a limb-brightened image has a smaller effective area (similar to a thin ring) compared to a uniform image of the same diameter. This reduces the effective number of regions within the image with independent brightness variations for a given image diameter. Thus, in a limb-brightened image (as expected here), the image diameter might be under-estimated by a factor larger than that for the fit to a circular Gaussian that is used in the other epochs (see discussion below Eq. 1), thus potentially causing a systematic under-estimate of the source size at days, compared to the other epochs that are shown in Fig. 2.
Our directly measured size of mas at days is a factor of larger than the size of mas measured at days (Taylor et al. 2005), which was quite close to the size of mas measured at days (Taylor et al. 2004). We consider the possibility of no expansion between days 217 and 806, which at a first look at Fig. 2 might be a plausibility. However, the points at 217 and 806 days are separated by , and the edges of the regions just touch each other. At the other extreme, the size could have changed with a factor 4.6. In this case, the slope will be inconsistent with the earlier point at day 84, unless the source increased its expansion speed or shrank in size. We find this implausible, and that an expansion equal to (or slower than) a factor of is more likely.
Adopting measured size increase of a factor of , this implies a continued growth of the image size, and confirms a gradual decrease in its apparent expansion speed, . In Fig. 3 we show the decline of with time, calculated from the measured sizes using
| (1) |
where and are the angular and physical radius of the image, respectively, and is the proper distance to the source. We note that similar to arguments for no expansion in Fig. 2, it could be argued that the apparent expansion speed (Fig. 3) at later times is constant. This would mean that the source size grows linearly with time (i.e. a factor of 3.7 growth between day 217 and 806). As mentioned above, this type of growth requires a rather strange behavior given the point at day 84. Thus, a decrease in the apparent expansion speed seems more reasonable.
The values for the apparent size depend somewhat upon the intrinsic surface brightness profile, which for circular Gaussian, a uniform disk, and a ring, vary roughly as 1:1.6:1.1 (Taylor et al. 2004). In practice, the image is limb-brightened (Granot, Piran & Sari 1999; Granot & Loeb 2001), and perhaps slightly closer to a thin ring than to a uniform disk, suggesting a correction factor of . This correction factor might change with time, since the surface brightness profile within the afterglow image is expected to change across the non-relativistic transition, and possibly also during the post-jet break relativistic stage. However, the afterglow image during both of these stages has not been studied yet in sufficient detail to provide a reliable description of the exact temporal evolution of this correction factor. At any rate, this effect is expected to be fairly mild, and smaller than the factor of growth in the image size between days and days.
Taking this correction factor into account, we find after days, i.e. that the current expansion velocity (which is expected to be somewhat smaller than the average value ) is only mildly relativistic, while at earlier times it was considerably higher and more relativistic, as implied by the value of after days. The non-relativistic transition occurs when , i.e. when , the exact value depending on the detailed expansion history (Granot, Ramirez-Ruiz & Loeb 2005). This suggests a non-relativistic transition time of about yr. Based on a joint temporal and spectral fit to the light curve, Frail et al. (2005) find days, and Resmi et al. (2005) use simultaneous radio, millimeter and optical observations to derive model-dependent non-relativistic transition times of and days. Moreover, multi-frequency radio data presented by van der Horst et al. (2005) is fitted with a days. All these transition times are condsiderably shorter than our estimate. In principle their models could be refined using the direct size estimates presented here to better constrain the energetics of the burst and other physical parameters of the models.
Radio re-brightening of GRB 030329 has been predicted by Granot & Loeb (2003) as the counter jet becomes non-relativistic and its emission is no longer strongly beamed away from us. Li & Song (2004) estimated a level of mJy at GHz, yr after the burst, due to this effect. The actual flux density around that time, however, was times lower than their prediction (mJy at GHz after days, with in the radio, between the two frequencies, implying mJy at GHz). More importantly, we find that the late time GHz light curve, from days and up to days, is consistent with a single power law decay of (see Fig. 1), which implies that up to days after GRB 030329 there is still no significant contribution to the observed flux from the counter jet. Light travel effects might cause the contribution from the counter jet to become significant at a somewhat later time, up to a factor of several after when , i.e. up to several years after the burst (this effect was taken into account by Li & Song 2004, but they estimated a somewhat lower value for of days). Alternatively, if the counter jet encounters a somewhat lower external density than the forward jet, it would become non-relativistic at a later lab frame time, and light travel effects would cause its contribution to the observed flux density to become significant at an even later time (as well as being intrinsically less luminous than the forward jet at the same radius). If such a re-brightening (or at least a significantly shallower flux decay) eventually occurs within the next several years, it may enable measurement of the image size for a longer time.
Fig. 4 demonstrates how the measured evolution of the image size for GRB 030329 compares with the predictions of different theoretical models. The data constrain the external density profile at radii cm, and favor a uniform density external medium ( with ) over a stellar wind environment (, as expected for a massive star progenitor; Chevalier & Li 2000), although it is hard to rule out the latter due to the sizeable errors on the source size, and the theoretical uncertainty in the jet structure and dynamics. The degree of lateral spreading of the jet is harder to constrain, since its effect on the evolution of the observed image size around the times when it was measured is somewhat smaller than that of the external density profile (see Fig. 4).
4.2 Constraints on Proper motions
Solving for proper motion using all the VLBI observations to date, we derive mas yr-1 and mas yr-1, or an angular displacement over days of mas (Fig. 5). These observations are consistent with those reported by Taylor et al. (2004, 2005), and impose an even stronger limit on the proper motion. The implied limit on the proper motion in the plane of the sky is mas (corresponding to pc) in days, or ().
Our new upper limits on the proper motion are about a factor of 2 better than previous limits. The proper motion of the flux centroid is constrained to be less than the current diameter of the image, which is consistent with the expectations for a narrow double sided jet,666The observed image angular diameter around is expected to be , which is a factor of larger than the expected maximal angular displacement of the flux centroid. where the maximal angular displacement of the flux centroid is and is obtained around , where (Granot & Loeb 2003), since for GRB 030329 the viewing angle is within the jet, . This consistency is independent of the value of the jet initial half-opening angle, , which is somewhat controversial (Granot, Nakar & Piran 2003; Berger et al. 2003; Sheth et al. 2003; Piran, Nakar & Granot 2004; Granot 2005; Gorosabel et al. 2006).
5 Conclusions
We present measurements of the GHz flux density and size of the radio afterglow from GRB 030329 over a period of 2.2 years. These observations clearly demonstrate that the expansion velocity has slowed down over time, with a transition to the non-relativistic regime at 1 yr. The evolution of the afterglow image size favors a uniform external density over a wind-like stratified external medium (at cm), although the data still do not enable to conclusively rule out a wind-like density profile (see Fig. 4). We also present a tight upper limit on the apparent motion of the flux centroid (, a factor of 2 better than previous limits), which are consistent with the predictions of standard afterglow theory.
Although GRB 030329 has faded considerably, it is likely that VLBI observations will continue to be useful for determining expansion size estimates in the future. With VLBI recording rates expected to increase to over the next few years, thermal noise levels of the VLBA at 5 GHz should decrease to Jy, and arrays of larger antennas, such as the one used in this work, will reach theoretical thermal noise levels of Jy. This anticipated increase in VLBI capability should keep pace with the flux density of GRB 030329 for the next few years. A rebrightening, or at least a significantly shallower flux decay, is expected within the next several years, as the counter jet begins to significantly contribute to the observed flux. Further VLBI observations should improve constraints on the density profile of the external medium into which the afterglow shock is expanding, and should eventually reveal the shape of the afterglow.
References
- Berger et al. (2003) Berger, E. et al. 2003, Nature, 426, 154
- Berger et al. (2001) Berger, E., Kulkarni, S. R., & Frail, D. A. 2001, ApJ, 560, 652
- Bloom, Frail & Kulkarni (2003) Bloom, J. S., Frail, D. A., & Kulkarni, S. R. 2003, ApJ, 594, 674
- Chevalier & Li (2000) Chevalier, R. A. and Li, Z. 2000, ApJ, 536, 195
- Costa et al. (1997) Costa, E., et al. 1997, Nature, 387, 783
- Frail et al. (1997) Frail, D. A., Kulkarni, S. R., Nicastro, S. R., Feroci, M., and Taylor, G. B. 1997, Nature, 389, 261
- Frail et al. (2001) Frail, D. A., et al., 2001, ApJ, 562, L55
- Frail et al. (2005) Frail, D. A., Soderberg, A. M., Kulkarni, S. R., Berger, E., Yost, S., Fox, D. W., and Harrison, F. A. 2005, ApJ, 619, 994
- Gorosabel et al. (2006) Gorosabel, J., Castro-Tirado, A.J., Ramirez-Ruiz, E., Granot, J., Caon, N., Cairos, L.M., Rubio-Herrera, E., Guziy, S., de Ugarte Postigo, A., and Jelinek, M., 2006, ApJ, 641, L13
- Granot (2006) Granot, J. 2006, to appear in Rev. Mex. Astron. Asrof. (astro-ph/0610379)
- Granot (2005) Granot, J. 2005, ApJ, 631, 102
- Granot, Piran & Sari (1999) Granot, J., Piran, T., and Sari, R. 1999, ApJ, 513, 679
- Granot & Loeb (2001) Granot, J., and Loeb, A. 2001, ApJ, 551, L63
- Granot & Loeb (2003) Granot, J. and Loeb, A. 2003, ApJ, 593, L81
- Granot, Ramirez-Ruiz & Loeb (2005) Granot, J., Ramirez-Ruiz, E., & Loeb, A. 2005, ApJ, 618, 413
- Granot, Nakar & Piran (2003) Granot, J., Nakar, E., & Piran, T. 2003, Nature, 436, 128
- Granot & Sari (2002) Granot, J., & Sari, R. 2002, ApJ, 568, 820
- Greiner et al. (2003) Greiner, J., Peimbert, M., Estaban, C., Kaufer, A., Jaunsen, A., Smoke, J., Klose, S., & Reimer, O. 2003, GRB Coordinates Network, 2020, 1
- Li & Song (2004) Li, Z. & Song, L. M. 2004, ApJ, 614, L17
- Mirabal & Halpern (2006) Mirabel, N., & Halpern, J. P. 2006, GCN GRB Observation Report 7792
- van Paradijs et al. (1997) van Paradijs, J., et al. 1997, Nature, 386, 686
- Peterson & Price (2003) Peterson, B. A., & Price, P. A. 2003, GRB Coordinates Network, 1985, 1
- Piran (2005) Piran, T. 2005, Rev. Mod. Phys., 76, 1143
- Piran, Nakar & Granot (2004) Piran, T., Nakar, E., & Granot, J. 2004, in “Gamma-Ray Bursts: 30 Years of Discovery”, ed. E. E. Fenimore & M. Galassi, AIP Conference Proceedings, Vol. 727, p. 181
- Resmi et al. (2005) Resmi, L., et al. 2005, A&A, 440, 477
- Sari, Piran & Narayan (1998) Sari, R., Piran, T., & Narayan, R. 1998, ApJ, 497, L17
- Sheth et al. (2003) Sheth, K., Frail, D. A., White, S., Das, M., Bertoldi, F., Walter, F., Kulkarni, S. R., & Berger, E. 2003, ApJ, 595, L33
- Taylor et al. (1999) Taylor, G. B., Carilli, C. L., & Perley, R. A. 1999, ASP Conf. Ser. 180: Synthesis Imaging in Radio Astronomy II, 180.
- Taylor et al. (2004) Taylor, G. B., Frail, D. A., Berger, E., and Kulkarni, S. R. 2004, ApJ, 609, L1
- Taylor et al. (2005) Taylor, G. B., Momjian, E., Pihlström, Y., Ghosh, T., & Salter, C. 2005, ApJ, 622, 986
- Vanderspek et al. (2003) Vanderspek, R., et al. 2003, GRB Coordinates Network, 1997, 1
- van der Horst et al. (2005) van der Horst, A. J., Rol, E., Wijers, R. A. M. J., Strom, R., Kaper, L., & Kouveliotou, C. 2005, ApJ, 634, 1166
| Date | Frequency | Flux Density | Instrument | |
|---|---|---|---|---|
| (days) | (GHz) | (Jy) | ||
| 2004 Apr. 13.11 | 380.63 | 4.86 | 631 50 | VLA-C |
| 2004 May. 29.12 | 426.64 | 4.86 | 516 39 | VLA-C |
| 2004 Jun. 01.15 | 429.67 | 4.86 | 485 44 | VLA-D |
| 2004 Jul. 19.94 | 478.46 | 4.86 | 441 43 | VLA-D |
| 2004 Aug. 15.79 | 505.31 | 4.86 | 528 53 | VLA-D |
| 2004 Sep. 03.79 | 524.31 | 4.86 | 331 28 | VLA-A |
| 2004 Dec. 09.66 | 621.18 | 4.86 | 361 36 | VLA-B |
| 2005 Jan. 29.38 | 671.90 | 4.86 | 346 51 | VLA-B |
| 2005 Apr. 07.21 | 739.73 | 4.86 | 292 37 | VLA-C |
| 2005 Jun. 12.78 | 806.30 | 4.99 | 240 17 | EB+GBT+WB+AR+JB |