∎
C. Carilli 33institutetext: National Radio Astronomy Observatory, 33email: ccarilli@nrao.edu
Detecting the Most Distant (z7) Objects with ALMA ††thanks: It is our pleasure to thank our collaborators on this project: Frank Bertoldi, Dominik Riechers, Pierre Cox, Roberto Maiolino and Axel Weiß.
Abstract
Detecting and studying objects at the highest redshifts, out to the end of Cosmic Reionization at z7, is clearly a key science goal of ALMA. ALMA will in principle be able to detect objects in this redshift range both from high-J (J7) CO transitions and emission from ionized carbon, [CII], which is one of the main cooling lines of the ISM. ALMA will even be able to resolve this emission for individual targets, which will be one of the few ways to determine dynamical masses for systems in the Epoch of Reionization. We discuss some of the current problems regarding the detection and characterization of objects at high redshifts and how ALMA will eliminate most (but not all) of them.
1 Introduction: The highest redshift galaxies
In recent years, deep narrow band surveys have revealed a major population of Lyman Alpha Emitters (LAE) out to very high redshifts (e.g. Hu et al. 2002, Kurk et al. 2004, Stern et al. 2005, Murayama et al. 2007). In particular, Taniguchi et al. (2005) report the detection of 9 spectroscopically confirmed LAE at redshifts of z6.6 in the Subaru Deep Field (currently, the published LAE redshift record holder is at z=6.98, Iye et al. 2006). The mere presence of Lyman alpha emission in these sources provides strong evidence that they are undergoing bursts of star formation: the star formation rates of individual objects are 10 M⊙ yr-1 (based on their FUV luminosities) and their redshifts place them well within the end of cosmic reionization. They also appear to be very numerous: Tanaguchi et al. 2005 find 30 LAEs in only a quarter degree field (e.g., compared to 10 QSOs at z6 which are distributed over a quarter of the sky! Fan et al. 2004). This implies that LAEs may play an important role in reionizing the universe at z6 (for a review see Fan, Carilli & Keating, 2006). Investigating the physical properties of these sources are thus of great interest and ALMA will play a critical role in studying these objects, as discussed in the following.
2 Interstellar Medium: CO vs. [CII] emission
2.1 Carbon Monoxide (CO)
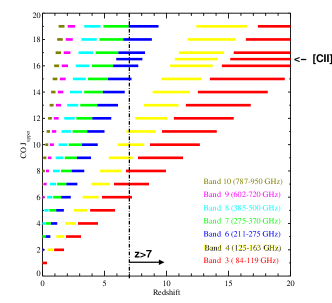
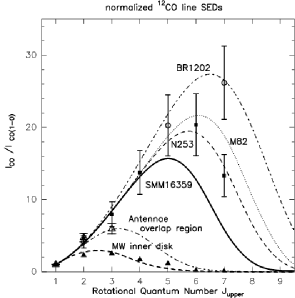
Constraining the properties of the molecular gas in objects at the end of cosmic reionization is clearly of key importance as such observations 1) will measure the available ’fuel’ for star formation, 2) will help to constrain the dynamical mass of the system and will thus 3) allow to put these objects in an evolutionary context for early galaxy formation. Typically, at low and high redshifts, CO emission is used as a tracer for the molecular gas phase (e.g. review by Solomon & Vanden Bout 2004). It is important to keep in mind though, that, at the highest z, only the very high rotational lines of CO will be observable with ALMA. E.g. even in the lowest (currently funded) frequency band of ALMA (band 3, 84–119 GHz), only CO transitions with J7 (i.e., CO(7–6), CO(8–7), etc.) will be observable at z7. This is graphically illustrated in Fig. 1 where we plot ALMA’s ‘CO discovery space’ (i.e., which line can be observed at which redshift using which ALMA band). The high–J transitions correspond to highly excited gas (either due to high kinetic temperatures, high densities, or both) which may not be excited in normal starforming environments. This is shown in Fig. 2 (taken from Weiss et al. 2005) where measured CO line strengths (as a function of J, this is sometimes referred to as CO line ladders/SEDs) are plotted for a number of key sources. What is immediately obvious from this plot is that most objects have sharply decreasing CO line strengths beyond J, in particular starforming systems such as NGC 253, or the sub–millimeter galaxy plotted in this diagram (the quasars appear to be more excited, but their CO line SED still turns over at J7, for an exceptional object see APM 07279, Weiss et al. 2007). This comparison immediately implies that emission from the CO molecule will typically be very difficult to observe with ALMA at z7 as the observable lines will simply not be excited.
2.2 Ionized Carbon ([CII]) to the Rescue!
An alternative tracer of the interstellar medium is one of the main cooling line of the ISM, the 2P3/2 2P1/2 fine–structure line of C+ (or [CII]). In brief, the [CII] line is expected to be much stronger than any of the CO lines. Given its high frequency (157.74 m, corresponding to 1900.54 GHz) [CII] studies in the local universe are limited to airborne or satellite missions (e.g. Stacey et al. 1991, Malhotra et al. 1997, Madden et al. 1997). These studies have demonstrated that this single line can indeed carry a good fraction of the total infrared luminosity (LFIR) of an entire galaxy. In the local universe, the ratio LCII/LFIR has been found to be 2–510-4 in the case of ULIRGS (e.g. Gerin & Phillips 2000), but is more like 5–1010-3 in more typical starforming galaxies (for a discussion on possible reasons for the supressed ratio in ULIRGs see, e.g., Luhman et al. 1998). Notably, the ratio has been found to be 1% or even higher in low metallicity environments. E.g., in the low- metallicity galaxy IC10, LCII/LFIR reaches values as high as 4%, with an average value of 2% (Madden et al. 1997, see Israel et al. 1996 for a similar result for the LMC). This is the reason why it has long been argued (e.g., Stark 1997) that observation of the [CII] line of prestine systems at the highest redshifts will likely be the key to study molecular gas in the earliest starforming systems, in particular in the era of ALMA. The ALMA [CII] ‘discovery space’ is also indicated in Fig. 1.
3 Expected [CII] line strengths
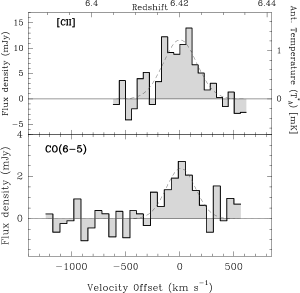
At the redshifts of the LAEs, the [CII] line is shifted to the 1 mm band of ALMA (band 6, 211–275 GHz). [CII] emission has recently been successfully detected using the IRAM 30 m in the highest redshift quasar J1148+5251 at z=6.42 (Maiolino et al. 2005, see Fig. 3). The noteable difference between J1148+5251 and the z6 LAEs is that the ratio LCII/LFIR has been found to be very low (510-4) in J1148+5251, i.e. in perfect agreement with studies of low redshift ULIRGs that show a central AGN. On the contrary, the LAE are presumably pure starbursts (no evidence for an AGN is found, Taniguchi et al. 2005) and they likely have lower metallicities compared to the highly overdense regions in which the luminous quasars are supposedly present. All these arguments point towards a LCII/LFIR ratio in LAE that is close to what is found for nearby normal galaxies, or perhaps even for the metal–poor dwarf galaxies (i.e., around 1% or even higher). In other words, the [CII] luminosity of the LAE may well be an order of magnitude stronger (for a given IR luminosity) than what has been found in the z=6.4 QSO. In the following we present a quick back–of–the envelope calculation based on the detected [CII] line strength in J 1148+5251 (10 mJy) which has a SFR of a few 1000 M⊙ yr-1. This SFR is more than two order of magnitudes higher than the SFR found in a typical LAE, but as the LCII/LFIR may be higher by an order of magnitude in the LAEs, the expected [CII] line strength of the LAE may be as high as 1 mJy. Such a line should be easily detectable with ALMA at high significance in a few hours.
4 Resolving the ISM
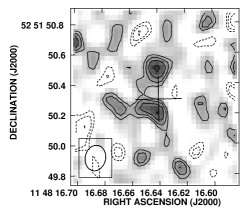
Detecting the [CII] (or CO) emission is critical to estimate the reservoir of the (molecular) gas in these early systems. A second step is then to spatially resolve the molecular gas distribution. In particular, given the typical diameters of galaxies of many kpc, a linear resolution of kpc is needed to resolve the structure of the underlying galaxy. Such measurements are needed 1) to get an estimate for the size of the galaxy (and thus a better estimate for the dynamical mass), 2) to resolve potentially merging systems and 3) to better constrain the physical properties of the gas (e.g., by measuring the brightness temperature of the hosts). A linear resolution of 1 kpc corresponds to a resolution of 0.15′′ at the redshifts under consideration (1 kpc at ). Such observations can then in turn be used to constrain the predictions by CDM simulations of early galaxy formation, and, if a large sample was available, put limits on the frequency of mergers at high redshift. In addition, such studies can be used to constrain the possible redshift-evolution of the MBH– relation in high–z quasars. Such observations will clearly be feasible with ALMA in the extended arrays. High–resolution CO imaging is already possible with the current generation of telescopes: we have used the VLA to resolve the molecular gas in the host galaxy of the z=6.42 QSO J 1148+5251 (see Fig. 4, Walter et al. 2004).
5 The case for ALMA band 5
As a technical note: the ALMA redshift coverage for the [CII] line is not ideal as its frequency lies between the CO(17–16) and CO(16–15) transition (see Fig. 1). One concern is that the critical redshift range (8z10.5) is currently not fully covered: This frequency range corresponds to the ALMA band 5 which is only partly funded by the European Union as part of the Sixth Framework Programme (FP6) for up to 8 antennas. Clearly, it would be highly desireable to equip as many ALMA antennas with band 5 receivers as possible.
6 Concluding remarks
ALMA observations of the [CII] line will play a fundamental role in studying the youngest galaxies in the Epoch of Cosmic Reionization at z7. Given the expected line strengths it should be possible to resolve these galaxies in the [CII] line emission on kpc scales. Such measurements would not only constrain the sizes but would also help to derive the dynamical masses in these early starforming systems. Given the typical CO excitation in starforming galaxies (i.e. drop in excitation around the J6 transitions), ALMA will likely act as a [CII]– rather than a CO–machine for objects at these extreme redshifts.
References
- (1) Bertoldi, F., Carilli, C. L., Cox, P., Fan, X., et al. 2003, A&A, 406, L55
- (2) Fan, X., Hennawi, J. F., Richards, G. T., et al. 2004, AJ, 128, 515
- (3) Fan, X., Carilli, C.L., Keating, B., 2006, ARA&A, 44, 415
- (4) Gerin, M., & Phillips, T. G. 2000, ApJ, 537, 644
- (5) Hu, E. M., Cowie, L. L., McMahon, R. G., et al. 2002, ApJ, 568, L75
- (6) Israel, F. P., Maloney, P. R., Geis, N., Herrmann, F., Madden, S. C., Poglitsch, A., Stacey, G.J., 1996, ApJ, 465, 738
- (7) Iye, M., Ota, K., Kashikawa, N., Furusawa, H., Hashimoto, T., Hattori, T., Matsuda, Y., Morokuma, T., Ouchi, M., Shimasaku, K., 2006, Nature, 443, 186
- (8) Kurk, J. D., Cimatti, A., di Serego Alighieri, et al. 2004, A&A, 422, L13
- (9) Luhman, M. L., et al. 1998, ApJL, 504, L11
- (10) Madden, S. C., Poglitsch, A., Geis, N., Stacey, G. J., & Townes, C. H. 1997, ApJ, 483, 200
- (11) Maiolino, R., Cox, P., Caelli, P., et al. 2005, astro-ph/0508064
- (12) Malhotra, S., et al. 1997, ApJL, 491, L27
- (13) Murayama, T., Taniguchi, Y., Scoville, N.Z., et al. 2007, ApJS, astro-ph/0702458
- (14) Stacey, G. J., Geis, N., Genzel, R., Lugten, J. B., Poglitsch, A., Sternberg, A., & Townes, C. H. 1991, ApJ, 373, 423
- (15) Stark, A. A. 1997, ApJ, 481, 587
- (16) Stern, D., Yost, S. A., Eckart, M. E., Harrison, F. A., Helfand, D. J., Djorgovski, S. G., Malhotra, S., & Rhoads, J. E. 2005 , ApJ, 619, 12
- (17) Taniguchi, Y., Ajiki, M., Nagao, T. et al. 2005, PASJ, 57, 165
- (18) Walter, F., Bertoldi, F., Carilli, C. L., et al. 2003, Nature, 424, 406
- (19) Walter, F., Carilli, C., Bertoldi, F., et al. 2004, ApJ, 615, L17
- (20) Weiss, A., Downes, D., Neri, R., Walter, F., Henkel, C., Wilner, D.J., Wagg, J., Wiklind, T., 2007, A&A, in press (astro–ph/0702669)