VIMOS total transmission profiles for broad-band filters
Abstract
VIMOS is a wide-field imager and spectrograph mounted on UT3 at the VLT, whose FOV consists of four 7’x8’ quadrants. Here we present the measurements of total transmission profiles – i.e. the throughput of telescope + instrument – for the broad band filters U, B, V, R, I, and z for each of its four quadrants. Those measurements can also be downloaded from the public VIMOS web-page. The transmission profiles are compared with previous estimates from the VIMOS consortium.
1 Transmission profiles of telescope + instrument
What has been available to ESO up to now are efficiency curves provided by the VIMOS consortium that are averaged over the four quadrants and were determined with laboratory measurements, not by observing standard stars. Prompted by user requests to have separate efficiency estimates for each quadrant, two spectrophotometric standard stars were observed in 2006: Hiltner 600 for all filters, and LTT7379 for the U and B band. These observations were performed with the broadest possible slit (5) and the grisms LR-blue (for U, B, and V) and LR-red (for R, I, and z). Under the assumption that the total star-light is contained in the slit, the efficiency curve is derived from the measured flux. The required input consists of the tabulated standard star flux, the extinction curve, and the grism transmission as provided by the VIMOS consortium. The resulting curves are shown in Fig. 1. They are also available from the public VIMOS web-pages111http://www.eso.org/instruments/vimos/inst/imaging.html.
There is good agreement between the newly derived efficiency estimates and those from the consortium. The substantial sensitivity drop in quadrant 3 for the U-band is found independently for both LTT 7379 and Hiltner 600 (note that the measurement for Hiltner 600 was not used for the efficiency estimate in the U-band since it suffered from flux loss in all four quadrants, due to a slight misalignment of the standard within the slit). Since the U-band photometric zero-points for Q3 do not show such a strong drop, a centring problem due to instrument flexure is a possible reason for this lack of measured flux. In addition, the consortium estimate of the grism transmission in Q3 for l3800 Å may be too high. We suggest that the efficiency estimates especially in the U-band be always re-scaled to the (integrated) photometric zero-points.


2 Transmission profiles of broad-band filters
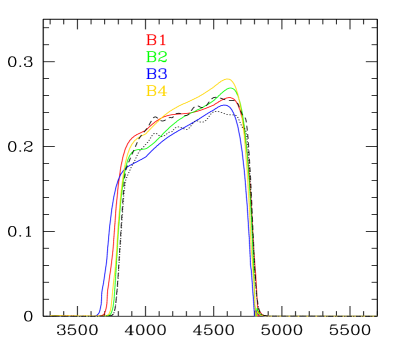
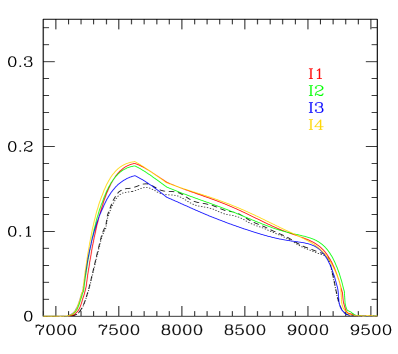
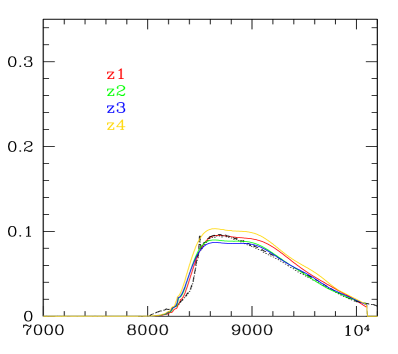
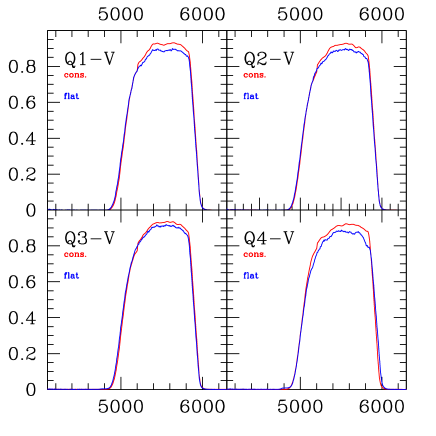
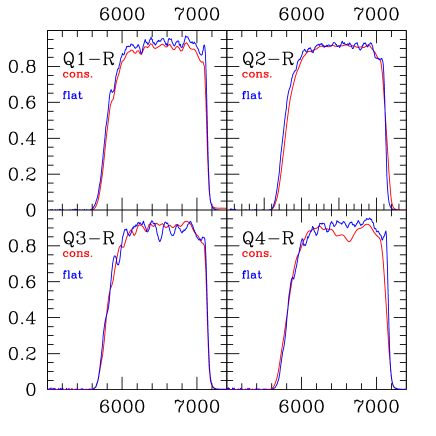
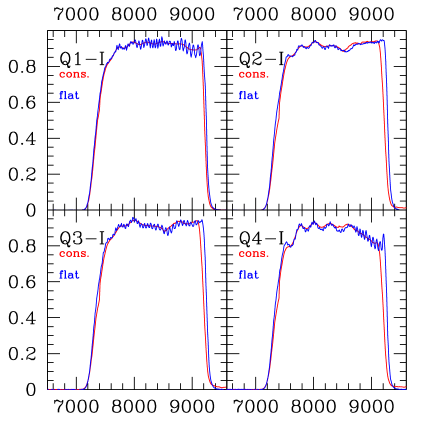
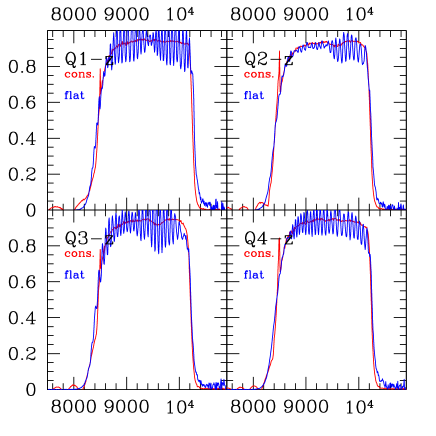
In addition to the total instrument+telescope efficiency estimates, we used the continuum lamp screen flats taken with and without inserted filter to measure the filter transmissions for each quadrant. The results are shown in Fig. 2 and compared with the consortium estimates. There is very good agreement for the V,R,I, and z filters. For the U-band, the consortium estimates are about 20% above those derived from the screen flats. Also for the B-band, the consortium estimates are about 5-10% higher.
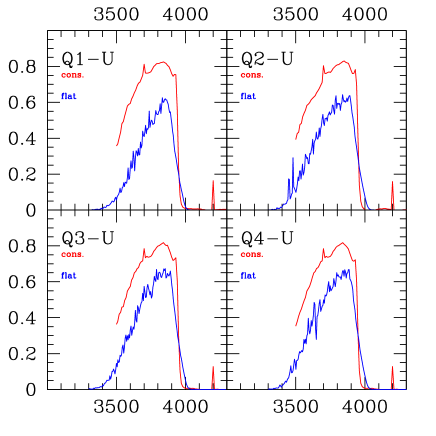
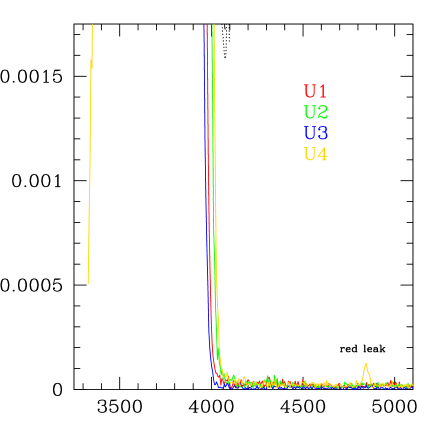
Unlike in the consortium filter transmission curves from Fig. 2, we do not detect a red leak of the U-band filter around 4200 Å. Only in Q4, there is a very minor leak at about 4850 Å (see Fig. 3).

3 Conclusions
The measured telescope+instrument efficiency curves for the VIMOS broad band filters agree very well with the consortium estimates. A discrepancy in the U-band is observed for one quadrant, possibly due to flexure and low grism transmission at short wavelengthes. The filter transmissions also agree very well, except for the B and especially U-band, where the newly measured transmission is about 20% lower.