Critical test for Altshuler-Aronov theory: Evolution of the density of states singularity in double perovskite Sr2FeMoO6 with controlled disorder
Abstract
With high-resolution photoemission spectroscopy measurements, the density of states (DOS) near the Fermi level () of double perovskite Sr2FeMoO6 having different degrees of Fe/Mo antisite disorder has been investigated with varying temperature. The DOS near showed a systematic depletion with increasing degree of disorder, and recovered with increasing temperature. Altshuler-Aronov (AA) theory of disordered metals well explains the dependences of the experimental results. Scaling analysis of the spectra provides experimental indication for the functional form of the AA DOS singularity.
pacs:
71.20.-b, 71.23.-k, 71.27.+a, 79.60.-iDisordered electronic systems, which have random potentials deviating from an ideal crystal, have been investigated from both fundamental and application points of view DES . Ever since the finding of filling-control metal-insulator transitions (MIT) in transition-metal oxides known as strongly correlated system, disorder has attracted even more attention because not only electron-electron interaction but also disorder are supposed to play fundamentally important roles in the MIT. Altshuler and Aronov Altshuler-Aronov studied the effect of electron-electron interaction in a disordered metallic medium, and predicted that the density of states (DOS) near the Fermi level () shows a singularity of and the DOS at increases with increasing temperature in proportion to . The theory has been applied to the low temperature conductivity of disordered metals such as disordered Au and Ag films Schmitz , amorphous alloy Ge1-xAux GeAu , and transition metal chalcogenide Ni(S,Se)2 Honig .
In a previous work, Sarma et al. LNMO have reported photoemission (PES) measurements on B-site disordered perovskites LaNiO3 (=Mn and Fe), which show MIT as a function of , and shown that the disorder affects the DOS near in such a way that had been theoretically predicted by Altshuler and Aronov Altshuler-Aronov . In a similar B-site substituted transition-metal oxide SrRu1-xTixO3, which demonstrates MIT at (SrRuO3 is metallic), the depletion of the DOS near has shown an unusual dependence in both metallic and insulating phases SRTO . In addition, although it is believed that a disorder-induced insulator shows a soft Coulomb gap characterized by a dependence of the DOS near Efros ; Massey , the unexpected dependence of the DOS near related to charge density wave has been observed in insulating BaIrO3 BaIrO3 . It is considered that fine structure in the DOS in the vicinity of is sensitive to both the degrees of disorder and electron correlation, and therefore experimental confirmation of a basic theory for disordered electronic system such as the Altshuler-Aronov (AA) theory is necessary for understanding of the DOS singularity. While AA theory makes specific predictions about both and dependences, photoelectron spectroscopy has been used only to probe the dependence with absolutely no reference to the dependence. Therefore, detailed high-resolution temperature-dependent PES measurements are also highly desired to verify the AA theory.
The present paper reports on high-resolution PES experiments on the B-site ordered double perovskite Sr2FeMoO6 (SFMO), where we have controlled the degree of Fe/Mo antisite disorder (AD) in the sample preparation procedure. Through detailed analysis for the temperature and degree of disorder dependences of the PES spectra near , the results provide experimental confirmation of the AA theory of disordered metals. SFMO has been investigated intensively due to the theoretical prediction of half-metallic nature and the observation of large magnetoresistance under low magnetic fields at room temperature K.-I.Kobayashi . In this system, there are characteristic defects known as Fe/Mo AD at the B-site, which remarkably affects the physical properties of SFMO SarmaSSC ; MRinSFMO ; Navarro ; B.J.Park ; Y.H.Huang . By controlling the degree of AD, one can investigate disorder effects in the metal without changing the chemical composition and other conditions.
Polycrystalline SFMO samples having different degrees of Fe/Mo AD prepared as follows; First, the samples with the highest degree of AD 45% were prepared. Then they were annealed at 1173 K, 1673 K, and 1523 K for a period of 5 hours under 2% H2/Ar to obtain the degrees of AD 40%, 25%, and 10%, respectively (SFMO having AD 50% is the same as ordinary perovskite SrFe0.5Mo0.5O3). Details of the sample preparation are given in Ref. SarmaSSC and MRinSFMO . Using x-ray diffraction, the degree of disorder was quantified from the intensity of a supercell-reflection peak. Scanning electron microscopy in conjunction with energy dispersive x-ray analysis revealed no change in composition during the annealing. Transport measurements were performed on the AD 10% and 40% samples by a standard four prove technique using a Physical Property Measurement System (Quantum Design Co. Ltd). PES spectra were recorded using a spectrometer equipped with a monochromatized He resonance lamp ( eV), where photoelectrons were collected with a Gammadata Scienta SES-100 hemispherical analyzer in the angle integrated mode. The total resolution of the spectrometer was meV, and the base pressure was Pa. Clean surfaces were obtained by repeated scraping in situ with a diamond file. The position of was determined by measuring PES spectra of evaporated gold which was electrically in contact with the sample.
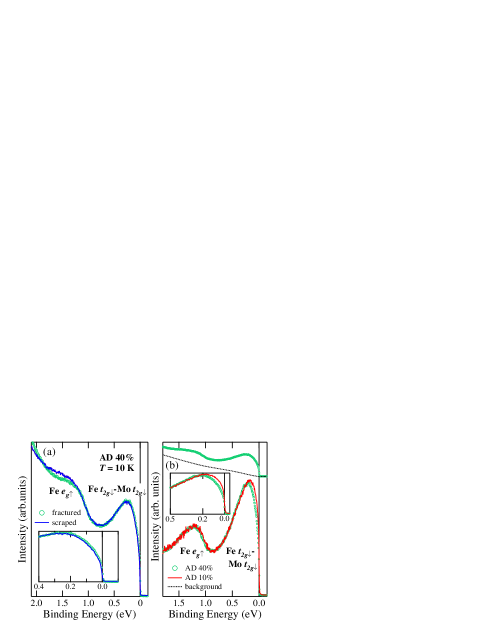
The line shapes of the PES spectra obtained were almost the same as those in a previous report on single crystalline SFMO taken with synchrotron radiation T.Saitoh . In order to examine the influence of surface treatment, we measured valence-band spectra taken from fractured and scraped surfaces. In the binding-energy () range from 2 eV to 10 eV, there were appreciable differences such as the sharpness of structures in the O 2 and the Fe bands (not shown), the background intensity, and to some extent the Fe band. On the other hand, within eV of , i.e., in the Fe Mo conduction bands, the line shapes of the fractured and scraped samples were similar to each other as shown in Fig. 1(a). Since in previous PES studies it has been reported that LDA+ calculation well explains the valence-band spectra taken from the fractured surface T.Saitoh ; Bulk-PES , we consider that the different surface treatments have not affected the spectra near which reflect the bulk properties. In contrast, the spectra are intensively influenced by AD and temperature as we shall see below.
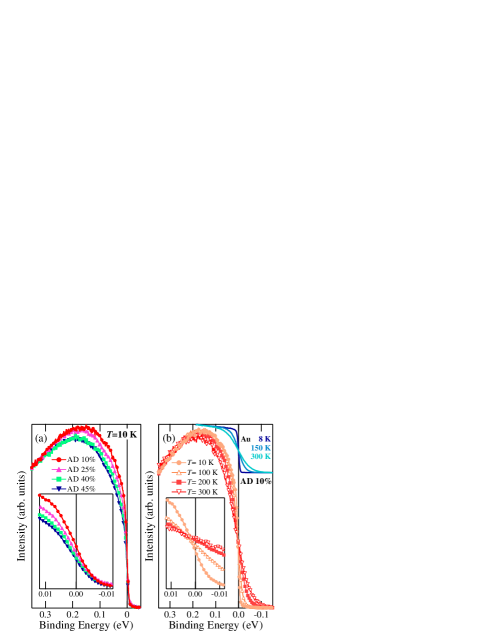
Figure 1(b) shows valence-band spectra for different degrees of disorder, i.e., AD 40% and 10%. Although the peak due to the localized Fe states was nearly identical between AD 10% and AD 40%, there was a clear difference in the Fe -Mo conduction band between the two spectra. This result suggests that the disorder influences the DOS near . Figure 2 shows the temperature and degree of disorder dependences of the spectra near normalized to the area in the region from eV to 0.6 eV, in which the spectra were identical and independent of the degree of AD as shown in Fig. 1(b). For a fixed temperature, the intensity of the spectra near was depleted with degree of disorder. This behavior is consistent with the previous report on a disordered metal system LaNi1-xMnxO3 LNMO . Indeed, temperature dependent resistivity measurements on the AD 40% sample showed a minimum around 40 K, i.e., the resistivity increased with decreasing temperature below 40 K, while on the AD 10% one there was no minimum till the lowest measured temperature (20 K). The observations are consistent with previous reports of transport measurements on SFMO having various degrees of disorder Y.H.Huang ; Y.H.Huang2 and on SFMO with high Fe/Mo ordering MRinSFMO ; SingleCrystalSFMO . For a fixed degree of disorder, the intensity at increased with temperature as shown in Fig. 2(b). This behavior indicates that SFMO differs from normal metals such as Au in which PES spectra at various temperatures have temperature-independent intensity at and intersect at irrespective of temperature as shown in Fig 2(b), representing the simple Fermi-Dirac distribution function.
Now, we analyze the temperature and degree of disorder dependences of the spectra based on the theory for disordered metal suggested by Altshuler and Aronov Altshuler-Aronov . The theory predicted that electron-electron interaction accompanied by impurity scattering leads to an anomaly in the DOS around and the resulting singular part of the DOS is given by
| (1) |
where is the original DOS at , is the energy measured from , is the inverse Debye radius, and is the diffusion coefficient due to impurity scattering.
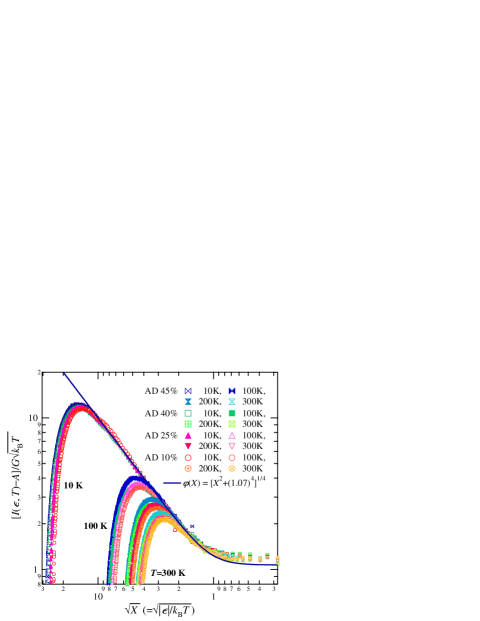
In order to see whether experimental spectra satisfy Eq. (1), we have made the following scaling analysis. According to Eq. (1), the PES spectra near should be proportional to , where is a constant and . Therefore, can be parameterized as
| (2) |
where and are only dependent on the degree of disorder. plotted against should fall onto the same curve if Eq. (1) is valid, and can be used to evaluate the functional form of if and are chosen to satisfy the condition that as . In Fig. 3, the results are plotted on a logarithmic scale, where the PES spectra have been divided by the Fermi-Dirac function convoluted with the experimental resolution estimated from the Au spectra. Notice that all the low energy part of the spectra fell onto the same curve, which we attribute to the scaling function . Deviation from the scaling function occurs at high energies where the original DOS starts to deviate from the constant one. We find that approaches for , corresponding to AA theory. The results ensure the validness of analysis based on AA theory for the depletion of PES spectra near .
In order to analyze the spectra using Eq. (1), we propose an analytical form of interpolating both the limits of large and small of Eq. (1). This form is shown to accurately reproduce the experimentally scaling function deduced above as shown in Fig. 3. Therefore, we employ a model function
| (3) |
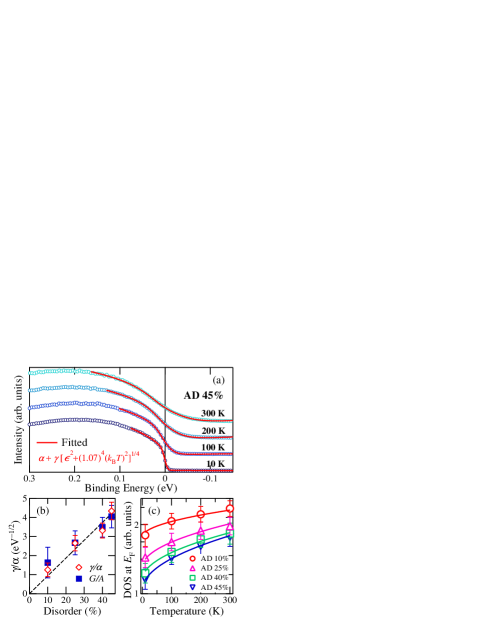
where is the Fermi-Dirac function, and are fitting parameters. depends only on degree of disorder and are independent of a way of intensity normalization. Figure 4(a) shows fitted results for the spectra of the AD 45% sample at various temperatures. The fitting function given by Eq. (3) well reproduced the spectra near , where the fitted ranges were chosen to the valid range of the scaling function as shown in Fig. 3 SPofDev . Figure 4(b) shows the values of the coefficients which represent the strength of the DOS singularity as a function of disorder. The value is independent of temperature and approximately linearly increases with degree of disorder as shown in Fig. 4(b), indicating that the DOS singularity near is enhanced with increasing degree of disorder as predicted by AA theory. The constant will be relative to the value of . Actually, the value shows the same dependence as [Fig. 4(b)]. Equation (3) as a function of without , i.e., , well reproduced the line shape of the depletion as shown in Fig. 3, where the parameters were chosen and to correspond with the analytical ExponentN . The result demonstrates validness of our assumption for the functional form of given by Eq. (3).
Equation (1) indicates that the singular contribution to the DOS at is proportional to . In order to study the temperature dependence of the DOS at , comparison was made between the experimental and theoretical at . The PES intensity (or DOS) at is plotted as a function of temperature in Fig. 4(c). For a fixed temperature, the DOS at increased with decreasing degree of disorder. For a fixed degree of disorder, the DOS at increased with increasing temperature. According to Eq. (1), temperature dependence of the DOS at is expressed as
| (4) |
corresponding Eq. (3) at . Using the values of obtained by fitting to the PES spectra, Eq. (4) well reproduces the temperature-dependence of the DOS at as shown in Fig. 4(c). The result is consistent with theoretically predicted temperature dependence of at . It follows from the arguments described above that AA theory applies to not only the disorder dependent depletion near but also the temperature dependent DOS at .
As mentioned above, AA theory treats the scattering processes on general ground and does not depend on the functional form of the potential of the scattering center. This theory can be applied to the case that the mean free path of itinerant electrons is larger than or comparable with its wave length.
In conclusion, we have performed high-resolution photoemission experiments on polycrystalline Sr2FeMoO6 samples having different degrees of Fe/Mo antisite disorder. The photoemission spectra near the Fermi level depended on degree of the Fe/Mo antisite disorder as well as on temperature. The Altshuler-Aronov theory on disordered metal well explained both the dependences. Scaling analysis for the spectral depletion clarifies the functional form of the density of states singularity near the Fermi level. We believe that the findings will provide an indicator for degrees of disorder and electron-electron correlation, and promote spectral analysis for the index of the density of states depletion near the Fermi level. The present results point to a need for taking into account both electron-electron interaction and disorder effects for an understanding of the electronic structure of metallic correlated electron system.
The authors thank H. Yagi and M. Hashimoto for help in experiments. This work was supported by a Grant-in-Aid for Scientific Research in Priority Area “Invention of Anomalous Quantum Materials” (16076208) from MEXT, Japan. D.D.S. thanks DST and BRNS for funding this research. S.R. thanks JSPS postdoctoral fellowship for foreign researchers. M.K. acknowledges support from the Japan Society for the Promotion of Science for Young Scientists.
References
- (1) P. A. Lee and T. V. Ramakrishnan, Rev. Mod. Phys. 57, 287 (1985).
- (2) B. L. Altshuler and A. G. Aronov, Solid State Commun. 30, 115 (1979).
- (3) S. Schmitz and S. Ewert, Solid State Commun. 74, 1067 (1990).
- (4) W. L. McMillan and J. Mochel, Phys. Rev. Lett. 46, 556 (1981).
- (5) A. Husmann, D. S. Jin, Y. V. Zastavker, T. F. Rosenbaum, X. Yao, and J. M. Honig, Science 274, 1874 (1996).
- (6) D. D. Sarma, A. Chainani, S. R. Krishnakumar, E. Vescovo, C. Carbone, W. Eberhardt, O. Rader, C. Jung, C. Hellwing, W. Gudat, H. Srikanth, and A. K. Raychaudhuri, Phys. Rev. Lett. 80, 4004 (1998).
- (7) J. Kim, J.-Y. Kim, B.-G. Park, and S.-J. Oh, Phys. Rev. B 73, 235109 (2006).
- (8) A. F. Efros and B. I. Shklovskii, J. Phys. C 8, L49 (1975).
- (9) J. G. Massey and M. Lee, Phys. Rev. Lett. 75, 4266 (1995).
- (10) K. Maiti, R. S. Singh, V. R. R. Medicherla, S. Rayaprol, and E. V. Sampathkumaran, Phys. Rev. Lett. 95, 016404 (2005).
- (11) K.-I. Kobayashi, T. Kimura, H. Sawada, K. Terakura, and Y. Tokura, Nature 395, 677 (1998).
- (12) D. D. Sarma, E. V. Sampathkumaran, S. Ray, R. Natarajan, S. Majumdar, A. Kimar, G. Nalini, and T. N. G. Row, Solid State Commun. 114, 465 (2000).
- (13) D. D. Sarma, Sugata Ray, K. Tanaka, and A. Fujimori, PRL in press.
- (14) J. Navarro, J. Nogués, J. S. Muoz, and J. Fontcuberta, Phys. Rev. B 67, 174416 (2003).
- (15) B. J. Park, H. Han, J. Kim, Y. J. Kim, C. S. Kim, and B. W. Lee, J. Magn. Magn. Mater. 272-276, 1851 (2004).
- (16) Y. H. Huang, M. Karppinen, H. Yamauchi, and J. B. Goodenough, Phys. Rev. B 73, 104408 (2006).
- (17) T. Saitoh, M. Nakatake, A. Kakizaki, H. Nakajima, O. Morimoto, S. Xu, Y. Moritomo, N. Hamada, and Y. Aiura, Phys. Rev. B 66, 035112 (2002).
- (18) J.-S. Kang, J. H. Kim, A. Sekiyama, S. Kasai, S. Suga, S. W. Han, K. H. Kim, T. Muro, Y. Saitoh, C. Hwang, C. G. Olson, B. J. Park, B. W. Lee, J. H. Shin, J. H. Park, and B. I. Min, Phys. Rev. B 66, 113105 (2002).
- (19) Y.-H. Huang, H. Yamauchi, and M. Karppinen, Phys. Rev. B 74, 174418 (2006).
- (20) Y. Tomioka, T. Okuda, Y. Okimoto, R. Kumai, K.-I. Kobayashi, and Y. Tokura, Phys. Rev. B 61, 422 (2000).
- (21) The starting points are about 76 meV, 109 meV, 129 meV, and 145 meV for 10 K, 100 K, 200 K, and 300 K, respectively.
- (22) The analytical form of can be expressed as more general formula: , which also satisfies both the limits of . Using this function, the scaling function has been fitted well as . This result emphasizes the validness of the analytical because the exponent is nearly 1.