IRAS 183170757: A Cluster of Embedded Massive Stars and Protostars
Abstract
We present high resolution, multiwavelength continuum and molecular line images of the massive star-forming region IRAS 183170757. The global infrared through millimeter spectral energy distribution can be approximated by a two temperature model (25K and 63K) with a total luminosity of approximately log() = 5.2. Previous submillimeter imaging resolved this region into a cluster of five dust cores, one of which is associated with the ultracompact H II region G23.955+0.150, and another with a water maser. In our new 2.7mm continuum image obtained with BIMA, only the UCH II region is detected, with total flux and morphology in good agreement with the free-free emission in the VLA centimeterwave maps. For the other four objects, the non-detections at 2.7mm and in the MSX mid-infrared bands are consistent with cool dust emission with a temperature of 13-40K and a luminosity of 1000-40000 . By combining single-dish and interferometric data, we have identified over two dozen virialized C18O cores in this region which contain of the total molecular gas mass present. While the overall extent of the C18O and dust emission is similar, their emission peaks do not correlate well in detail. At least 11 of the 123 infrared stars identified by 2MASS in this region are likely to be associated with the star-forming cluster. Two of these objects (both associated with UCH II) were previously identified as O stars via infrared spectroscopy. Most of the rest of the reddened stars have no obvious correlation with the C18O cores or the dust continuum sources. In summary, our observations indicate that considerable fragmentation of the molecular cloud has taken place during the time required for the UCH II region to form and for the O stars to become detectable at infrared wavelengths. Additional star formation appears to be ongoing on the periphery of the central region where up to four B-type (proto)stars have formed amongst a substantial number of C18O cores.
1 Introduction
The formation mechanism of massive stars is a topic of active research. Because massive star formation regions typically lie at distances of several kiloparsecs, the identification of high mass protostars requires both good sensitivity and high angular resolution. As a consequence of their presumed youth, ultracompact HII regions (UCH II regions) provide a good tracer of current massive star formation (Wood & Churchwell, 1989) and may be expected to be accompanied by protostars in earlier evolutionary stages. Indeed, recent high-resolution millimeterwave images of UCH II regions have revealed the high-mass equivalent of “Class 0” protostars. Examples include the young stellar object IRAS 23385+6053 (Molinari et al., 1998), the compact methyl cyanide core near the G31.41+0.31 UCH II (Cesaroni et al., 1994), the proto-B-star G34.24+0.14MM (Hunter et al., 1998), the G9.62+0.19-F hot core (Testi et al., 2000), and the protocluster G24.78+0.08 (Furuya et al., 2002). To identify these deeply-embedded objects requires an optically thin tracer in order to probe through the large extinction toward the giant molecular cloud cores that harbor them. Submillimeter continuum emission from cool dust is a good tracer of protostars because it remains optically thin at high column densities () (Mezger, 1994). Similarly, spectral line emission from C18O is a good optically thin tracer that can reveal areas of high molecular gas column density.
Our target in this study, IRAS 183170757, is a luminous infrared source (log L) at a kinematic distance of 4.9 kpc ( = 80 km s-1). Based on its IRAS colors, it has been identified as a massive protostellar candidate (Chan, Henning, & Schreyer, 1996). Previous single-dish radio frequency studies of this region have revealed hydrogen recombination line emission (Kim & Koo, 2001; Lockman, 1989; Wink, Wilson, & Bieging, 1983) and water maser emission (Genzel & Downes, 1977; Churchwell, Walmsley, & Cesaroni, 1990). The centimeterwave continuum emission shows both extended components (up to ) (Kim & Koo, 2001; Becker et al., 1994) and a UCH II region (Wood & Churchwell, 1989). The region has been detected in various dense gas tracers including the NH3(1,1), (2,2) and (3,3) transitions (Churchwell, Walmsley, & Cesaroni, 1990) and CS(7-6) (Plume, Jaffe, & Evans, 1992), though it was not detected in a methyl cyanide search (Pankonin et al., 2001), nor in a 6 GHz hydroxl maser search (Baudry et al., 1997), nor in two 6.7 GHz methanol maser searches (Szymczak, Hrynek, & Kus, 2000; Walsh et al., 1997). The CO(1-0) line shows a complex profile which has prevented the identification of high-velocity outflow emission in large-beam () surveys (Shepherd & Churchwell, 1996).
Also known as AFGL2194, compact infrared emission was first detected from the ground in the , , and bands by Moorwood & Salinari (1981) and later by Chini, Krügel, & Wargau (1987). Airborne observations of far-infrared continuum and fine-structure lines (S, O, N, and Ne) yield an electron density of 3500 cm-3 for the UCH II region and indicate a stellar type of O9 to early B (Simpson et al., 1995). Complete infrared spectra (m) have been recorded by the ISO SWS and LWS spectrometers (Peeters et al., 2002). At higher angular resolution, the region has been independently observed as part of two submillimeter continuum imaging surveys. In both cases, the emission is resolved into several components (Hunter et al., 2000; Mueller et al., 2002). Recent near-infrared imaging and spectroscopy has revealed the presence of a small cluster of stars associated with the UCH II region, including an O7 star (with N III emission and He II absorption) whose ionizing flux can account for all of the compact radio continuum emission (Hanson, Luhman, & Rieke, 2002). These developments have prompted the higher angular resolution millimeterwave observations which are presented in this paper in hopes of understanding this active site of massive star formation.
2 Observations
With the Berkeley-Illinois-Maryland-Association (BIMA) Millimeter Array (Welch et al., 1996), IRAS 183170757 was simultaneously observed in 110 GHz continuum and C18O (1-0). The continuum bandwidth was 600 MHz. The spectral resolution for the line data was 0.2 MHz (0.53 km s-1). The phase gain calibrator was the quasar 1741038. The bandpass calibrator was 3C273. The absolute flux calibration is based on 3C273 and Uranus. A single track in B-configuration was obtained on 1998 October 10, and in C-configuration on 1999 February 5. The synthesized beam for the combined data imaged with robust weighting is by at a position angle of .
To recover the missing flux from extended structures in the interferometer spectral line data, a single-dish map of C18O (1-0) was recorded at the NRAO111The National Radio Astronomy Observatory is a facility of the National Science Foundation operated under cooperative agreement by Associated Universities, Inc. 12 Meter telescope on 16 June 2000. A regular grid of 7x7 points was observed, with a spacing of providing full sampling of the telescope’s beam. The system temperature was 200K and the on-source integration time was 2.8 minutes per point. The data were combined as zero-spacing information with the BIMA data in the MIRIAD (Multichannel Image Reconstruction, Image Analysis and Display) software package. The resulting beamsize in the final datacube (with natural weighting and UV tapering applied) is at a position angle of .
To complement the millimeter data, infrared images and point source information for this region in , and bands were obtained from the 2 Micron All Sky Survey (2MASS) (Cutri et al., 2003) and in the mid-infrared bands from the Midcourse Space Experiment (MSX) archives (Egan et al., 1999) and HIRES-processed IRAS data (Hunter, 1997). Radio continuum images were also retrieved from the VLA galactic plane survey of Becker et al. (1994).
3 Results
3.1 Millimeter and radio continuum
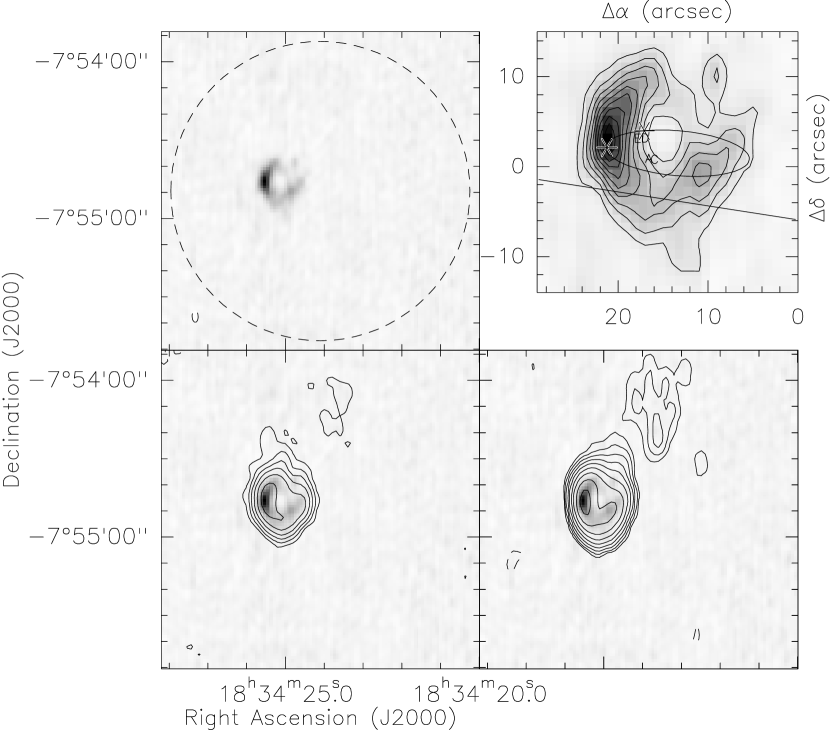
The 2.7mm continuum image from our BIMA observations is shown in grayscale in Figure 1, along with overlays of the 6cm and 20cm contours from the VLA galactic plane survey images (Becker et al., 1994). At all three wavelengths, the source structure consists of a bright rim on one edge of a partially-complete shell. Both the IRAS point source and the MSX point source positions lie close to the middle of the shell region. The bright, compact component was identifed as an irregular/multiple-peaked UCH II region by Wood & Churchwell (1989). At the two longest radio wavelengths, additional faint emission extends to the northwest.
3.2 Submillimeter continuum
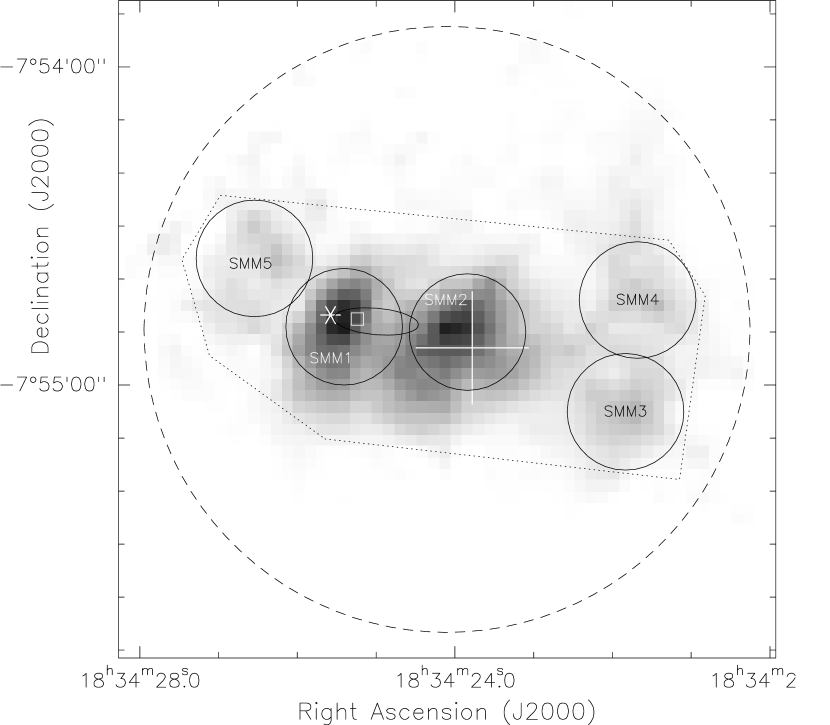
The 350 micron continuum image from the survey of Hunter et al. (2000) is shown in grayscale in Figure 2. For comparison, the position of the IRAS and MSX point sources are indicated along with the single-dish water maser position. Five independent submillimeter sources can be identified and their coordinates and flux densities are given in Table 1. The two dominant sources are SMM1 and SMM2. The peak of SMM1 coincides with the UCH II position. SMM2 lies to the west, and likely coincides with the water maser emission, whose position is uncertain to (no interferometric observations exist). The water maser is apparently quite variable over time: 60 Jy in 1976 (Genzel & Downes, 1977) to 0.7 Jy in 1989 (Churchwell, Walmsley, & Cesaroni, 1990) to undetected in 2002 (H. Beuther 2003, private communication). The three other sources have no known counterpart at other wavelengths.
3.3 Mid-infrared continuum
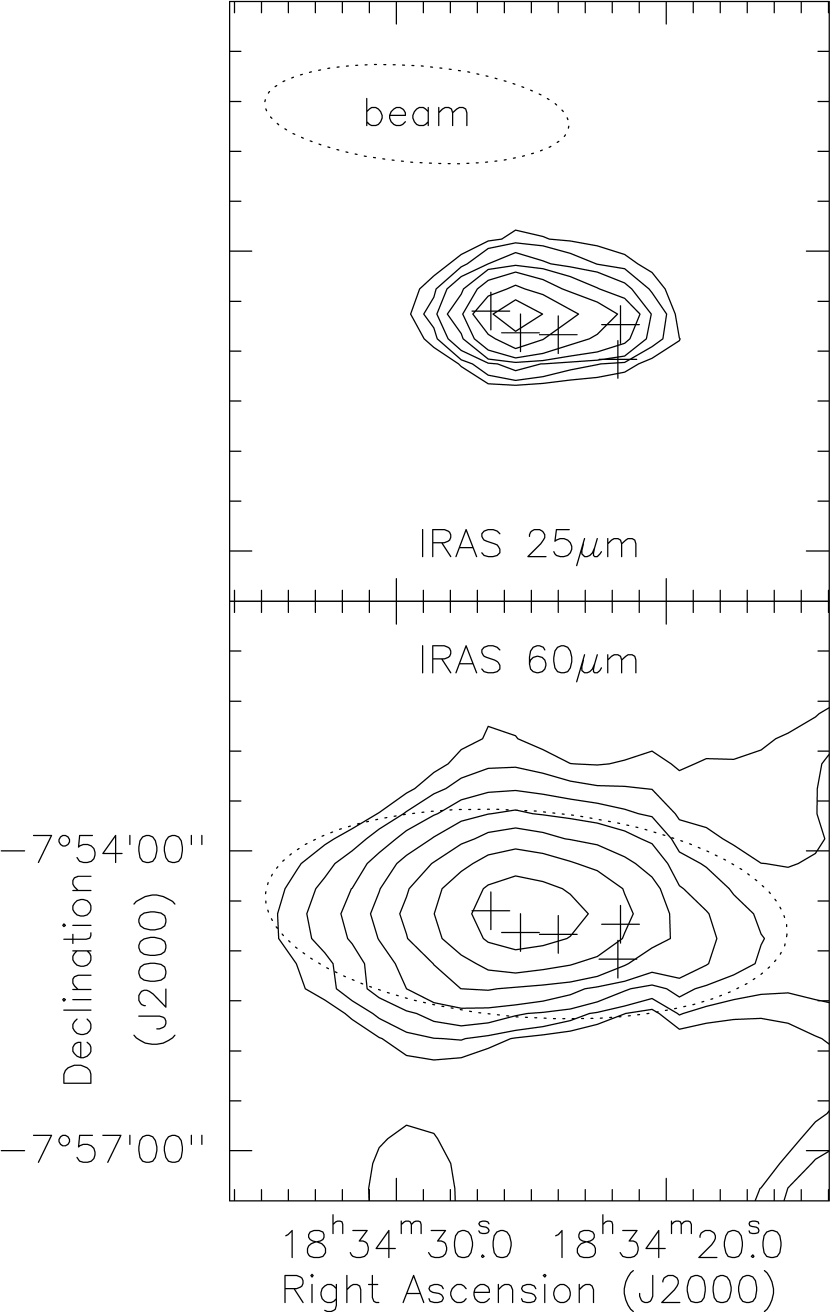
Each of the MSX images of this field show that the mid-infrared emission is dominated by the UCH II region associated with SMM1. Contour plots of two of the bands (8.3 and m) are shown in Figure 3. The positions of the five submillimeter sources are indicated in both panels. The fitted positions of a two-dimensional Gaussian model in each of the four MSX bands all agree to within and fall within the IRAS PSC error ellipse. Of the five submillimeter sources, the peak in each band lies closest to SMM1. HIRES-processed images provide additional high resolution information from the IRAS data (Aumann, Fowler, & Melnyk, 1990). The 20-iteration contour maps at 25 and m are shown in Figure 4, again with the five submillimeter sources marked. The emission remains essentially unresolved in each band, though there is some hint that the two westernmost submillimeter sources (SMM3 and 4) are detected in the contour extensions at 25 and 60m.

3.4 Spectral Energy Distributions
Using the flux density data from Table 2, the mid-infrared through radio wavelength spectral energy distribution (SED) for the entire region is shown in Figure 5. The flux density measurements at wavelengths longward of 21 m have been fit with a simple two-temperature modified blackbody dust model plus a free-free component, summarized in Table 3. The flux density measurement at 1.3mm from the literature (Chini et al., 1986) should be considered a lower limit as it was obtained with a single element detector with a beam centered on the IRAS position, which misses most of SMM3 and SMM4. The temperature of the cold component of dust (25K) agrees quite well with the kinetic temperature (25.8K) derived from ammonia (1,1) and (2,2) observations with a beam centered on the UCH II position (Churchwell, Walmsley, & Cesaroni, 1990). It is interesting to note that the warm component of dust dominates the total luminosity of the region, which is in contrast to more isolated high-mass protostellar objects (Sridharan et al., 2002) and even many other UCH II regions. Using the grain emissivity index () along with the temperature and optical depth derived from the fit, one can calculate the number of cold and warm grains required to explain the observed flux density (Lonsdale-Persson & Helou, 1987; Hildebrand, 1983). The corresponding mass of dust can then be calculated for each clump and for the extended emission. As is typical, the cold grains dominate the mass of dust. Assuming a gas to dust mass ratio of 100 (Sodroski et al., 1997), the total gas mass of each clump is listed in column six of Table 1 and the total mass of the region is . Using the individual gas masses and source diameters (from the angular diameter and distance), we compute the column density of hydrogen () toward each clump in column seven of Table 1. Finally, we have estimated the visual and infrared ( band) extinctions toward each clump by using the conversion formula of derived from observations of the ISM at UV (Whittet, 1981; Bohlin, Savage & Drake, 1978) and X-ray wavelengths (Ryter, 1996; Predehl & Schmitt, 1995), followed by the relation from Rieke & Lebofsky (1985). The extinction values listed in columns eight and nine of Table 1 have been further reduced by a factor of two to more accurately estimate the extinction toward a young star at the center of the clump, rather than behind it.

As the SED model predicts, the free-free emission mechanism still dominates over the dust emission at frequencies as high as 110 GHz. In fact, the image at this frequency is nearly identical to the centimeter images. The 110 GHz flux densities for the SMM1-5 are listed in Table 1. Nearly all of the 110 GHz flux can be associated with SMM1, with the rest of the emission sitting just outside the aperture used to define this object in the m map. By contrast, we have not detected any emission for SMM2-5. Each of these upper limits is consistent with an SED proportional to , corresponding to dust emission with . For the case of SMM3 and SMM4, they lie sufficiently far from the main source that useful upper limits can be obtained from both the IRAS and MSX data which provide a constraint on the individual properties of these dust cores. To visualize this constraint, the spectral energy distributions of SMM3 and SMM4 are shown in Figure 6 along with the two most extreme models consistent with the data. The corresponding dust temperature and luminosity upper and lower limits are summarized in Table 4. Although the luminosity remains uncertain to within a factor of 30-60, the lower limits () indicate that these objects may be powered by individual massive stars or protostars.

3.5 C18O (1-0) images
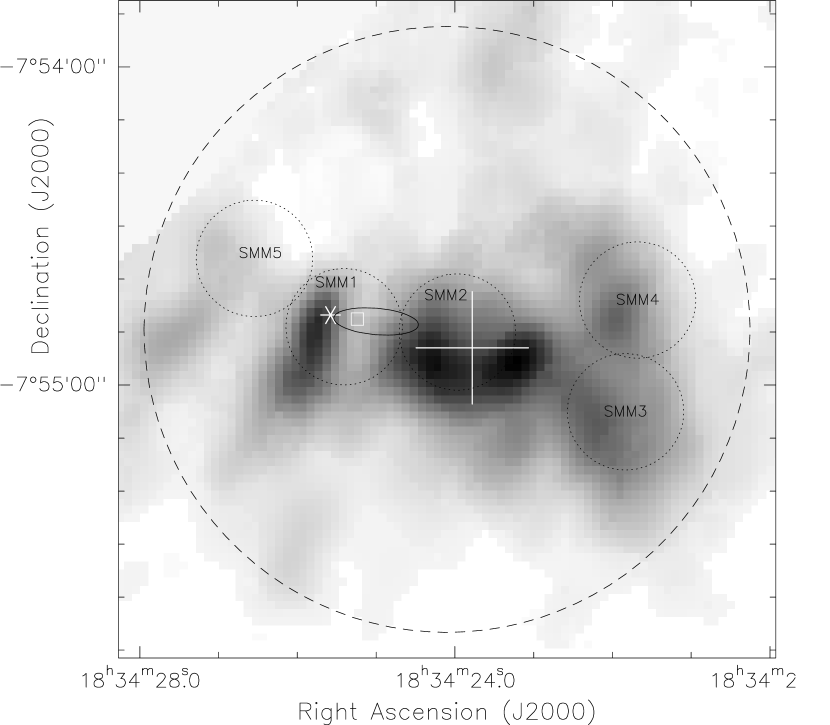
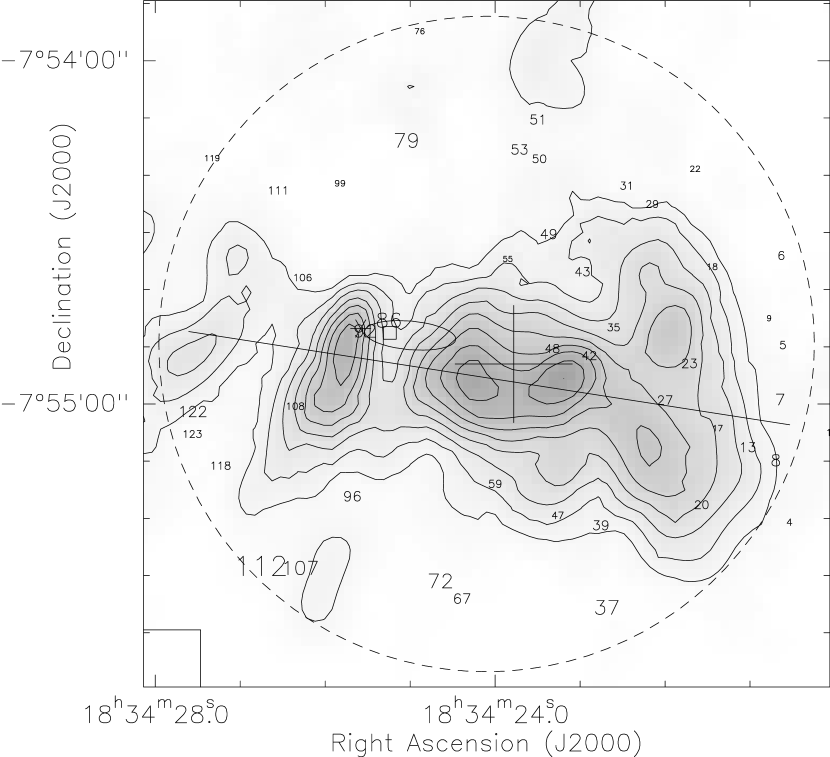
The integrated C18O (1-0) line emission (75-85 km s-1) is shown as grayscale in Figure 7. The dotted circles denote the positions of the submillimeter continuum clumps from Figure 2. The C18O emission has been clipped (set to zero) at all points below (0.2 Jy beam-1). There are five major peaks of emission, four of which agree roughly with the submillimeter continuum sources SMM1-4. The strongest component peaks very close (offset: ) to a small cluster of stars identified by Hanson, Luhman, & Rieke (2002) that are associated with the UCH II emission and SMM1. Assuming optically-thin line emission with K, we have computed the total column density of C18O listed in column 5 of Table 5. These values have been converted to visual extinction using the relationship of Hayakawa et al. (1999) for the Chamaeleon I dark cloud: . Next, the values of have been converted (see section 3.4) and these are listed in column 6 of Table 5. Assuming relative abundances of and , the gas mass of each clump has been computed and listed in column 7 of Table 5. Likewise, the mass of gas associated with each of the continuum sources SMM1-5 is listed in Table 6. The total gas mass (including the extended emission and all the clumps) is . Although this value is in good agreement with the mass derived independently from the total 350m dust emission, the fraction of mass in the extended emission (outside of SMM1-5) is 70% in C18O but only 40% in dust.
To study the C18O emission in greater detail, channel maps of C18O are shown in Figure 8. We have analyzed these maps in two ways: we first inspected the maps visually, then used an objective computer algorithm. In the visual method, we manually identified 26 cores in position-velocity space. Shown in Figure 9 is a grid of spectra constructed by integrating the emission in a aperture (0.24 pc) centered at the position of each core. The mass contained within these apertures represents about 40% of the total gas mass.
We next attempted to objectively analyze the C18O date cube by running the “clumpfind” program (Williams, de Geus & Blitz, 1994). This algorithm contours the data, locates the peaks and follows them to the low intensity limit without any constraint on the shape of the resulting clump. It was designed to operate on large scale maps of GMCs in which the emission is well separated into distinct clumps. Our data do not fit this description, as the cores are embedded in significant extended emission. Nevertheless, we proceeded and used the recommended contour levels by setting both the starting contour and the contour interval to be twice the RMS of the individual channel maps (0.6 Jy km s-1). The program identified 17 clumps, three of which were weak and centered slightly outside the primary beam (which we reject). The largest seven clumps range in mass from 200-1400 , while the smallest seven range from 18-94 . The fraction of mass placed into these 14 clumps is 45% of the total emission, which is quite similar to our visual technique. The emission from the several cores in the western ridge (2,4,5,6,7,8,10) were merged together by clumpfind into a single large clump in the late stages of the execution when the lowest contour levels are being examined. In a few other cases, two initial clumps merged into one. This merging effect of the algorithm explains the fewer number (but larger mass) of clumps found. The rest of the clumps are in good general agreement with our visual identification technique.
A Gaussian line profile has been fit to each C18O clump, and the corresponding velocity, amplitude and linewidth is given in Table 5. Using the linewidth () and aperture radius (), we compute the virial mass from the formula: (pc) (km2 s-2) (Caselli et al., 2002). In most cases, and in the overall sum, the virial masses of the clumps are quite similar to their C18O-derived masses, suggesting that the clumps are in hydrostatic equilibrium. In only three clumps does the C18O-derived mass exceed the virial mass by more than 50%. The highest excess (76%) is seen in clump 18, associated with the UCH II region. Two of these clumps (17 and 18) lie near the UCH II region and also exhibit the steepest spatial profiles, possibly suggesting an unstable condition. A cut along position angle in the velocity channel centered at 80.1 km s-1 is shown in Figure 10. The minimum in C18O emission corresponds to the presence of the free-free continuum emission along the southern portion of the shell structure seen in Figure 1, thus the steep profile may be due to interaction with the UCH II region. In any case, considering the uncertainties in the C18O mass calculations, the good agreement between the C18O mass and the virial mass is analagous to the results found in a survey of 40 lower-mass C18O clumps in the Taurus complex (Onishi et al., 1996).


3.6 Near-infrared point sources
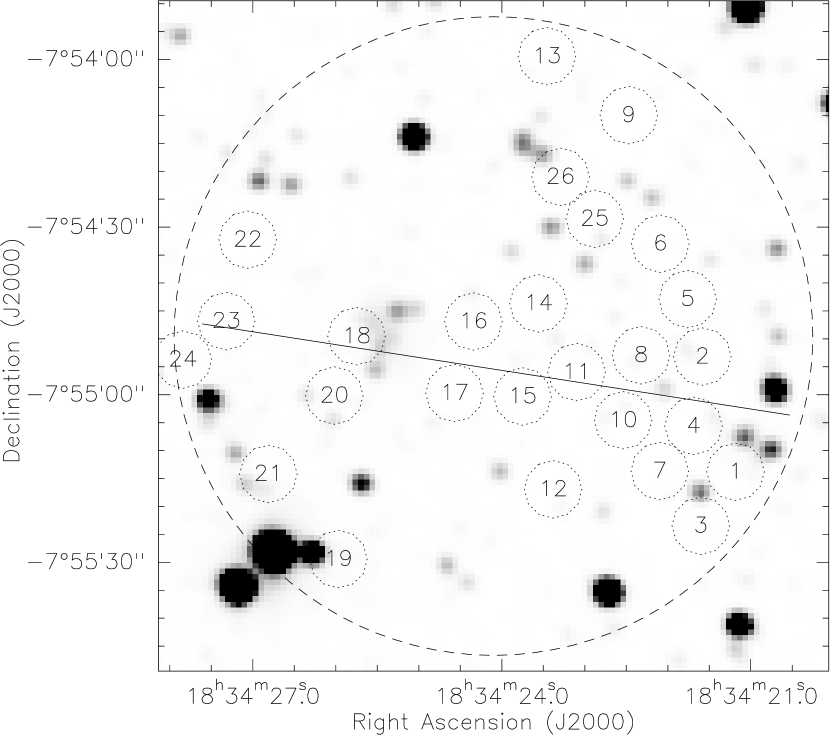
In the 2MASS All-Sky Data Release Point Source Catalog there are 123 objects within a radius of the UCH II position. Listed in Table 7 are the 44 of these stars that are detected in all three bands. The band image is shown in Figure 11 with the position of the C18O clumps indicated by dotted circles. In general, the non-coincidence between the two phenomena is striking. As listed in column 6 of Table 5, the extinction at K band through the C18O clumps ranges from 2.3 to 12.5 magnitudes, with a median value of 8.1. The faintest star detected has magnitude of 14.44 while the brightest upper limit has magnitude 10.11. Thus, even the brightest band star observed in the field (star 112 with ) would be undetected if placed behind the typical clump. This fact may account for the lack of stars seen toward the C18O clumps.
A () vs. () color-color diagram of the 2MASS stars is shown in Figure 12. The solid line marks the locus of main sequence stars and the dashed lines denote the reddening vector which is annotated in magnitudes of visual extinction. We see that 19 of the stars exhibit more than 10 magnitudes of visual extinction. Eleven of these 19 are located within the lowest C18O contours (see Figure 13) and are likely to be associated with the star-forming material of the cluster. For example, associated with the UCH II region is a small cluster of five stars. Of these five stars, star 92 is the object identified as an O8.5 star on the basis of its infrared spectrum (with weak HeI emission) (Hanson, Luhman, & Rieke, 2002). It lies near the peak of the millimeter continuum map and is one of the few stars that reside within any of the C18O clumps. The next closest star, number 86, lies close to the center of the shell structure seen in the millimeter continuum. Due to the presence of N III emission, it is classified as an O7 star. The ratio of He I to Br confirms the level of ionizing flux expected from such a star. To within a factor of two, it can account for all the Lyman continuum flux from the centimeter emission and probably explains the shell-like symmetry. Besides stars 86 and 92, three additional stars (4, 47 and 106) exhibit excess near-infrared emission (i.e. they lie to the right of the reddening vector in Figure 12) which may indicate the presence of circumstellar disks. Star 106 lies only from the center of SMM5, while star 47 lies at the edge of C18O clump 12. Star 4 sits just outside the BIMA primary beam where very little C18O has been detected.
The brightest star in the field, number 112, has magnitude 8.7 and the colors of an M2 star consistent with about 3 magnitudes of visual extinction. It could be a foreground giant at 1.8 kpc. There is no reference to it in the SIMBAD database.

4 Discussion
4.1 A protocluster of massive stars?
With the exception of the two O-stars associated with SMM1, and star 106 possibly associated with SMM5, none of the near-infrared stars are associated with the other submillimeter continuum or C18O cores. The “starless” continuum objects SMM2-SMM4 may harbor embedded ZAMS stars or protostars that are not yet visible in the near-infrared, while the C18O cores have not yet formed protostars. If so, they may resemble the lower mass prestellar cores detected by ISO (Bacmann et al., 2000). To examine this hypothesis, we can compare the limiting band magnitude of the 2MASS image with the expected brightness of an embedded ZAMS star with total luminosity equal to the dust luminosity of each core. It is difficult to estimate the individual luminosities of these cores due to the limited, coarse-resolution imaging data available on the mid-infrared side of their SEDs. However, using upper limits obtained from the MSX and IRAS images (as listed in Table 4) the luminosities of SMM3 and 4 are constrained to be in the range , depending on the dust temperature. Assuming the temperature of 25K derived for the region as a whole, yields a typical luminosity of consistent with a B0 star. A B0 star has absolute visual magnitude (Allen, 1976) and (Koornneef, 1983), yielding . At a distance of 4.9 kpc, this would be reduced to an apparent magnitude of 8.65. If such a star was placed at the center of the SMM4 dust cloud, a extinction of 6.4 magnitudes (see Table 1) would result, yielding a final magnitude of . By comparison, the faintest star detected in the 2MASS image has a magnitude of 14.44. Thus we cannot rule out the possibility that each submillimeter source (SMM2-5) may contain a ZAMS or main sequence star rather than a protostar. Deeper imaging in , or band would improve the constraints. At present, our best reasonable conclusion is that SMM2-5 contain some number of young stellar objects or main sequence stars with luminosities equivalent to at least a B-type star.
With the exception of SMM5, as one moves from east to west across the region, the general trend is for objects in the cluster to exhibit fewer signs of compact, energetic phenomena. SMM1 is associated with the well-developed UCH II region. The dust core (SMM2) associated with the water maser probably traces an intermediate stage indicative of outflow or disk activity from the protostar. The next two dust cores (SMM3 and SMM4) exhibit no maser activity or ionized gas. We note that the dust-derived masses for these two objects exceed but remain in reasonable agreement with the C18O-derived masses (within 27% and 45% respectively). In contrast, the dust-derived mass of the faintest submillimeter source (SMM5) is a factor of 3 larger than the C18O-derived mass. Unfortunately, the uncertainties in the mass estimates are too large for us to interpret this difference in physical terms (such as a depletion of CO, which has been seen in objects such as B68 by Bergin et al. (2002)). The other molecular cores not seen in continuum may be the youngest features in the region on their way to forming stars. Or they could simply be colder, inactive objects where the accompanying dust emission is below the detection threshold. Deeper and higher reoslution submillimeter observations are needed to explore these possibilities.
4.2 Fragmented structure
The C18O emission of IRAS 183170757 is distributed in clumps aligned roughly along an east-west ridge. Evidence of periodic density structure has been previously observed in C18O in giant molecular clouds, specifically Orion A (Dutrey et al., 1991). The typical spatial wavelength they find is 1 parsec, and the fragment masses range from 70-100 . More recently, fragmentation has been seen to extend to even smaller spatial scales in Orion from VLA observations of NH3 (Wiseman & Ho, 1998). Similarly, new observations of the mini-starburst W43 in submillimeter dust continuum reveal about 50 fragments with typical size of 0.25 pc and mass of 300 (Motte, Schilke, & Lis, 2003). In comparison, C18O maps of the Taurus complex reveal 40 dense cores of a similar typical size as those in W43 (0.23 pc) but with a smaller typical mass of 23 (Onishi et al., 1996). In IRAS 183170757 the typical spacing we find between the major C18O cores is roughly (0.5 pc), i.e. intermediate between Orion and W43, while our fragment masses range from 35-187 , i.e. intermediate between W43 and Taurus. The fraction of total mass that resides in C18O cores is 40% which is somewhat larger than the value of 20% seen in NH3 cores in W3OH (Tieftrunk et al., 1998), and the 19% seen in CS cores in Orion B (Lada, Bally & Stark, 1991). In any case, it is becoming clear that high-mass star formation regions, like their low-mass counterparts, contain a wealth of information on the mass spectrum of protostellar fragmentation. Whether these objects will all form stars remains unclear. A combination of single-dish and sensitive interferometric studies will be needed to better quantify the picture, especially down to the low mass end of the distribution.
4.3 Future work
High resolution mid and far infrared imaging is needed to accurately determine the temperature and size of the individual dust cores presently identified, and to search for lower mass objects. Deeper imaging in the near-infrared is needed to search for additional ZAMS stars at high extinction levels within the dust and C18O cores. Also, narrow band imaging in lines and (sub)millimeter interferometric imaging of SiO transitions may help distinguish which of the cores show jets and outflows. Submillimeter interferometry with higher spectral resolution in other optically-thin tracers less affected by depletion would be useful to search for evidence of active infall toward the C18O cores identified in this work. Finally, interferometric observations of the 22 GHz or submillimeter water maser transitions would be quite useful to better localize the maser activity to SMM2 or one of the C18O cores222VLA observations undertaken by the authors on 2004 January 08 (project AH833) in B-configuration have resolved a pair of 22 GHz water maser spots: one (at 18:34:23.99, -07:54:48.4) coincident with the submillimeter continuum source SMM 2 and the other one (at 18:34:24.49, -07:54:47.5) coincident with the molecular gas clump number 16..
5 Conclusions
Our high angular resolution observations of the luminous (log(L/)=5.2), massive star-forming region IRAS 183170757 have revealed a complex field of objects likely to be in various stages of star formation. Of the five submillimeter dust cores, one is associated with the UCH II region G23.955+0.150, and another with a water maser. The 2.7mm continuum is completely dominated by free-free emission from the UCH II region, with total flux and morphology in agreement with VLA centimeterwave maps. For the other four objects, the upper limits found at 2.7mm and in the MSX mid-infrared band are consistent with pure optically-thin dust emission at temperatures of 13-40 K and a dust grain emissivity index . Three out of four of these objects have no associated 2MASS star, and they are each likely to contain at least one (proto)star of luminosity 1000-40000 . In addition, we have identified two dozen C18O cores in this region which contain of the total molecular gas mass () present. Their typical size is 0.25 pc and linewidth is 2-3 km s-1. While the overall extent of the C18O and dust emission is similar, most of the emission peaks do not correlate well in detail. Compared to the dust emission, a greater fraction of the C18O emission exists in extended features. At least 11 of the 123 infrared stars identified by 2MASS in this region are likely to be embedded in the star-forming material, including two O stars powering the UCH II emission. Most of the rest of the reddened stars anti-correlate with the position of the dust and C18O cores and are likely visible simply due to the relatively lower extinction. In summary, our observations indicate that considerable fragmentation of the molecular cloud has taken place during the time required for the UCH II region to form and for the O stars to become detectable at infrared wavelengths. Additional star formation appears to be ongoing throughout the region with evidence for up to four B-type (proto)stars scattered amongst more than two dozen molecular gas cores.
References
- Allen (1976) Allen, C. W. 1976, Astrophysical Quantities, Third Edition, London, The Athlone Press
- Altenhoff et al. (1979) Altenhoff, W. J., Downes, D., Pauls, T., & Schraml, J. 1979, A&AS, 35, 23
- Aumann, Fowler, & Melnyk (1990) Aumann, H. H., Fowler, J. W., & Melnyk, M. 1990, AJ, 99, 1674
- Bacmann et al. (2000) Bacmann, A., Andre, P., Puget, J.- L., Abergel, A., Bontemps, S. & Ward-Thompson, D. 2000, A&A, 361, 555
- Baudry et al. (1997) Baudry, A., Desmurs, J. F., Wilson, T. L., & Cohen, R. 1997, A&A, 325, 255
- Becker et al. (1994) Becker, R. H., White, R. L., Helfand, D. J., & Zoonematkermani, S. 1994, ApJS, 91, 347
- Bergin et al. (2002) Bergin, E. A., Alves, J., Huard, T., Lada, C. J. 2002, ApJ, 570, L101
- Bohlin, Savage & Drake (1978) Bohlin, R. C., Savage, B. D., & Drake, J. F. 1978, ApJ, 224, 132
- Caselli et al. (2002) Caselli, P., Benson, P. J., Myers, P. C., & Tafalla, M. 2002, ApJ, 572, 238.
- Cesaroni et al. (1994) Cesaroni, R., Churchwell, E., Hofner, P., Walmsley, C. M., & Kurtz, S. 1994, A&A, 288, 903
- Chan, Henning, & Schreyer (1996) Chan, S. J., Henning, T., & Schreyer, K. 1996, A&AS, 115, 285
- Chini et al. (1986) Chini, R., Kreysa, E., Mezger, P. G., & Gemünd, H.- P. 1986, A&A, 154, L8
- Chini, Krügel, & Wargau (1987) Chini, R., Krügel, E., & Wargau, W. 1987, A&A, 181, 378
- Churchwell, Walmsley, & Cesaroni (1990) Churchwell, E., Walmsley, C. M., & Cesaroni, R. 1990, A&AS, 83, 119
- Cutri et al. (2003) Cutri, R. M., Skrutskie, M. F., van Dyk, S., Beichman, C. A., Carpenter, J. M., et al. 2003, yCat, 2246, 0C
- Dutrey et al. (1991) Dutrey, A., Langer, W. D., Balley, J., Duvert, G., Castets, A., & Wilson, R.W. 1991, A&A, 247, L9
- Egan et al. (1999) Egan, M.P., Price, S.D., Moshir, M.M., Cohen, M., Tedesco, E., et al. 1999, yCat, 5107, 0E
- Furuya et al. (2002) Furuya, R.S., Cesaroni, R., Codella, C., Testi, L., Bachiller, R., Tafalla, M. 2002, A&A, 3901, l1
- Garwood et al. (1988) Garwood, R. W., Perley, R. A., Dickey, J. M., & Murray, M. A. 1988, AJ, 96, 1655
- Genzel & Downes (1977) Genzel, R., & Downes, D. 1977, A&AS, 30, 145
- Handa et al. (1987) Handa, T., Sofue, Y., Nakai, N., Hirabayashi, H., Inoue, M. 1987, PASJ, 39, 709
- Hanson, Luhman, & Rieke (2002) Hanson, M. M., Luhman, K. L., & Rieke, G. H. 2002, ApJS, 138, 35
- Hayakawa et al. (1999) Hayakawa, T., Mizuno, A., Onishi, T., Yonekura, Y., Hara, A. et al. 1999, PASJ, 51, 919
- Hunter (1997) Hunter, T.R. 1997, Ph.D. Thesis, California Institute of Technology
- Hunter et al. (1998) Hunter, T. R., Neugebauer, G., Benford, D. J., Matthews, K., Lis, D. C., Serabyn, E., Phillips, T. G. 1998, ApJ, 493, L97
- Hunter et al. (2000) Hunter, T. R., Churchwell, E., Watson, C., Cox, P., et al. 2000, AJ, 119, 2711
- Kim & Koo (2001) Kim, K.- T., & Koo, B.- C. 2001, ApJ, 549, 979
- Hildebrand (1983) Hildebrand, R.H. 1983, QJRAS, 24, 267
- Koornneef (1983) Koornneef, J. 1983, A&A, 128, 84
- Lada, Bally & Stark (1991) Lada, E. A., Bally, J., & Stark, A. A. 1991, ApJ, 358, 432
- Lockman (1989) Lockman, F. J. 1989, ApJS, 71, 469
- Lonsdale-Persson & Helou (1987) Lonsdale Persson, C. J., & Helou, G. 1987, ApJ, 314, 513
- Mezger (1994) Mezger, P. G. 1994, Astr. and Space Science, 212, 197
- Molinari et al. (1998) Molinari, S., Testi, L., Brand, J., Cesaroni, R., Palla, F. 1998, ApJ, 505 L39
- Moorwood & Salinari (1981) Moorwood, A. F. M., & Salinari, P. 1981, A&A, 94, 299
- Motte, Schilke, & Lis (2003) Motte, F., Schilke, P., & Lis, D. C. 2003, ApJ, 582, 277
- Mueller et al. (2002) Mueller, K. E., Shirley, Y. L., Evans, N. J., & Jacobson, H. R. 2002, ApJS, 143, 469
- Onishi et al. (1996) Onishi, T., Mizuno, A., Kawamura, A., Ogawa, H., & Fukui, Y. 1996, ApJ, 465, 815
- Pankonin et al. (2001) Pankonin, V., Churchwell, E., Watson, C., & Bieging, J. H. 2001, ApJ, 558, 194
- Peeters et al. (2002) Peeters, E., Martin-Hernandez, N. L., Damour, F., Cox, P. et al. 2002, a&a, 381, 571
- Plume, Jaffe, & Evans (1992) Plume, R., Jaffe, D. T., & Evans, N. J. 1992, ApJS, 78, 505
- Predehl & Schmitt (1995) Predehl, P. & Schmitt, J. 1995, A&A, 293, 889
- Rieke & Lebofsky (1985) Rieke, G. H., & Lebofsky, M. J., 1985, ApJ, 288, 618
- Ryter (1996) Ryter, C. 1996, Ap&SS, 236, 285
- Scoville et al. (1986) Scoville, N. Z., Sargent, A. I., Sanders, D. B., Claussen, M. J., Masson, C. R., et al. 1986, ApJ, 303, 416
- Shepherd & Churchwell (1996) Shepherd, D. S., & Churchwell, E. 1996, ApJ, 457, 267
- Simpson et al. (1995) Simpson, J. P., Colgan, S. W. J., Rubin, R. H., Erickson, E. F., & Haas, M. R. 1995, ApJ, 444, 721
- Sodroski et al. (1997) Sodroski, T. J., Odegard, N., Arendt, R. G., Dwek, E., Weiland, J. L., Hauser, M. G., & Kelsall, T. 1997, ApJ, 480, 173
- Sridharan et al. (2002) Sridharan, T. K., Beuther, H., Schilke, P., Menten, K. M., & Wyrowski, F. 2002, ApJ, 566, 931
- Szymczak, Hrynek, & Kus (2000) Szymczak, M., Hrynek, G. & Kus, A. J. 2000, A&AS, 143, 269
- Testi et al. (2000) Testi, L., Hofner, P., Kurtz, S., & Rupen, M. 2000, A&A, 359, L5
- Tieftrunk et al. (1998) Tieftrunk, A. R., Megeath, S. T., Wilson, T. L., & Rayner, J. T. 1998, A&A, 336, 991
- Walsh et al. (1997) Walsh, A. J, Hyland, A. R., Robinson, G., & Burton, M. G. 1997, MNRAS, 291, 261
- Welch et al. (1996) Welch, W.J., Thornton, D. D., Plambeck, R. L., Wright, M. C. H. et al. 1996, PASP, 108, 93
- Whittet (1981) Whittet, D. C. B. 1981, MNRAS, 196, 469
- Williams, de Geus & Blitz (1994) Williams, J. P., de Geus, E. J., & Blitz, L. 1994, ApJ, 428, 693
- Wink, Altenhoff, & Mezger (1982) Wink, J. E., Altenhoff, W. J., & Mezger, P. G. 1982, A&A, 108, 227
- Wink, Wilson, & Bieging (1983) Wink, J. E., Wilson, T. L., & Bieging, J. H. 1983, A&A, 127, 211
- Wiseman & Ho (1998) Wiseman, J. J., & Ho, P. T. P. 1998, ApJ, 502, 676
- Wood, Churchwell, & Salter (1988) Wood, D. O. S., Churchwell, E., & Salter, C. J. 1988, ApJ, 325, 694
- Wood & Churchwell (1989) Wood, D. O. S., & Churchwell, E. 1989, ApJS, 69, 831
| Coordinates (J2000) | Flux densityaaWithin aperture, as shown in Figure 2 (Jy) | MassddAssuming T=25K and grain emissivity Q=1.0E-04 at m (Hildebrand, 1983) | log()eeAssuming uniform emission of diameter of (0.25 pc) | ffExtinction to a star at the center of the dust core, i.e. half the column density | ffExtinction to a star at the center of the dust core, i.e. half the column density | |||
|---|---|---|---|---|---|---|---|---|
| Source | R.A. | Decl. | m | 2.7mm | cm-2 | mag | mag | |
| SMM1 | 18:34:25.4 | :54:49 | 140 | 15.7 | ||||
| SMM2 | 18:34:24.0 | :54:50 | bbUpper limits are | 144 | 16.1 | |||
| SMM3 | 18:34:21.8 | :55:05 | bbUpper limits are | 66 | 7.4 | |||
| SMM4 | 18:34:21.7 | :54:44 | bbUpper limits are | 57 | 6.4 | |||
| SMM5 | 18:34:26.5 | :54:36 | bbUpper limits are | 52 | 5.8 | |||
| Extended | ||||||||
| TotalccTotal flux including extended emission within dotted region of Figure 2 | ||||||||
| Frequency (GHz) | Wavelength (m) | Flux (Jy) | Aperture/beamsize | Instrument | Reference |
|---|---|---|---|---|---|
| 3.8 | 0.885aaaperture did not cover the UCH II position | CFHT | 1 | ||
| 4.6 | 0.902aaaperture did not cover the UCH II position | CFHT | 1 | ||
| 8.3 | MSX | this work | |||
| 12 | IRAS | 2 | |||
| 12.1 | MSX | this work | |||
| 14.7 | MSX | this work | |||
| 21.3 | MSX | this work | |||
| 25 | IRAS | 2 | |||
| 33.5 | KAO | 3 | |||
| 36 | KAO | 3 | |||
| 51 | KAO | 3 | |||
| 57.3 | KAO | 3 | |||
| 60 | IRAS | 2 | |||
| 88.4 | KAO | 3 | |||
| 100 | IRAS | 2 | |||
| 857 | 352 | CSO/SHARC | 4 | ||
| 857 | 352 | CSO/SHARC | this work | ||
| 230 | 1.3 mm | IRTF | 2 | ||
| 110 | 2.725 mm | NRAO 12m | 5 | ||
| 110 | 2.735 mm | BIMA | this work | ||
| 86 | 3.486 mm | NRAO 11m | 6 | ||
| 14.94 | 2.007 cm | 0.536 bbmeasurements suffer from missing flux | VLA-B | 7 | |
| 14.8 | 2.0 cm | Effelsberg 100m | 6 | ||
| 10.3 | 2.91 cm | NRO-45m | 8 | ||
| 8.875 | 3.378 cm | Effelsberg 100m | 6 | ||
| 4.9 | 6.1 cm | VLA-B | 9 | ||
| 4.875 | 6.15 cm | Effelsberg 100m | 6 | ||
| 4.875 | 6.15 cm | Effelsberg 100m | 10 | ||
| 4.860 | 6.17 cm | 0.227 bbmeasurements suffer from missing flux | VLA-A/B | 7 | |
| 1.527 | 19.6 cm | VLA-B | 9 | ||
| 1.527 | 19.6 cm | VLA-B | 11 | ||
| 1.425 | 21.0 cm | VLA-DnC | 12 |
References: (1) Chini, Krügel, & Wargau (1987); (2) Chini et al. (1986); (3) Simpson et al. (1995); (4) Mueller et al. (2002); (5) Wood, Churchwell, & Salter (1988); (6) Wink, Altenhoff, & Mezger (1982); (7) Wood & Churchwell (1989); (8) Handa et al. (1987); (9) Becker et al. (1994); (10) Altenhoff et al. (1979); (11) Garwood et al. (1988); (12) Kim & Koo (2001).
| Component | T (K) | L () | M () | ||
|---|---|---|---|---|---|
| cold dust | 25 | 2.0 | 0.38 | 50,000 | 7200 |
| warm dust | 63 | 2.0 | 0.062 | 110,000 | 70 |
| total dust | 160,000 | 7300 | |||
| free-free | |||||
| Component | Infrared limit | T (K) | L () | M () | ||
|---|---|---|---|---|---|---|
| SMM3 | Jy at m | 17-41 | 2.0 | 0.30-0.049 | 1400-39000 | 270-1600 |
| SMM4 | Jy at m | 14-41 | 2.0 | 0.48-0.044 | 630-38000 | 240-2600 |
| aValue fixed in fit |
| R.A. | Dec | Emission | log() | aa computed from using formula from Hayakawa et al. (1999), and converted to using Rieke & Lebofsky (1985). | bbMass computed using formula from Scoville et al. (1986) assuming optically-thin gas at 25K and [12CO/C18O]=490 and [H2/CO]=104, yielding a conversion factor of 8.35 (Jy km s-1)-1. | Velocity | Peak flux | Linewidth | ||
|---|---|---|---|---|---|---|---|---|---|---|
| # | J2000 | J2000 | Jy km s-1 | cm-2 | mag. | M⊙ | km s-1 | Jy beam-1 | km s-1 | M⊙ |
| 1 | 18:34:21.183 | -07:55:13.78 | 14.3 | 16.39 | 8.1 | 119 | 110 | |||
| 2 | 18:34:21.583 | -07:54:53.17 | 16.7 | 16.46 | 9.5 | 139 | 120 | |||
| 3 | 18:34:21.602 | -07:55:23.45 | 14.3 | 16.39 | 8.1 | 120 | 110 | |||
| 4 | 18:34:21.689 | -07:55:05.58 | 17.9 | 16.49 | 10.2 | 150 | 115 | |||
| 5 | 18:34:21.760 | -07:54:42.88 | 14.8 | 16.40 | 8.3 | 123 | 136 | |||
| 6 | 18:34:22.090 | -07:54:32.96 | 11.3 | 16.29 | 6.5 | 94 | 147 | |||
| 7 | 18:34:22.097 | -07:55:13.66 | 18.9 | 16.51 | 10.6 | 158 | 120 | |||
| 8 | 18:34:22.321 | -07:54:52.93 | 14.7 | 16.40 | 8.3 | 123 | 115 | |||
| 9 | 18:34:22.470 | -07:54:09.96 | 3.8 | 15.82 | 2.3 | 32 | 42 | |||
| 10 | 18:34:22.539 | -07:55:04.57 | 17.3 | 16.48 | 9.9 | 145 | 120 | |||
| 11 | 18:34:23.098 | -07:54:55.95 | 22.1 | 16.58 | 12.5 | 185 | 168 | |||
| 12 | 18:34:23.381 | -07:55:16.93 | 10.7 | 16.27 | 6.2 | 90 | 154 | |||
| 13 | 18:34:23.457 | -07:53:59.41 | 10.3 | 16.25 | 5.9 | 86 | 168 | |||
| 14 | 18:34:23.558 | -07:54:43.66 | 11.3 | 16.29 | 6.5 | 94 | 122 | |||
| 15 | 18:34:23.750 | -07:55:00.31 | 18.5 | 16.51 | 10.6 | 155 | 161 | |||
| 16 | 18:34:24.341 | -07:54:46.89 | 14.7 | 16.40 | 8.3 | 123 | 131 | |||
| 17 | 18:34:24.570 | -07:54:59.70 | 17.1 | 16.47 | 9.7 | 143 | 113 | |||
| 18 | 18:34:25.749 | -07:54:49.53 | 21.0 | 16.56 | 11.9 | 176 | 100 | |||
| 19 | 18:34:25.968 | -07:55:29.42 | 7.4 | 16.11 | 4.3 | 62 | 36 | |||
| 20 | 18:34:26.017 | -07:55:00.15 | 18.3 | 16.50 | 10.4 | 153 | 115 | |||
| 21 | 18:34:26.812 | -07:55:14.18 | 8.5 | 16.17 | 5.0 | 71 | 49 | |||
| 22 | 18:34:27.061 | -07:54:32.24 | 8.6 | 16.17 | 5.0 | 72 | 81 | |||
| 23 | 18:34:27.319 | -07:54:46.83 | 13.0 | 16.35 | 7.4 | 108 | 110 | |||
| 24 | 18:34:27.843 | -07:54:53.72 | 12.0 | 16.31 | 6.8 | 100 | 81 | |||
| 25 | 18:34:22.880 | -07:54:28.50 | 8.5 | 15.25 | 5.0 | 71 | 110 | |||
| 26 | 18:34:23.292 | -07:54:21.00 | 5.0 | 15.02 | 3.0 | 42 | 81 | |||
| Total clump component | 352 | 2930 | 2915 | |||||||
| Extended component | 527 | 4410 | ||||||||
| Total emission | 879 | 7340 | ||||||||
| EmissionaaNot corrected for primary beam attenuation | MassbbMass computed using formula from Scoville et al. (1986) assuming optically-thin gas at 25K and [12CO/C18O]=490 and [H2/CO]=104. | |
| # | Jy km s-1 | M⊙ |
| SMM1 | 53.5 | 450 |
| SMM2 | 72.7 | 610 |
| SMM3 | 60.1 | 500 |
| SMM4 | 45.9 | 380 |
| SMM5 | 20.3 | 170 |
| Extended | 620 | 5200 |
| Total | 870 | 7300 |
| # | 2MASS PSC |
|---|---|
| 1 | 18342011-0755050 |
| 4aaStars with , according to the color-color diagram shown in Figure 12 | 18342057-0755207 |
| 5 | 18342064-0754497 |
| 6 | 18342066-0754341 |
| 7 | 18342067-0754593 |
| 8aaStars with , according to the color-color diagram shown in Figure 12 | 18342072-0755099 |
| 9 | 18342080-0754450 |
| 13 | 18342105-0755076 |
| 18 | 18342147-0754360 |
| 20 | 18342159-0755177 |
| 22aaStars with , according to the color-color diagram shown in Figure 12 | 18342166-0754189 |
| 23aaStars with , according to the color-color diagram shown in Figure 12 | 18342173-0754530 |
| 27aaStars with , according to the color-color diagram shown in Figure 12 | 18342201-0754594 |
| 29 | 18342216-0754251 |
| 31 | 18342246-0754219 |
| 37 | 18342269-0755357 |
| 39aaStars with , according to the color-color diagram shown in Figure 12 | 18342276-0755213 |
| 42aaStars with , according to the color-color diagram shown in Figure 12 | 18342290-0754516 |
| 43 | 18342298-0754369 |
| 47aaStars with , according to the color-color diagram shown in Figure 12 | 18342326-0755195 |
| 48aaStars with , according to the color-color diagram shown in Figure 12 | 18342333-0754504 |
| 49aaStars with , according to the color-color diagram shown in Figure 12 | 18342337-0754304 |
| 50 | 18342348-0754172 |
| 51aaStars with , according to the color-color diagram shown in Figure 12 | 18342349-0754103 |
| 53 | 18342371-0754156 |
| 55 | 18342385-0754347 |
| 59 | 18342399-0755140 |
| 67aaStars with , according to the color-color diagram shown in Figure 12 | 18342438-0755341 |
| 72aaStars with , according to the color-color diagram shown in Figure 12 | 18342463-0755311 |
| 76 | 18342487-0753549 |
| 79aaStars with , according to the color-color diagram shown in Figure 12 | 18342503-0754140 |
| 86aaStars with , according to the color-color diagram shown in Figure 12 | 18342523-0754455 |
| 92aaStars with , according to the color-color diagram shown in Figure 12 | 18342551-0754473 |
| 96 | 18342566-0755162 |
| 99 | 18342580-0754214 |
| 106aaStars with , according to the color-color diagram shown in Figure 12 | 18342624-0754379 |
| 107aaStars with , according to the color-color diagram shown in Figure 12 | 18342627-0755288 |
| 108aaStars with , according to the color-color diagram shown in Figure 12 | 18342633-0755004 |
| 111 | 18342652-0754227 |
| 112 | 18342673-0755285 |
| 118 | 18342720-0755108 |
| 119 | 18342730-0754170 |
| 122 | 18342752-0755014 |
| 123 | 18342753-0755053 |