Quantitative size-dependent structure and strain determination of CdSe nanoparticles using atomic pair distribution function analysis
Abstract
The size-dependent structure of CdSe nanoparticles, with diameters ranging from 2 to 4 nm, has been studied using the atomic pair distribution function (PDF) method. The core structure of the measured CdSe nanoparticles can be described in terms of the wurtzite atomic structure with extensive stacking faults. The density of faults in the nanoparticles % . The diameter of the core region was extracted directly from the PDF data and is in good agreement with the diameter obtained from standard characterization methods suggesting that there is little surface amorphous region. A compressive strain was measured in the Cd-Se bond length that increases with decreasing particle size being 0.5% with respect to bulk CdSe for the 2 nm diameter particles. This study demonstrates the size-dependent quantitative structural information that can be obtained even from very small nanoparticles using the PDF approach.
pacs:
61.46.Df, 61.10.-i, 78.66.Hf, 61.46.-wI Introduction
Semiconductor nanoparticles are of increasing interest for both applied and fundamental research. Wurtzite-structured cadmium selenide is an important II-VI semiconducting compound for optoelectronics. Hodes et al. (1987) CdSe quantum dots are the most extensively studied quantum nanostructure because of their size-tunable properties, and they have been used as a model system for investigating a wide range of nanoscale electronic, optical, optoelectronic, and chemical processes. Tolbert and Alivisatos (1994) CdSe also provided the first example of self-assembled semiconductor nanocrystal superlattices. Murray et al. (1995) With a direct band gap of 1.8 eV, CdSe quantum dots have been used for laser diodes Colvin et al. (1994), nanosensing Tran et al. (2002) , and biomedical imaging. Bruchez et al. (1998) In fundamental research, particles with a diameter in the 1-5 nm range are of particular importance since they cover the transition regime between the bulk and molecular domains where quantum size effects play an important role. Significant deviation from bulk properties are expected for particles with diameter below 5 nm, and were observed in many cases Bruchez et al. (1998); Li and Alivisatos (2003) as well as in this study.
Accurate determination of atomic scale structure, homogeneous and inhomogeneous strain, structural defects and geometrical particle parameters such as diameter and shape, are important for understanding the fundamental mechanisms and processes in nanostructured materials. However, difficulties are experienced when standard methods are applied to small nanoparticles. In this domain the presumption of a periodic solid, which is the basis of a crystallographic analysis, breaks down. Quantitative determinations of the nanoparticle structure require methods that go beyond crystallography. This was noted early on in a seminal study by Bawendi et al. Bawendi et al. (1989) where they used the Debye equation, which is not based on a crystallographic assumption, to simulate semi-quantitatively the scattering from some CdSe nanoparticles. However, despite the importance of knowing the nanoparticle structure quantitatively with high accuracy, this work has not been followed up with application of modern local structural methods Egami and Billinge (2003); Billinge and Kanatzidis (2004) until recently. Gilbert et al. (2004); Neder and Korsunskiy (2005); Howell et al. (2006); Page et al. (2004); Petkov et al. (2005a); Gateshki et al. (2005) In this study we return to the archetypal CdSe nanoparticles to investigate the extent of information about size-dependent structure of nanoparticles from the atomic pair distribution function (PDF) method. This is a local structural technique that yields quantitative structural information on the nanoscale from x-ray and neutron powder diffraction data. Billinge and Kanatzidis (2004) Recent developments in both data collection Chupas et al. (2003); Proffen et al. (2002) and modeling Proffen and Billinge (1999); Tucker et al. (2001) make this a potentially powerful tool in the study of nanoparticles. Additional extensions to the modelling are necessary for nanoparticles, and some of these have been successfully demonstrated. Gilbert et al. (2004); Neder and Korsunskiy (2005); Kumpf et al. (2005)
In this paper, we present a detailed analysis of the structural information available from PDF data on (2-4 nm) CdSe nanoparticles. The PDF method is demonstrated here as a key tool that can yield precise structural information about the nanoparticles such as the atomic structure size of the core, the degree of crystallinity, local bonding, the degree of the internal disorder and the atomic structure of the core region, as a function of the nanoparticle diameter. Three CdSe nanoparticle samples with different diameters that exhibit different optical spectra have been studied. The purpose of this paper is not only to explain the PDF data of CdSe nanoparticles through a modeling process, but also to systematically investigate the sensitivity of the PDF data to subtle structural modifications in nanoparticles relative to bulk material.
The measurement of the nanoparticle size can lead to significantly different results when performed by different methods, and there is no consensus as to which is the most reliable. Wickham et al. (2000); Nanda et al. (2000) It is also not clear that a single diameter is sufficient to fully specify even a spherical particle since the presence of distinct crystalline core and disordered surface regions have been postulated. Bawendi et al. (1989)
Powder diffraction is a well established method for structural and analytical studies of crystalline materials, but the applicability to such small particles of standard powder diffraction based on crystallographic methods is questionable and likely to be semi-quantitative at best. Palosz et al. Palosz et al. (2002) have shown that the conventional tools developed for elaboration of powder diffraction data are not directly applicable to nanocrystals. Palosz et al. (2002) There have been some reports Borchert et al. (2005); Nanda et al. (2000); Bawendi et al. (1989) in the past few years extracting nanoparticle diameter from x-ray diffraction (XRD) using the Scherrer formula, which is a phenomenological approach that considers the finite size broadening of Bragg-peaks. Guinier (1963) This approach will decrease in accuracy with decreasing particle size, and for particle sizes in the range of a few nanometers the notion of a Bragg peak becomes moot. Palosz et al. (2002) At this point the Debye formula Debye (1915) becomes the more appropriate way to calculate the scattering. Bawendi et al. (1989) The inconsistency between the nanoparticle diameter determined from the standard characterization methods and the diameter obtained by applying the Scherrer formula have been observed by several authors. Bawendi et al. (1989); Nanda et al. (2000); Kaszkur (2006)
Previous studies of CdSe nanoparticle structure have demonstrated the sensitivity of the XRD pattern to the presence of planar disorder and thermal effects due to nano-size effects. Murray et al. (1993); Bawendi et al. (1989) The diffraction patterns of CdSe nanoparticles smaller than 2.0 nm have been observed to appear markedly different from those of the larger diameters (see Ref. Murray et al., 1993 Fig. 11), the large attenuation and broadening in the Bragg reflections in these small nanoparticles, making the distinction between wurtzite and zinc-blende hard using conventional XRD methods. Murray et al. Murray et al. (1993) reported that the combination of X-ray studies and TEM imaging yields a description of the average CdSe nanoparticle structure. Strict classification of the CdSe nanoparticles structure as purely wurtzite or zinc-blend is potentially misleading. Murray et al. (1993) Bawendi et al. Bawendi et al. (1989) reported that CdSe nanoparticles are best fit by a mixture of crystalline structures intermediate between zinc-blend and wurtzite. Here we apply the PDF method to CdSe nanoparticles and refine quantitative structural parameters to a series of CdSe nanoparticles of different sizes.
Strain in nano systems has been observed before in different studies, as well as in this study. Using combined PDF and extended X-ray-absorbtion fine structure (EXAFS) methods, Gilbertet al. Gilbert et al. (2004) observed a compressive strain compared to the bulk in ZnS nanocrystals. Using an electric field-induced resonance method, Chen et al. Chen et al. (2006) detected the enhancement of Young’s modulus of ZnO nanowires along the axial direction when the diameters are decreased. Very recently, Quyang et al. Ouyang et al. (2006) developed an analytical model for the size-induced strain and stiffness of a nanocrystal from the perspective of thermodynamics and a continuum medium approach. It was found theoretically that the elastic modulus increases with the inverse of crystal size and vibration frequency is higher than that of the bulk. Ouyang et al. (2006) Experimentally, the Cd = first-neighbor distances have been studied using both XRD and EXAFS methods. Marcus et al. (1992) The distances were found smaller than those in the bulk compounds by less than 1.0%. Herron et al. Herron et al. (1993) studied CdS nanocrystals and showed a bond contraction of % compared to the bulk. Carter et al. Carter et al. (1997) studied a series of CdSe nanoparticles using the EXAFS method. In the first shell around both the Se and Cd atoms, they found essentially no change in the first-neighbor distance. Chaure et al. Chaure et al. (2005) studied the strain in nanocrystalline CdSe thin films, using Raman scattering and observed a peak shift with decrease in particle size, which was attributed to the increase in stress with decreasing particle size. Chaure et al. (2005)
Local structural deviations or disorder mainly affect the diffuse scattering background. The XRD experiments probe for the presence of periodic structure which are reflected in the Bragg peaks. In order to have information about both long-range order and local structure disorder, a technique that takes both Bragg and diffuse scattering need to be used, such as the PDF technique. Here we apply the PDF method to study the structure, size and strain in CdSe nanoparticles as a function of nanoparticle diameter. The core structure of the CdSe nanoparticles can be described by a mixture of crystalline structures intermediate between zinc-blend and wurtzite, which is wurtzite containing a stacking fault density (SFD) of up to %, with no clear evidence of a disordered surface region, certainly down to 3 nm diameter. The structural parameters are reported quantitatively. We measure a size-dependent strain on the Cd-Se bond which reaches 0.5% at the smallest particle size. The size of the well-ordered core extracted directly from the data agrees with the size determined from other methods.
II experimental details
II.1 Sample preparation
CdSe nanoparticles were synthesized from cadmium acetate, selenium, trioctyl phosphine and trioctyl phosphine oxide. Sixty four grams of trioctylphosphine oxide (TOPO) containing cadmiumacetate was heated to 360∘C under flowing argon. Cold stock solution (38.4 ml) of (Se:trioctylphosphine = 2:100 by mass) was quickly injected into the rapidly stirred, hot TOPO solution. The temperature was lowered to 300∘C by the injection. At various time intervals, 5-10 ml aliquots of the reaction mixture were removed and precipitated in 10 ml of methanol. The color of the sample changed from bright yellow to orange to red to brown with time interval variation from 20 seconds to 1200 seconds. Three nanoparticle sizes, CdSeI (small), CdSeII (medium) and CdSeIII (large), were used for this study, as well as a bulk CdSe sample for reference.
The samples were further purified by dissolving and centrifuging in methanol to remove excess TOPO. This process also resulted in a narrower particle size distribution. The transmission electron micrograph (TEM) images (Fig. 1) show uniformly sized
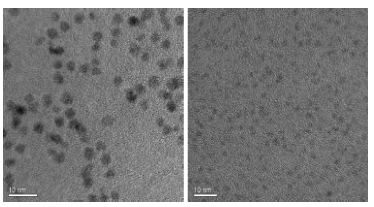
nanoparticles with no signs of aggregation. The ultraviolet visible (UV-vis) absorption and photoluminescence (PL) spectra of the aliquots were recorded by redissolving the nanocrystals in toluene. The spectra are shown in Fig. 2.
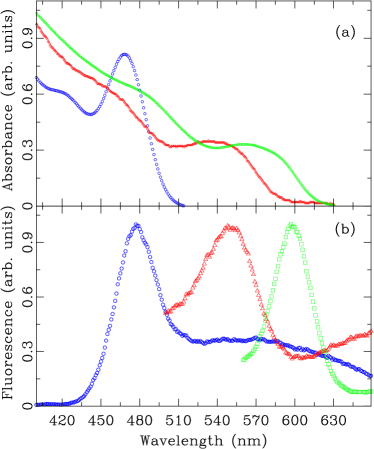
The band-gap values obtained for the measured samples can be correlated with the diameter of the nanoparticles based on the table provided in supplementary information of Peng et al. Peng et al. (1998) using the data on exciton peaks measured with UV-visible light absorption, and photoluminescence peaks. The particle sizes were measured by TEM as well. The measured values of particle diameter using these various methods are summarized in Table 1.
| CdSeIII | CdSeII | CdSeI | |
|---|---|---|---|
| Nucleation time (s) | 1200 | 630 | 15 |
| Diameter (nm) | |||
| TEM | 3.5(2) | 2.7(2) | 2.0(2) |
| UV-vis | 3.5(4) | 2.9(3) | 1.90 |
| PL | 3.6(4) | 2.9(3) | 2.1 |
| 3.7(1) | 3.1(1) | 2.2(2) |
II.2 The atomic PDF method
The atomic PDF analysis of x-ray and neutron powder diffraction data is a powerful method for studying the structure of nanostructured materials. Billinge and Kanatzidis (2004); Egami and Billinge (2003); Petkov et al. (2000, 2002, 2004); Juhas et al. (2006) Recently, it has been explicitly applied to study the structure of discrete nanoparticles. Zhang et al. (2003); Gilbert et al. (2004); Neder and Korsunskiy (2005); Petkov et al. (2005b); Juhas et al. (2006) The PDF method can yield precise structural and size information, provided that special care is applied to the measurement and to the method used for analyzing the data. The atomic PDF, , is defined as
| (1) |
where is the atomic pair-density, is the average atomic number density and is the radial distance. Warren (1990) The PDF yields the probability of finding pairs of atoms separated by a distance . It is obtained by a sine Fourier transformation of the reciprocal space total scattering structure function , according to
| (2) |
where is obtained from a diffraction experiment. This approach is widely used for studying liquids, amorphous and crystalline materials, but has recently also been successfully applied to nanocrystalline materials. Billinge and Kanatzidis (2004)
II.3 High-energy x-ray diffraction experiments
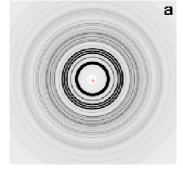
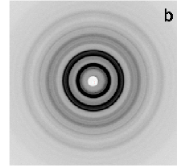
X-ray powder diffraction experiments to obtain the PDF were performed at the 6IDD beamline at the Advanced Photon Source at Argonne National Laboratory. Diffraction data were collected using the recently developed rapid acquisition pair distribution function (RAPDF) technique Chupas et al. (2003) that benefits from 2D data collection. Unlike TEM, XRD probes a large number of crystallites that are randomly oriented. The powder samples were packed in a flat plate with thickness of 1.0 mm sealed between kapton tapes. Data were collected at room temperature with an x-ray energy of 87.005 keV ( Å). An image plate camera (Mar345) with a diameter of 345 mm was mounted orthogonally to the beam path with a sample to detector distance of 208.857 mm, as calibrated by using silicon standard sample. Chupas et al. (2003) The image plate was exposed for 10 seconds and this was repeated 5 times for a total data collection time of 50 seconds. The RAPDF approach avoids detector saturation whilst allowing sufficient statistics to be obtained. This approach also avoids sample degradation in the beam that was observed for the TOPO coated nanoparticles during longer exposures, on the scale of hours, that were required using conventional point-detector approaches. To reduce the background scattering, lead shielding was placed before the sample with a small opening for the incident beam.
Examples of the raw 2D data are shown in Fig. 3.
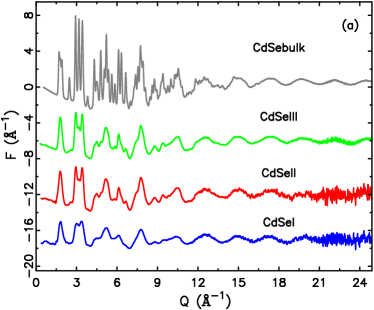
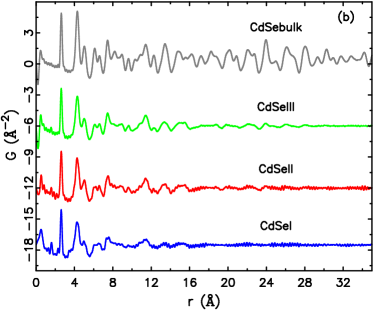
These data were integrated and converted to intensity versus 2 using the software Fit2D, Hammersley et al. (1996) where 2 is the angle between the incident and scattered x-ray beam. The integrated data were normalized by the average monitor counts. The data were corrected and normalized Egami and Billinge (2003) using the program PDFgetX2 Qiu et al. (2004) to obtain the total scattering structure function, , and the PDF, , which are shown in Figs. 4 (a) and (b) respectively.
The scattering signal from the surfactant (TOPO) was measured independently and subtracted as a background in the data reduction.
In the Fourier transform step to get from to the PDF , the data are truncated at a finite maximum value of the momentum transfer, . Different values of Qmax may be chosen. Here a Q Å-1 was found to be optimal. Qmax is optimized such as to avoid large termination effects and to reasonably minimize the introduced noise level as signal to noise ratio decreases with value.
Structural information was extracted from the PDFs using a full-profile real-space local-structure refinement method Billinge (1998) analogous to Rietveld refinement. Rietveld (1969) We used an updated version Farrow et al. (2007) of the program PDFfit Proffen and Billinge (1999) to fit the experimental PDFs. Starting from a given structure model and given a set of parameters to be refined, PDFfit searches for the best structure that is consistent with the experimental PDF data. The residual function () is used to quantify the agreement of the calculated PDF from model to experimental data:
| (3) |
Here the weight is set to unity which is justified because in the statistical uncertainty on each point is approximately equal. Toby and Billinge (2004); Toby and Egami (1992)
The structural parameters of the model were unit cell parameters, anisotropic atomic displacement parameters (ADPs) and the fractional coordinate z of Se/Cd atom. Non structural parameters that were refined were a correction for the finite instrumental resolution, (), low- correlated motion peak sharpening factor (), I.-K. Jeong et al. (1999); Jeong et al. (2003) and scale factor. When estimating the particle size, a new version of the fitting program with particle size effects included as a refinable parameter Farrow (2006) was used. The sample resolution broadening was determined from a refinement to the crystalline CdSe and the silicon standard sample and fixed and the particle diameter refined, as described below. Good agreement between these results was obtained.
III results and discussion
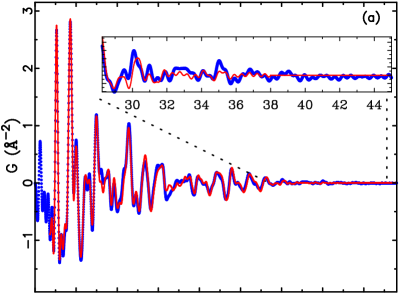
The reduced structure functions for the bulk and nanocrystalline samples are shown plotted over a wide range of in Fig 4(a). All of the patterns show significant intensity up to the highest values of , highlighting the value of measured data over such a wide -range. All of the diffraction patterns have peaks in similar positions reflecting the similarity of the basic structures, but as the nanoparticles get smaller the diffraction features become broadened out due to finite size effects. Guinier (1963)
The PDFs are shown in Fig. 4(b). What is apparent is that, in real-space, the PDF features at low- are comparably sharp in all the samples. The finite size effects do not broaden features in real-space. The finite particle size is evident in a fall-off in the intensity of structural features with increasing-. Later we will use this to extract the average particle size in the material. The structure apparent in the function comes from the atomic order within the nanoparticle. The value of where these ripples disappear indicates the particle core region diameter; or at least the diameter of any coherent structural core of the nanoparticle. By direct observation (Fig. 9) we can put a lower limit on the particle diameters to be 3.6, 2.8 and 1.6 nm for CdSeIII, II and I, respectively, where the ripples can be seen to die out by visual inspection. These numbers will be quantified more accurately later.
III.1 Nanoparticle structure
Features in the PDF at low- reflect the internal structure of the nanoparticles. The nanoparticle PDFs have almost the same features as in the bulk in the region below 8.0 Å, reflecting the fact that they share a similar atomic structure on average. In the finite nano-size regime, local structural deviations from the average bulk structure are expected.
A large number of semiconductor alloys, especially some sulfides and selenides, do not crystallize in the cubic zinc-blende structure but in the hexagonal wurtzite structure Kikuma and Furukoshi (1985). Both wurtzite and zinc-blende structures are based on the stacking of identical two-dimensional planar units translated with respect to each other, in which each atom is tetrahedrally coordinated with four nearest neighbors. The layer stacking is described as ABABAB… along the [001] axis for wurtzite and as ABCABC… along the [111] axis for zinc-blende.
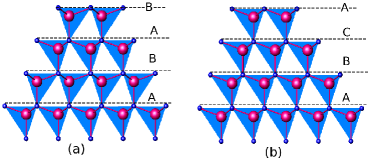
As can be seen in the Fig. 5, each cadmium and selenium is tetrahedrally coordinated in both structures. However, the next nearest and more distant coordination sequences are different in the two structures.
The largest changes in structure are expected in the smallest nanoparticles. In these small nanoparticles, the proportion of atoms on the surface is large making the notion of a well-ordered crystalline core moot. The fraction of atoms involved in the surface atoms was estimated as 0.6, 0.45 and 0.35 for 2 nm, 3 nm and 4 nm nanoparticle diameters, respectively. This was estimated by taking different spherical cuts from bulk structure, then counting the atom with coordination number 4 as core atom and the one with less than 4 as surface atom. For the smallest particles the small number of atoms in the core makes it difficult to define a core crystal structure, making the distinction between wurtzite and zinc-blende difficult using the conventional XRD methods as nanoparticle size decreases. Murray et al. (1993) The principle difference between these structures is the topology of the CdSe4 connections, which may also be becoming defective in the small nanoparticles.
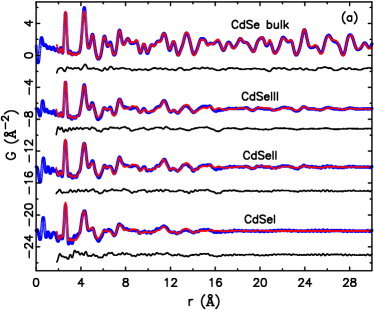
Two structure models wurtzite (space group ) and zinc-blende (space group ), were fit to the PDF data. The results of the full-profile fitting to the PDF data are shown Fig. 6. In this figure we compare fits to the (a) wurtzite and (b) zinc-blende structure models using isotropic atomic displacement factors (Uiso) in both models. The wurtzite structure gives superior fits for the bulk structure. However, for all the nanoparticle sizes, the fits of wurtzite and zinc-blende are comparable as evident from the difference curves in Fig. 6 and the Rw-values reported in Table 2. This indicates that classification of the CdSe nanoparticles structure as purely wurtzite or zinc-blend is misleading Murray et al. (1993) and it is better described as being intermediate between the two structures, as has been reported earlier Bawendi et al. (1989).

| CdSe-bulk | CdSeIII | CdSeII | CdSeI | |
|---|---|---|---|---|
| Wurtzite (Rw) | 0.16 | 0.31 | 0.28 | 0.31 |
| Zinc-blende (Rw) | 0.52 | 0.32 | 0.30 | 0.35 |
Introducing anisotropic ADPs (U11 = U22 U33) into the wurtzite model, resulted in better fits to the data. The refined parameters are reproduced in Table 3 and the fits are shown in Fig. 7(a). The values for the nanoparticles are rather close to the values in the bulk wurtzite structure. The model with anisotropic ADPs resulted in lower Rw. There is a general increase in the ADPs with decreasing particle size. This reflects inhomogeneous strain accommodation in the nanoparticles as we discuss below. However, the values of the ADPs along the -direction for Se atoms (U33) are four times larger in the nanoparticles compared with the bulk where they are already unphysically large. The fact that this parameter is large on the Se site and small on the Cd site is not significant, since we can change the origin of the unit cell to place a Cd ion at the (1/3,2/3,z) position and the enlarged U33 shifts to the Cd site in this case.
The unphysically large U33 value on the Se site is likely to be due to the presence of faults in the basal plane stacking. For example, similar unphysical enlargements of perpendicular thermal factors in PDF measurements are explained by the presence of turbostratic disorder in layered carbonsPetkov et al. (1999a), which is a similar effect to faults in the ABABAB wurtzite stacking. Also, the presence of stacking faults in the nanoparticles has been noted previously. Bawendi et al. (1989) It is noteworthy that this parameter is enlarged in EXAFS analyses of bulk wurtzite structures, probably for the same reason. Marcus et al. (1992, 1991); Rockenberger et al. (1998) We suspect that the enlargement in this parameter (U33) is related to the stacking fault density present in bulk and that is increasing in the nanoparticles.
To test this idea we simulated PDF data using the wurtzite structure containing different stacking fault densities. The stacking faults were simulated for different densities (0.167, 0.25, 0.333, and 0.5) by creating wurtzite superlattices with different stacking sequences along the -axis. The program DISCUS Proffen and Neder (1997) was used to create the stacking fault models and PDFgui Farrow et al. (2007) was used to generate the corresponding PDFs. The PDFs were simulated with all the ADPs fixed at U Å2, the value observed in the experimental bulk data collected at room temperature (see Table 3).
To see if this results in enlarged U33 values we refined the simulated data containing stacking faults using the wurtzite model without any stacking faults. Indeed, the refined Se site U33 increased monotonically with increasing stacking fault density. The results are plotted in Fig. 8.
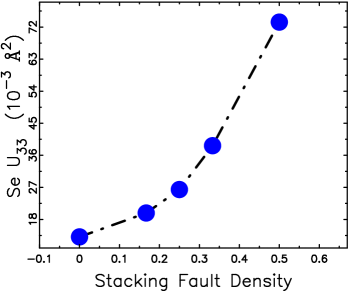
Fig. 8 can be considered as calibration curve of stacking fault density in the wurtzite structure, based on the enlargement in the ADPs along the -direction U33. From this we can estimate a stacking fault density of % for our bulk CdSe sample, and % for each of the nanoparticles.
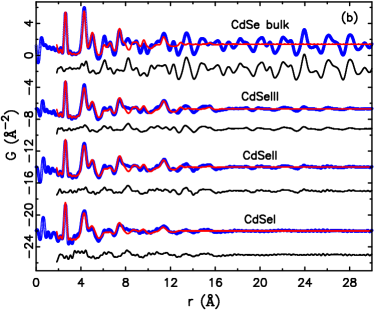
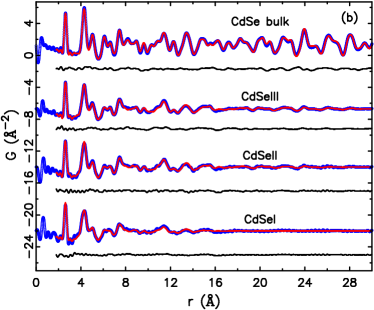
It is then possible to carry out a refinement using a structural model that contains an appropriate stacking fault density. The PDF data of bulk CdSe was therefore fit with a wurtzite model with a 33% density, and the nanoparticle PDF fit with a model with 50% of stacking faults. The refinements give excellent fits, as is evident in Fig. 7(b). The results are presented in Table 3. The enlarged U33 parameter on the Se site is no longer present and it is now possible to refine physically reasonable values for that parameter. As well as resulting in physically reasonable ADPs, the quality of the fits to the data are excellent, though the value is slightly larger in the nanoparticles.
| CdSe-bulk CdSeIII CdSeII CdSeI | ||||||||
|---|---|---|---|---|---|---|---|---|
| Stacking fault density (%) | 0.0 | 33.0 | 0.0 | 50.0 | 0.0 | 50.0 | 0.0 | 50.0 |
| a (Å) | 4.3014(4) | 4.3012(4) | 4.2997(9) | 4.2987(9) | 4.3028(9) | 4.3015(9) | 4.2930(9) | 4.2930(8) |
| c (Å) | 7.0146(9) | 7.0123(9) | 7.0145(4) | 7.0123(4) | 6.9987(9) | 6.9975(9) | 6.9405(9) | 6.9405(7) |
| Se Z-frac. | 0.3774(3) | 0.3771(3) | 0.3761(9) | 0.3759(9) | 0.3751(6) | 0.3747(6) | 0.3685(9) | 0.3694(9) |
| Cd U11 = U22 (Å2) | 0.0108(2) | 0.0102(2) | 0.0146(7) | 0.0149(7) | 0.0149(6) | 0.0112(5) | 0.0237(9) | 0.0213(8) |
| U33 (Å2) | 0.0113(3) | 0.0112(3) | 0.0262(9) | 0.0241(9) | 0.0274(9) | 0.0271(9) | 0.0261(9) | 0.0281(9) |
| Se U11 = U22 (Å2) | 0.0109(9) | 0.0102(9) | 0.0077(7) | 0.0138(7) | 0.0083(7) | 0.0121(7) | 0.0110(9) | 0.0191(9) |
| U33 (Å2) | 0.0462(9) | 0.0115(9) | 0.1501(9) | 0.02301(9) | 0.1628(9) | 0.0265(9) | 0.1765(9) | 0.0311(9) |
| NP111NP refers to nanoparticle. diameter (nm) | 3.7(1) | 3.7(1) | 3.1(1) | 3.1(1) | 2.4(2) | 2.2(2) | ||
| Rw | 0.12 | 0.09 | 0.20 | 0.14 | 0.18 | 0.15 | 0.27 | 0.21 |
Attempts to characterize the structure changes using direct measurements such as TEM technique for such small CdSe nanoparticles Landes et al. (2001) were unsuccessful due to the poor contrast. However, in the present study we were successful in exploring the local atomic structure for CdSe nanoparticles, in real space, at different length scales. The PDF fits clearly indicate that the structure can be described in terms of locally distorted wurtzite structure containing % stacking fault density (i.e., intermediate between wurtzite and zinc-blende) even for the 2 nm diameter particles, Fig. 7.
Interestingly, there is little evidence in our data for a significant surface modified region. This surface region is sometimes thought of as being an amorphous-like region. Amorphous structures appear in the PDF with sharp first neighbor peaks but rapidly diminishing and broadening higher neighbor peaks. Thus, in the presence of a surface amorphous region, we might expect to see extra intensity at the first-peak position when the wurtzite model is scaled to fit the higher- features coming just from the crystalline core. As evident in Fig. 7, this is not observed. Furthermore, as we describe below, the diameter of the crystalline core that we refine from the PDF agrees well with other estimates of nanoparticle size, suggesting that there is no surface amorphous region in these nanoparticles. The good agreement in the intensity of the first PDF peak also presents a puzzle in the opposite direction since we might expect surface atoms to be under-coordinated, which would result in a decrease in the intensity of this peak. It is possible that the competing effects of surface amorphous behavior and surface under coordination perfectly balance each other out, and this cannot be ruled out, though it seems unlikely that it would work perfectly at all nanoparticle diameters. This is also not supported by the nanoparticle size determinations described below.
III.2 Nanoparticle size
We describe here how we extracted more accurate nanoparticle diameters. This determination is important since the physical proprieties are size dependent. It is also important to use complementary techniques to determine particle size as different techniques are more dependent on different aspects of the nanoparticle structure, for example, whether or not the technique is sensitive to any amorphous surface layer on the nanoparticle. More challenges are expected in accurate size determination as nanoparticle diameter decreases, due to poor contrast near the surface of the nanoparticle.
In the literature, CdSe nanoparticles with a diameter of 2.0 nm have been considered to be an especially stable size with an associated band edge absorption centered at 414 nm Chen et al. (2005), that size was observed earlier Murray et al. (1993); Qu et al. (2001) with an estimated diameter of 2.0 nm. There are some reported difficulties in determining the diameter of such small CdSe nanoparticles. Attempts to characterize the structure changes by TEM and X-ray diffraction techniques Landes et al. (2001) were unsuccessful due to the small diameter of the particles relative to the capping material.
If we assume the nanoparticle to have spherical shape (a reasonable approximation based on the TEM in Fig. 1) cut from the bulk, then the measured PDF will look like the PDF of the bulk material that has been attenuated by an envelope function given by the PDF of a homogeneous sphere, as follows Kodama et al. (2006)
| (4) |
where is given in Eq. 1, and is a sphere envelope function given by
| (5) |
where is the diameter of the homogeneous sphere, and is the Heaviside step function, which is equal to 0 for negative and 1 for positive.
The approach is as follows. First we refine the bulk CdSe data using PDFfit. This gives us a measure of the PDF intensity fall-off due to the finite resolution of the measurement. Egami and Billinge (2003) Then the measured value of the finite resolution was kept as an unrefined parameter after that, while all the other structural and non structural parameters were refined. To measure the PDF intensity fall-off due to the finite particle size, the refined PDF is attenuated, during the refinement, by the envelope function (Eq. 5) which has one refined parameter, the particle diameter. The fit results are shown in Fig. 9 and the resulting values of particle diameter from the PDF refinement are recorded in Table 1.
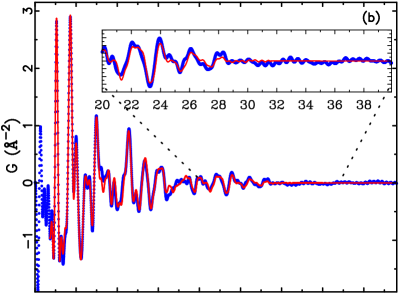
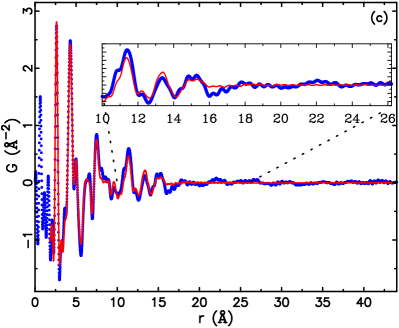
The insets show the calculated and measured PDFs on an expanded scale. The accuracy of determining the nanoparticle size can be evaluated directly from this figure. Features in the measured PDFs that correspond to the wurtzite structure are clearly seen disappearing smoothly attenuated by the spherical PDF envelope function. The procedure is least successful in the smallest nanoparticles, where the spherical particle approximation on the model results in features that extend beyond those in the data. In this case, the spherical approximation may not be working so well.
The particle diameters determined from the PDF are consistent with those obtained from TEM, UV-vis and photoluminescence measurements. In particular, an accurate determination of the average diameter of the smallest particles is possible in the region where UV-vis and photoluminescence measurements lose their sensitivity. Nanda et al. (2000) In this analysis we have not considered particle size distributions, which are small in these materials. The good agreement between the data and the fits justify this, though some of the differences at high- may result from this and could contribute an error to the particle size. Several additional fits to the data were performed to test the sphericity of the nanoparticles. Attempts were made to fit the PDF with oblate and prolate spheroid nanoparticle form factors. These fits resulted in ellipticities very close to one, and large uncertainties in the refined ellipticity and particle diameters, which suggests that the fits are over-parameterized. Another series of fits attempted to profile the PDF with a lognormal distribution of spherical nanoparticles. Allowing the mean nanoparticle diameter and lognormal width to vary resulted in nonconvergent fits, which implies that the particle sizes are not lognormal distributed. Therefore, there appears to be little evidence for significant ellipticity, nor a significant particle size distribution, as fits assuming undistributed spherical particles give the best results.
The simple fitting of a wurtzite structure with % SFD to the data will result in an estimate of the coherent structural core of the nanoparticle that has a structure can be described by a mixture of crystalline structures intermediate between zinc-blend and wurtzite. Comparing the nanoparticle core diameter extracted from PDF analysis with the diameter determined from the standard characterization methods yields information about the existence of a surface amorphous region. The agreement between the core diameter extracted from PDF and that determined from the standard methods (Table 1), indicates that within our measurement uncertainties, there is no significant heavily disordered surface region in these nanoparticles, even at the smallest diameter of 2 nm (Fig. 9). In contrast with ZnS nanoparticles Gilbert et al. (2004) where the heavily disordered surface region is about 40% of the nanoparticle diameter for a diameter of 3.4 nm, the surface region thickness being around 1.4 nm. Gilbert et al. (2004)
III.3 Internal strain
The local bonding of the tetrahedral Cd-Se building unit was investigated vs nanoparticle diameter. The nearest neighbor peaks at Å come from covalently bonded Cd-Se pairs. The positions and the width of these peaks have been determined by fitting a Gaussian (Fig. 10(a))
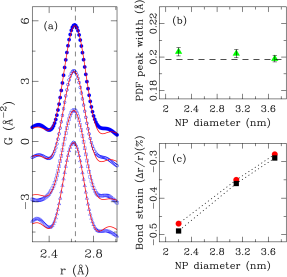
and the results presented in Table 4. The results indicate that there is a significant compressive strain on this near-neighbor bond length, and it is possible to measure it with the PDF with high accuracy. The bond length of Cd-Se pairs shorten as nanoparticle diameter decreases, suggesting the presence of an internal stress in the nanoparticles. The Cd-Se bond lengths extracted from the PDF structural refinement are also in good agreement with those obtained from the first peak Gaussian fit, as shown in Fig. 10(c). Thus we have a model independent and a model dependent estimate of the strain that are in quantitative agreement.
| CdSe-bulk | CdSeIII | CdSeII | CdSeI | |
|---|---|---|---|---|
| PDF FPP (Å) | 2.6353(3) | 2.6281(3) | 2.6262(3) | 2.6233(3) |
| PDF FPW (Å) | 0.1985(09) | 0.1990(19) | 0.2021(25) | 0.2032(25) |
The widths of the first PDF peaks have also been extracted vs nanoparticle diameter from the Gaussian fits (Table 4). They remain comparably sharp as the nanoparticles get smaller, as shown in Fig. 10(b). Apparently there is no size-dependent inhomogeneous strain measurable on the first peak. However, peaks at higher- do indicate significant broadening (Fig. 4(b)) suggesting that there is some relaxation taking place through bond-bending. This is reflected in enlarged thermal factors that are refined in the nanoparticle samples. This is similar to what is observed in semiconductor alloys where most of the structural relaxation takes place in relatively lower energy bond-bending distortions. Petkov et al. (1999b); I.-K. Jeong et al. (2001)
IV conclusion
The PDF is used to address the size and structural characterization of a series of CdSe nanoparticles prepared by the method mentioned in the text. The core structure of the measured CdSe nanoparticles was found to possess a well-defined atomic arrangement that can be described in terms of locally disordered wurtzite structure that contains % stacking fault densit, and quantitative structural parameters are presented.
The diameter of the CdSe nanoparticles was extracted from the PDF data and is in good agreement with the diameter obtained from standard characterization methods, indicating that within our measurement uncertainties, there is no significant heavily disordered surface region in these nanoparticles, even at the smallest diameter of 2 nm . In contrast with ZnS nanoparticles Gilbert et al. (2004) where the heavily disordered surface region is about 40% of the nanoparticle diameter for a diameter of 3.4 nm, the surface region thickness being around 1.4 nm. Gilbert et al. (2004)
Compared with the bulk PDF, the nanoparticle PDF peaks are broader in the high- region due to strain and structural defects in the nanoparticles. The nearest neighbor peaks at Å which come from covalently bonded Cd-Se pairs, shorten as nanoparticle diameter decreases resulting in a size-dependent strain on the Cd-Se bond that reaches 0.5% at the smallest particle size.
Acknowledgements.
We would like to acknowledge help from Didier Wermeille, Doug Robinson, Mouath Shatnawi, Moneeb Shatnawi and He Lin for help in collecting data. We are grateful to Christos Malliakas for the valuable assistance with the transmission electron microscopy. May thanks to HyunJeong Kim for useful discussion. We are grateful to Prof. Reinhard Neder for the valuable help with the stacking fault simulation. This work was supported in part by National Science Foundation (NSF) grant DMR-0304391. Data were collected at the 6IDD beamline of the MUCAT sector at the Advanced Photon Source (APS). Use of the APS is supported by the U.S. DOE, Office of Science, Office of Basic Energy Sciences, under Contract No. W-31-109-Eng-38. The MUCAT sector at the APS is supported by the U.S. DOE, Office of Science, Office of Basic Energy Sciences, through the Ames Laboratory under Contract No. W-7405-Eng-82.References
- Hodes et al. (1987) G. Hodes, A. Albu-Yaron, F. Decker, and P. Motisuke, Phys. Rev. B 36, 4215 (1987).
- Tolbert and Alivisatos (1994) S. H. Tolbert and P. A. Alivisatos, Science 265, 373 (1994).
- Murray et al. (1995) C. B. Murray, C. R. Kagan, and M. G. Bawendi, Science 270, 1335 (1995).
- Colvin et al. (1994) V. L. Colvin, M. C. Schlamp, and A. P. Alivisatos, Nature 370, 354 (1994).
- Tran et al. (2002) P. T. Tran, E. R. Goldman, G. P. Anderson, J. M. Mauro, and H. Mattoussi, Phys. Status Solidi 229, 427 (2002).
- Bruchez et al. (1998) M. Bruchez, M. Moronne, P. Gin, S. Weiss, and A. P. Alivisatos, Science 281, 2013 (1998).
- Li and Alivisatos (2003) L. S. Li and A. P. Alivisatos, Phys. Rev. Lett. 90, 097402 (2003).
- Bawendi et al. (1989) M. G. Bawendi, A. R. Kortan, M. L. Steigerwald, and L. E. Brus, J. Chem. Phys. 91, 7282 (1989).
- Egami and Billinge (2003) T. Egami and S. J. L. Billinge, Underneath the Bragg peaks: structural analysis of complex materials (Pergamon Press, Elsevier, Oxford, England, 2003).
- Billinge and Kanatzidis (2004) S. J. L. Billinge and M. G. Kanatzidis, Chem. Commun. 2004, 749 (2004).
- Gilbert et al. (2004) B. Gilbert, F. Huang, H. Zhang, G. A. Waychunas, and J. F. Banfield, Science 305, 651 (2004).
- Neder and Korsunskiy (2005) R. B. Neder and V. I. Korsunskiy, J. Phys: Condens. Matter 17, S125 (2005).
- Howell et al. (2006) R. C. Howell, T. Proffen, and S. D. Conradson, Phys. Rev. B 73, 094107 (2006).
- Page et al. (2004) K. Page, T. Proffen, H. Terrones, M. Terrones, L. Lee, Y. Yang, S. Stemmer, R. Seshadri, and A. K. Cheetham, Chem. Phys. Lett. 393, 385 (2004).
- Petkov et al. (2005a) V. Petkov, M. Gateshki, J. Choi, E. G. Gillan, and Y. Ren, J. Mater. Chem. 15, 4654 (2005a).
- Gateshki et al. (2005) M. Gateshki, V. Petkov, G. Williams, S. K. Pradhan, and Y. Ren, Phys. Rev. B 71, 224107 (2005).
- Chupas et al. (2003) P. J. Chupas, X. Qiu, J. C. Hanson, P. L. Lee, C. P. Grey, and S. J. L. Billinge, J. Appl. Crystallogr. 36, 1342 (2003).
- Proffen et al. (2002) T. Proffen, T. Egami, S. J. L. Billinge, A. K. Cheetham, D. Louca, and J. B. Parise, Appl. Phys. A 74, s163 (2002).
- Proffen and Billinge (1999) T. Proffen and S. J. L. Billinge, J. Appl. Crystallogr. 32, 572 (1999).
- Tucker et al. (2001) M. G. Tucker, M. P. Squires, M. T. Dove, and D. A. Keen, J. Phys: Condens. Matter 13, 403 (2001).
- Kumpf et al. (2005) C. Kumpf, R. B. Neder, F. Niederdraenk, P. Luczak, A. Stahl, M. Scheuermann, S. Josh i, S. K. Kulkarni, C. Barglik-Chory, C. Heske, et al., J. Chem. Phys. 123, 224707 (2005).
- Wickham et al. (2000) J. N. Wickham, A. B. Herhold, and A. P. Alivisatos, Phys. Rev. Lett. 84, 4515 (2000).
- Nanda et al. (2000) J. Nanda, S. Sapra, D. D. Sarma, N. Chandrasekharan, and G. Hodes, Chem. Mater. 12, 1018 (2000).
- Palosz et al. (2002) B. Palosz, E. Grzanka, S. Gierlotka, S. Stel’Makh, R. Pielaszek, U. Bismayer, J. Neuefeind, H. P. Weber, and W. Palosz, Acta Phys. Pol. A 102, 57 (2002).
- Borchert et al. (2005) H. Borchert, E. V. Shevchenko, A. Robert, I. Mekis, A. Kornowski, G. Grubel, and H. Weller, Langmuir 21, 1931 (2005).
- Guinier (1963) A. Guinier, X-ray diffraction in crystals, imperfect crystals, and amorphous bodies. (San Francisco, W.H. Freeman, San Francisco, 1963).
- Debye (1915) P. Debye, Annalen der Physik (Berlin, Germany) 46, 809 (1915).
- Kaszkur (2006) Z. Kaszkur, Z. Kristallogr. Suppl. 23, 147 (2006).
- Murray et al. (1993) C. B. Murray, D. J. Norris, and M. G. Bawendi, J. Am. Chem. Soc. 115, 8706 (1993).
- Chen et al. (2006) C. Q. Chen, Y. Shi, Y. S. Zhang, J. Zhu, and Y. J. Yan, Phys. Rev. Lett. 96, 075505 (2006).
- Ouyang et al. (2006) G. Ouyang, X. L. Li, X. Tan, and G. W. Yang, Appl. Phys. Lett. 89, 031904 (2006).
- Marcus et al. (1992) M. A. Marcus, L. E. Brus, C. Murray, M. G. Bawendi, A. Prasad, and A. P. Alivisatos, Nanostruct. Mater. 1, 323 (1992).
- Herron et al. (1993) N. Herron, J. C. Calabrese, W. E. Farneth, and Y. Wang, Science 259, 1426 (1993).
- Carter et al. (1997) A. C. Carter, C. E. Bouldin, K. M. Kemner, M. I. Bell, J. C. Woicik, and S. A. Majetich, Phys. Rev. B 55, 13822 (1997).
- Chaure et al. (2005) S. Chaure, N. B. Chaure, and R. K. Pandey, Physica E 28, 439 (2005).
- Peng et al. (1998) X. G. Peng, J. Wickham, and A. P. Alivisatos, J. Am. Chem. Soc. 120, 5343 (1998).
- Petkov et al. (2000) V. Petkov, S. J. L. Billinge, J. Heising, and M. G. Kanatzidis, J. Am. Chem. Soc. 122, 11571 (2000).
- Petkov et al. (2002) V. Petkov, P. N. Trikalitis, E. S. Božin, S. J. L. Billinge, T. Vogt, and M. G. Kanatzidis, J. Am. Chem. Soc. 124, 10157 (2002).
- Petkov et al. (2004) V. Petkov, P. Y. Zavalij, S. Lutta, M. S. Wittingham, V. Parvanov, and S. Shastri, Phys. Rev. B 69, 085410 (2004).
- Juhas et al. (2006) P. Juhas, D. M. Cherba, P. M. Duxbury, W. F. Punch, and S. J. L. Billinge, Nature 440, 655 (2006).
- Zhang et al. (2003) H. Z. Zhang, B. Gilbert, F. Huang, and J. F. Banfield, Nature 424, 1025 (2003).
- Petkov et al. (2005b) V. Petkov, Y. Peng, G. Williams, B. Huang, D. Tomalia, and Y. Ren, Phys. Rev. B 72, 195402 (2005b).
- Warren (1990) B. E. Warren, X-ray diffraction (Dover, New York, 1990).
- Hammersley et al. (1996) A. P. Hammersley, S. O. Svenson, M. Hanfland, and D. Hauserman, High Pressure Res. 14, 235 (1996).
- Qiu et al. (2004) X. Qiu, J. W. Thompson, and S. J. L. Billinge, J. Appl. Crystallogr. 37, 678 (2004).
- Billinge (1998) S. J. L. Billinge, in Local Structure from Diffraction, edited by S. J. L. Billinge and M. F. Thorpe (Plenum, New York, 1998), p. 137.
- Rietveld (1969) H. M. Rietveld, J. Appl. Crystallogr. 2, 65 (1969).
- Farrow et al. (2007) C. L. Farrow, P. Juhas, J. W. Liu, D. Bryndin, E. S. Božin, J. Bloch, T. Proffen, and S. J. L. Billinge, J. Phys: Condens. Matter 19, 335219 (2007).
- Toby and Billinge (2004) B. H. Toby and S. J. L. Billinge, Acta Crystallogr. A 60, 315 (2004).
- Toby and Egami (1992) B. H. Toby and T. Egami, Acta Crystallogr. A 48, 336 (1992).
- I.-K. Jeong et al. (1999) I.-K. Jeong, T. Proffen, F. Mohiuddin-Jacobs, and S. J. L. Billinge, J. Phys. Chem. A 103, 921 (1999).
- Jeong et al. (2003) I. K. Jeong, R. H. Heffner, M. J. Graf, and S. J. L. Billinge, Phys. Rev. B 67, 104301 (2003).
- Farrow (2006) C. Farrow (2006), unpublished.
- Kikuma and Furukoshi (1985) I. Kikuma and M. Furukoshi, J. Cryst. Growth. 71, 136 (1985).
- Petkov et al. (1999a) V. Petkov, R. G. DiFrancesco, S. J. L. Billinge, M. Acharya, and H. C. Foley, Philos. Mag. B 79, 1519 (1999a).
- Marcus et al. (1991) M. A. Marcus, W. Flood, M. Stiegerwald, L. Brus, and M. Bawendi, J. Phys. Chem. 95, 1572 (1991).
- Rockenberger et al. (1998) J. Rockenberger, L. Troger, A. L. Rogach, M. Tischer, M. Grundmann, H. Weller, and A. Eychmuller, Phys. Chem. Chem. Phys. 102, 1561 (1998).
- Proffen and Neder (1997) Th. Proffen and R. B. Neder, J. Appl. Crystallogr. 30, 171 (1997).
- Landes et al. (2001) C. Landes, M. Braun, C. Burda, and M. El-Sayed, Nano Lett. 1, 667 (2001).
- Chen et al. (2005) X. B. Chen, A. C. Samia, Y. B. Lou, and C. Burda, J. Am. Chem. Soc. 127, 4372 (2005).
- Qu et al. (2001) L. Qu, Z. Peng, and X. Peng, Nano Lett. 1, 333 (2001).
- Kodama et al. (2006) K. Kodama, S. Iikubo, T. Taguchi, and S. Shamoto, Acta Crystallogr. A 62, 444 (2006).
- Petkov et al. (1999b) V. Petkov, I-K. Jeong, J. S. Chung, M. F. Thorpe, S. Kycia, and S. J. L. Billinge, Phys. Rev. Lett. 83, 4089 (1999b).
- I.-K. Jeong et al. (2001) I.-K. Jeong, F. Mohiuddin-Jacobs, V. Petkov, S. J. L. Billinge, and S. Kycia, Phys. Rev. B 63, 205202 (2001).