Colour Pairs for Constraining the Age and Metallicity of Stellar Populations ††thanks: The data are available at the CDS or on request to the authors.
Abstract
Using a widely used stellar population synthesis model, we study the ability of using pairs of AB system colours to break the well-known stellar age–metallicity degeneracy and give constraints on two luminosity-weighted stellar-population parameters (age and metallicity). The relative age and metallicity sensitivities of AB system colours that relate to , , , , , , , , , , , and bands are presented, and the abilities of various colour pairs for breaking the age–metallicity degeneracy are quantified. Our results suggest that a few pairs of colours can be used to constrain the two above stellar-population parameters. This will be very useful for exploring the stellar populations of distant galaxies. In detail, colour pairs [] and [] are shown to be the best pairs for estimating the luminosity-weighted stellar ages and metallicities of galaxies. They can constrain two stellar-population parameters on average with age uncertainties less than 3.89 Gyr and metallicity uncertainties less than 0.34 dex for typical colour uncertainties. The typical age uncertainties for young (Age 4.6 Gyr) populations and metal-rich ( 0.001) populations are small (about 2.26 Gyr) while those for old populations (Age 4.6 Gyr) and metal-poor ( 0.001) populations are much larger (about 6.88 Gyr). However, the metallicity uncertainties for metal-poor populations (about 0.0024) are much smaller than for other populations (about 0.015). Some other colour pairs can possibly be used for constraining the two parameters, too.
As a whole, the estimation of stellar-population parameters is likely to reliable only for early-type galaxies with small colour errors and globular clusters, because such objects contain less dust. In fact, no galaxy is totally dust-free and early-type galaxies are also likely have some dust, e.g., E(B-V) 0.05, which can change the stellar ages about 2.5 Gyr and metallicities () about 0.015. When we compare the photometric estimates with previous spectroscopic estimates, we are shown some differences, especially when comparing the stellar ages determined by two methods. The differences mainly result from the young populations of galaxies. Therefore, it is difficult to get the absolute values of stellar ages and metallicities, but the results are useful for getting some relative values.
In addition, our results suggest that colours relating to both and magnitudes are much better than either colours or colours for breaking the well-known degeneracy. The results also show that the stellar ages and metallicities of galaxies observed by the Sloan Digital Sky Survey (SDSS) and the Two-Micron All-Sky Survey (2MASS) can be estimated via photometry data.
keywords:
galaxies: stellar content — galaxies: photometry — galaxies: elliptical and lenticular, cD.1 Introduction
The formation and evolution of galaxies is one of the hottest topics in astronomy and astrophysics. Great progress in the field has been had (see, e.g., Thomsen & Baum 1989, Kormendy & Djorgovski 1989, Kodama et al. 1998, van Dokkum & Stanford 2003, Kauffmann & Charlot 1998, Baugh et al. 1996, Baugh et al. 1998, Cole et al. 2000, De Lucia et al. 2006, and Thomas 1999), and two luminosity-weighted stellar-population parameters (age and metallicity) of galaxies are crucial. A lot of stellar population synthesis models such as Bruzual & Charlot (2003)(hereafter BC03), Worthey (1994), Vazdekis (1999) , Fioc & Rocca-Volmerange (1997), and Zhang et al. (2005) have been brought forward for stellar population studies and a great deal of observational data have been supplied by big surveys such as the Sloan Digital Sky Survey (SDSS) and the Two-Micron All-Sky Survey (2MASS). However, it is difficult to measure the stellar ages and metallicities of some distant galaxies (e.g., galaxies with redshifts greater than 0.3) via the spectra-like methods. The reason is that reliable spectra or line-strength indices (see, e.g., Worthey 1994, Gallazzi et al. 2005, Li et al. 2006) are usually available for some nearby galaxies. If we can use one of important observational results, i.e., photometry, we will be able to explore the stellar populations of some distant galaxies. Because colours are easier to be obtained than spectra and are independent of the distances of objects, they are good candidates for studying the stellar populations of such galaxies. Many works have been tried in this way, e.g., Dorman et al. (2003), Yi (2003), Wu et al. (2005), James et al. (2006), Li et al. (2007); Li & Han (2007), and Kaviraj et al. (2006). It seems possible to break the stellar age–metallicity degeneracy (Worthey, 1994) by colours. Many pairs of colours (hereafter colour pairs) are used in previous works, e.g., and by Peletier & Balcells (1996), and by Bell & de Jong (2000), and by Puzia et al. (2002), and by James et al. (2006), and by Li et al. (2007), and by Lee et al. (2007), and most colours used are only in bands. As advocated by, e.g., Kong et al. (2006), colours relating to both and bands, i.e., and , can be used to select galaxies with various redshifts. Similar colours can possibly be used to break the stellar age–metallicity degeneracy. We intend to give some investigations in this work, using the BC03 stellar population synthesis model.
The paper is organized as follows. In Sect. 2, we briefly introduce the BC03 model and the calculation of colours. In Sect. 3, we present the age and metallicity sensitivities of colours. In Sect. 4, we try to search for colour pairs that can be used to constrain stellar age and metallicity. In Sect. 5, we give our discussions and conclusions.
2 The BC03 model and calculation of colours
The BC03 model is a widely used model in stellar population synthesis study. Its standard model takes the Chabrier (2003) initial mass function (IMF) and uses Padova 1994 library tracks to calculate integrated colours. A few alternative stellar spectral libraries are considered to give the spectral predictions of simple stellar populations (SSPs). The model provides us magnitudes and colours on both Johnson-Cousins-Glass ( bands) and AB ( bands) systems. More detailed information about the model please refer to Bruzual & Charlot (2003). In this work, magnitudes on AB system are recalculated from those given on Johnson-Cousins-Glass system, by taking -0.1, 0.0, 0.2, 0.45, 0.9, 1.4, and 1.9 as the differences between the zero points of AB system and Johnson-Cousins-Glass system magnitudes, in , , , , , and bands, respectively 111 http://www.astro.livjm.ac.uk/∼ikb/convert-units/node1.html.
3 age and metallicity sensitivities of colours
We study the age and metallicity sensitivities by a relative metallicity sensitivity () technique, which was used by Worthey (1994) and Li et al. (2007), and find age- and metallicity-sensitive colours based on the of colours. The method estimates the of each colour by the ratio of percentage change of age to that of metallicity when they lead to the same change in a colour respectively. Colours with large (1.0) are more sensitive to metallicity and those with small (1.0) to stellar age. Following Li et al. (2007), we calculated the of each colour in this work.
The of 66 AB system colours are calculated in the work. The detailed data are listed in Table 1. As we see, , , , , , , , , , and are more sensitive to stellar metallicity while , , , , , , , , , and to stellar age. We select the former ten colours as age-sensitive colours while the latter ten as metallicity-sensitive colours.
| colour | colour | colour | |||
|---|---|---|---|---|---|
| 2.0294 | 0.8218 | 0.5758 | |||
| 1.8610 | 0.8094 | 0.5654 | |||
| 1.6904 | 0.7863 | 0.5400 | |||
| 1.6125 | 0.7554 | 0.5178 | |||
| 1.5774 | 0.7335 | 0.5105 | |||
| 1.4114 | 0.7237 | 0.5074 | |||
| 1.4031 | 0.7027 | 0.5012 | |||
| 1.2654 | 0.6952 | 0.4834 | |||
| 1.2160 | 0.6896 | 0.4707 | |||
| 1.1094 | 0.6877 | 0.4675 | |||
| 1.0914 | 0.6725 | 0.4440 | |||
| 1.0474 | 0.6722 | 0.4180 | |||
| 1.0455 | 0.6675 | 0.4116 | |||
| 1.0145 | 0.6632 | 0.4000 | |||
| 1.0069 | 0.6534 | 0.3984 | |||
| 0.9985 | 0.6404 | 0.3908 | |||
| 0.9805 | 0.6382 | 0.3887 | |||
| 0.9719 | 0.6320 | 0.3835 | |||
| 0.9247 | 0.6151 | 0.3637 | |||
| 0.8788 | 0.5909 | 0.3344 | |||
| 0.8719 | 0.5867 | 0.2262 | |||
| 0.8414 | 0.5856 | 0.1670 |
4 colour pairs for breaking the age–metallicity degeneracy
4.1 Colour pairs for general studies
Using the 10 metallicity-sensitive colours and the 10 age-sensitive colours presented in the last paragraph of Sect. 3, we buildup 100 colour pairs. Each colour pair includes a metallicity-sensitive colour and an age-sensitive colour. Using the colour pairs one by one, we fit the stellar ages and metallicities of 500 testing stellar populations. To make the results useful for estimating the parameters of all kinds of stellar populations, the ages and metallicities of the testing populations are generated randomly within the ranges of 0.1–15 Gyr and 0.0001–0.05, respectively. The averages of uncertainties in age and metallicity, and , are then calculated by taking typical uncertainties for input colours. The typical uncertainties for , , , , , , , , , , , , and magnitudes are taken as 0.109, 0.116, 0.059, 0.03, 0.07, 0.08, 0.09, 0.126, 0.11, 0.01, 0.007, 0.007 and 0.012 mag, respectively. These values are estimated using the data supplied by the NASA/IPAC Extragalactic Database (NED), the 2MASS and SDSS surveys. Then we investigate the ability of each colour pair for breaking the well-known stellar age–metallicity degeneracy by comparing the and . A least-square method is used to fit the ages and metallicities of stellar populations in the work. The uncertainties in stellar-population parameters are estimated by taking the maximum uncertainties in the two parameters when considering the uncertainties of colours. One can refer to Denicoló et al. (2005) or Li et al. (2006) for more details. The main results are listed in Table 2.
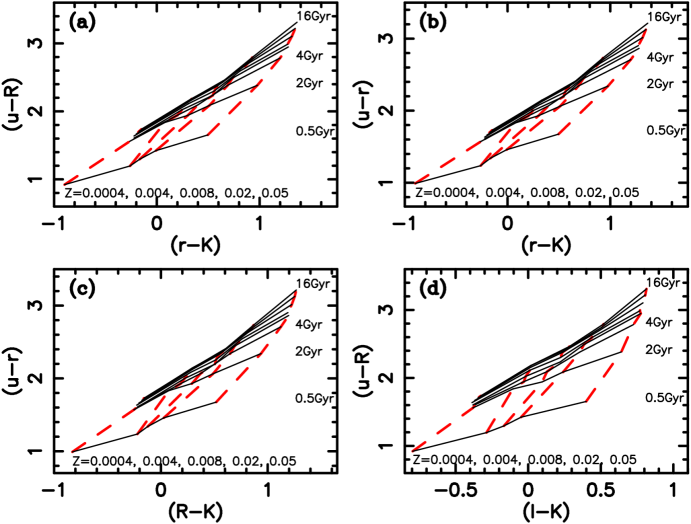
Because colour pairs that can well break the stellar age–metallicity degeneracy lead to small uncertainties in stellar age and metallicity, pairs with small and are better for constraining two stellar-population parameters. However, as we see, some colour pairs have only small or small . In this case, it is difficult to compare the abilities of various colour pairs. We defined a parameter, uncertainty parameter (), to solve this problem. The is calculated by taking the average of the relative uncertainties of stellar ages and metallicities of the 500 testing stellar populations. According to the calculation of , colour pairs with small s are more suitable for breaking the stellar age–metallicity degeneracy. The s of colours are shown in Table 2, together with s and s. Considering actual applications, we only list the results of colour pairs that have s smaller than 2.0 when taking typical uncertainties for colours. In the table, colours are sorted by an increasing order of . Note that we also list the average metallicity uncertainty in dex. As we see, [] and [] are the best colour pairs for breaking the well-known degeneracy. Given typical uncertainties for colours, the two colour pairs can constrain stellar-population parameters with relative uncertainties smaller than about 96%, which corresponds to average uncertainties in stellar age and metallicity smaller than 3.89 Gyr and 0.34 dex, respectively. Some other pairs, i.e., [], [], [] and [] can possibly be used to give constraints on the stellar ages and metallicities of galaxies as they have small s ( 1.13) for typical uncertainties of colours. In addition, colour pairs relating to both bands and bands are shown to be much better than those only relating to one of the two kinds of bands. To see the abilities of colour pairs for breaking the age–metallicity degeneracy, we show the colour–colour grids of four pairs in Fig. 1.
However, as we note from Table 2, the uncertainties in two stellar-population parameters are very big. This results from the large observational uncertainties. Because the observational uncertainties depend on surveys and they will possibly be decreased in future surveys, we tried to find the best pairs for various uncertainties (0.02, 0.05 and 0.10) in colours. We assumed that all colours have the same uncertainty in each test. The results are shown in Table 2. As we see, if the uncertainties of colours are less than 0.05 mag, the stellar ages and metallicities of galaxies can be constrained with uncertainty less than 1 Gyr and 0.0076, respectively, via and .
4.2 Colour pairs for special studies
Because we often need to estimate the ages and metallicities of some special stellar populations, e.g., the old populations of globular clusters, we tried to find some colour pairs that are suitable for estimating the two luminosity-weighted stellar-population parameters of such populations. In detail, the best colour pairs for estimating the stellar ages and metallicities of young ( 4.6 Gyr), old ( 4.6 Gyr), metal poor ( 0.001), and metal rich ( 0.001) stellar populations are found by taking the above typical uncertainties of colours. The best ten colour pairs for studying each kind of special population are listed in Table 3. As we see, some colour pairs for studying different kinds of stellar populations are various. However, [] can be used to constrain the age and metallicity of all kinds of stellar populations. We can also find that when colour pair [] is used to study the stellar-population parameters of various populations, the uncertainties of results are different. The age uncertainties of old or metal-poor populations are usually larger than those of young or metal-rich populations.
4.3 Composite colour pairs
In practice, we can also use colour pairs including magnitudes on different systems, as colours relating to the same bands but on different systems usually have similar properties for breaking the well-known stellar age–metallicity degeneracy (Worthey, 1994). For example, we can use colour pair [], in which magnitudes are on AB-system and magnitude on 2MASS system instead of [], in which all magnitudes are on AB-system. Of course, we can use Johnson-Cousins-Glass system colours together with AB system colours.
In the work, we analyzed colour pairs relating to five AB-system bands () and three 2MASS bands (). According to the results, colour pairs [], [] and [] are more suitable for constraining stellar-population parameters than others. The s of the three colour pairs can refer to Table 2. Because these pairs have colour-colour grids similar to those shown in Fig. 1, we do not show them here.
| Uncertainty (mag) | typical | 0.02 | 0.05 | 0.10 | ||||||||||
|---|---|---|---|---|---|---|---|---|---|---|---|---|---|---|
| Colour pair | ||||||||||||||
| (Gyr) | (dex) | (Gyr) | (Gyr) | (Gyr) | ||||||||||
| 3.89 | 0.0176 | 0.33 | 0.95 | 0.37 | 0.0047 | 0.17 | 1.01 | 0.0085 | 0.35 | 2.13 | 0.0145 | 0.66 | ||
| 3.57 | 0.0176 | 0.34 | 0.96 | 0.40 | 0.0045 | 0.17 | 1.14 | 0.0093 | 0.40 | 2.58 | 0.0146 | 0.78 | ||
| 4.15 | 0.0191 | 0.37 | 1.06 | 0.33 | 0.0044 | 0.16 | 0.96 | 0.0084 | 0.35 | 1.98 | 0.0142 | 0.63 | ||
| 3.89 | 0.0217 | 0.44 | 1.09 | 0.27 | 0.0032 | 0.12 | 0.89 | 0.0076 | 0.31 | 2.33 | 0.0131 | 0.58 | ||
| 4.33 | 0.0192 | 0.38 | 1.11 | 0.32 | 0.0040 | 0.15 | 1.04 | 0.0087 | 0.37 | 2.19 | 0.0142 | 0.67 | ||
| 3.16 | 0.0222 | 0.40 | 1.13 | 0.45 | 0.0078 | 0.25 | 1.28 | 0.0148 | 0.55 | 3.54 | 0.0228 | 1.19 | ||
| 3.18 | 0.0224 | 0.41 | 1.16 | 0.50 | 0.0089 | 0.29 | 1.44 | 0.0148 | 0.63 | 3.71 | 0.0206 | 1.19 | ||
| 4.12 | 0.0218 | 0.45 | 1.19 | 0.28 | 0.0034 | 0.12 | 0.92 | 0.0078 | 0.32 | 2.34 | 0.0133 | 0.61 | ||
| 5.21 | 0.0188 | 0.37 | 1.34 | 0.34 | 0.0041 | 0.16 | 1.48 | 0.0081 | 0.39 | 4.01 | 0.0144 | 0.90 | ||
| 6.21 | 0.0176 | 0.35 | 1.37 | 0.48 | 0.0073 | 0.31 | 2.27 | 0.0082 | 0.44 | 4.56 | 0.0132 | 0.98 | ||
| 4.20 | 0.0255 | 0.39 | 1.54 | 0.48 | 0.0073 | 0.31 | 3.54 | 0.0181 | 1.08 | 3.79 | 0.0211 | 1.26 | ||
| 6.81 | 0.0187 | 0.37 | 1.55 | 0.32 | 0.0072 | 0.28 | 2.13 | 0.0084 | 0.43 | 4.61 | 0.0146 | 0.96 | ||
| 5.42 | 0.0243 | 0.47 | 1.56 | 0.42 | 0.0096 | 0.34 | 2.61 | 0.0168 | 0.77 | 7.28 | 0.0257 | 2.26 | ||
| 5.09 | 0.0175 | 0.30 | 1.59 | 0.42 | 0.0096 | 0.34 | 2.47 | 0.0158 | 0.83 | 5.65 | 0.0146 | 1.71 | ||
| 5.61 | 0.0249 | 0.49 | 1.59 | 0.42 | 0.0096 | 0.34 | 2.80 | 0.0201 | 1.05 | 3.08 | 0.0203 | 1.10 | ||
| 5.38 | 0.0230 | 0.51 | 1.62 | 0.38 | 0.0050 | 0.18 | 1.19 | 0.0101 | 0.44 | 2.82 | 0.0152 | 0.80 | ||
| 5.56 | 0.0227 | 0.50 | 1.72 | 0.57 | 0.0052 | 0.21 | 1.32 | 0.0107 | 0.48 | 3.13 | 0.0151 | 0.98 | ||
| 4.72 | 0.0160 | 0.31 | 1.76 | 2.43 | 0.0110 | 0.93 | 2.72 | 0.0110 | 0.74 | 5.54 | 0.0153 | 2.05 | ||
| 7.77 | 0.0226 | 0.43 | 1.86 | 0.66 | 0.0064 | 0.29 | 2.99 | 0.0096 | 0.55 | 6.85 | 0.0176 | 1.44 | ||
| 5.58 | 0.0262 | 0.53 | 1.94 | 0.91 | 0.0140 | 0.53 | 2.36 | 0.0182 | 1.02 | 6.45 | 0.0264 | 2.74 | ||
| 5.23 | 0.0280 | 0.59 | 1.95 | 0.91 | 0.0140 | 0.53 | 2.36 | 0.0182 | 1.02 | 6.06 | 0.0215 | 2.06 | ||
| 5.53 | 0.0224 | 0.55 | 1.97 | 0.40 | 0.0074 | 0.23 | 1.95 | 0.0178 | 0.94 | 5.09 | 0.0233 | 1.88 | ||
| 8.02 | 0.0227 | 0.47 | 1.98 | 0.60 | 0.0077 | 0.35 | 2.79 | 0.0094 | 0.54 | 6.13 | 0.0167 | 1.27 |
| Old Population | Young or Metal-rich Population | Metal-poor Population | |||||||||
|---|---|---|---|---|---|---|---|---|---|---|---|
| Colour pair | Colour pair | Colour pair | |||||||||
| 6.88 | 0.0141 | 0.73 | 2.26 | 0.0174 | 0.76 | 3.64 | 0.0024 | 4.96 | |||
| 7.17 | 0.0146 | 0.73 | 1.34 | 0.0222 | 0.78 | 3.98 | 0.0024 | 4.96 | |||
| 7.58 | 0.0149 | 0.75 | 1.43 | 0.0220 | 0.81 | 4.10 | 0.0026 | 5.52 | |||
| 7.51 | 0.0144 | 0.76 | 2.54 | 0.0173 | 0.81 | 1.85 | 0.0032 | 5.69 | |||
| 8.17 | 0.0170 | 0.89 | 2.70 | 0.0195 | 0.85 | 3.89 | 0.0030 | 5.79 | |||
| 8.47 | 0.0174 | 0.91 | 2.64 | 0.0195 | 0.86 | 3.67 | 0.0032 | 6.18 | |||
| 9.57 | 0.0188 | 1.07 | 2.23 | 0.0216 | 0.93 | 3.42 | 0.0031 | 6.23 | |||
| 11.29 | 0.0177 | 1.10 | 2.46 | 0.0235 | 0.95 | 6.33 | 0.0029 | 6.26 | |||
| 9.19 | 0.0187 | 1.13 | 2.50 | 0.0235 | 0.96 | 3.87 | 0.0030 | 6.47 | |||
| 9.79 | 0.0170 | 1.16 | 2.29 | 0.0250 | 1.06 | 3.44 | 0.0031 | 6.67 | |||
5 Application of colours and colour pairs
5.1 Using colour pairs to constrain stellar-population parameters
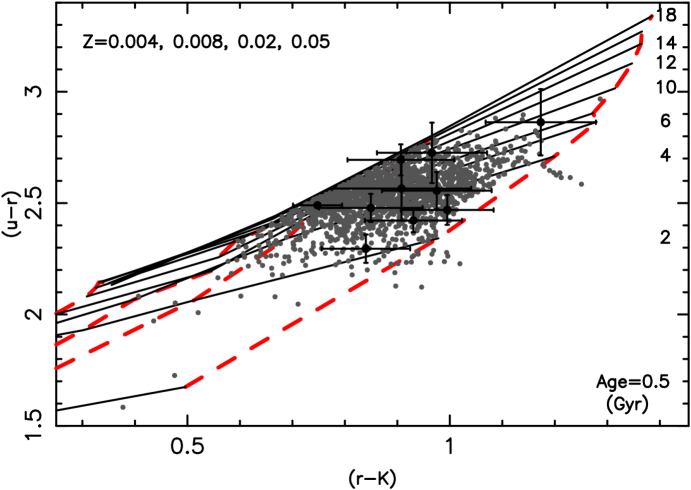
To test the application of colour pairs to estimate the ages and metallicities of stellar populations, we select 1 646 luminous (absolute magnitude and -band Petrosian magnitude 17.77) early-type (concentration index 2.8) galaxies observed by both 2MASS and the second release of SDSS (SDSS-DR2). All the sample galaxies have small magnitude uncertainties ( 0.15 mag). Note that only the galaxies with colour-fitted stellar ages smaller than 15 Gyr and stellar metallicities richer than 0.008 are selected for our sample galaxies, because the age of the universe was shown to be smaller than about 15 Gyr (e.g., Shafieloo et al. 2006) and the results for populations with metallicities poorer than 0.008 seems unreliable as large uncertainties. Then we use and colours to estimate two stellar-population parameters of these galaxies, according to the results shown in Tables 2 and 3. The -band magnitudes of galaxies are calculated from -band magnitudes supplied by 2MASS, by using the same method as Bessell (2005). The -corrections of -band magnitudes are estimated as , as used by Girardi et al. (2003), where is the redshift. The galactic extinctions of -band magnitudes are calculated using the model of Burstein & Heiles (1982). The and bands magnitudes, and their -corrections and galactic extinctions are taken from SDSS. The differences between SDSS magnitudes and AB magnitudes are taken into account according to the values supplied by SDSS. In Fig. 2, the sample galaxies are shown on the versus grid. For clearly, we only plotted the error bars for the first 10 galaxies of our sample, which are marked in black. We see that a rough estimation for the two parameters of galaxies can be obtained, although the uncertainties are somewhat big. As examples, we list the stellar-population parameters of a few galaxies in Table 4, in which the data of three subsets of galaxies are listed.
| Photometric results | Spectroscopic results | |||||||||
| Population type | objID | Age | Error | Error | Age | Error | Error | |||
| (Gyr) | (Gyr) | (Gyr) | (Gyr) | |||||||
| 587727177921921120 | 4.6 | 0.0293 | 7.4 | 0.0411 | ||||||
| Old | 587727225693143113 | 5.7 | 0.0300 | 6.8 | 0.0291 | |||||
| 587727225692160083 | 9.1 | 0.0416 | 6.7 | 0.0350 | ||||||
| 587727177921986670 | 2.7 | 0.0478 | 5.3 | 0.0241 | ||||||
| Young and metal-rich | 587727225160466548 | 2.2 | 0.0385 | 6.2 | 0.0301 | |||||
| 587727225689538771 | 2.7 | 0.0432 | 6.0 | 0.0305 | ||||||
| 587727230524063879 | 3.7 | 0.0189 | 7.4 | 0.0226 | ||||||
| Young and metal-poor | 587727227302707220 | 3.8 | 0.0166 | 6.2 | 0.0251 | |||||
| 588848898845114541 | 2.9 | 0.0192 | 3.5 | 0.0135 | ||||||
In fact, even if we take Lick indices for such work, the uncertainties in stellar ages and metallicities of these galaxies are very big because of the large observational uncertainties. For our sample galaxies, the uncertainties in H and [MgFe] indices are typically about 0.3 , which will lead to large uncertainties in stellar-population parameters. The Lick indices and uncertainties of our sample galaxies are taken from the Garching SDSS catalogs (http://www.mpa-garching.mpg.de/SDSS/DR4/). Furthermore, we found that 24 galaxies are out of the theoretical grid of BC03 models. This possibly results from the effects of young stellar populations of galaxies, the limitation of theoretical models, and large observational uncertainties of colours. In special, we found that most galaxies can fall inside the theoretical colour-colour grid when taking their colour uncertainties into account. This means that most of the 24 galaxies could have physical ages, but as pointed out by Li et al. (2007), the presence of young populations in such early-type galaxies can also make metal-rich populations outside the theoretical colour-colour grids.
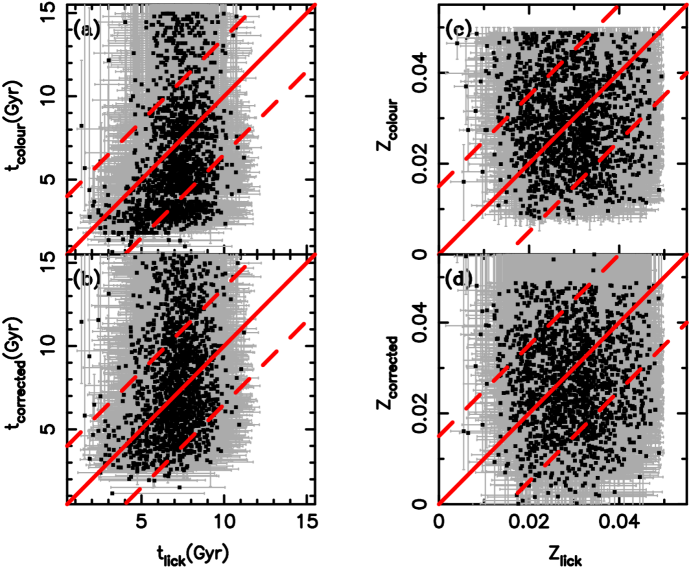
In the work, we fitted the stellar ages and metallicities of our sample galaxies via BC03 SSPs with ages within 0.1–19.96 Gyr and metallicities within 0.0001–0.05. In Fig. 3, we compare the parameters determined by colours with those by a few Lick indices (Gallazzi et al., 2005). The results of Gallazzi et al. (2005) were obtained by comparing D4000, H, H+H, [Mg2Fe], and [MgFe]′ indices of galaxies to the values of theoretical stellar populations and have taken the effects of young populations (YSPs) into account. The detailed data about the sample galaxies can be obtained on request to the authors or via the CDS in the future. From panels (a) and (c) of Fig. 3, we find that the stellar ages and metallicities determined by colours are respectively smaller and somewhat richer than those determined by Lick indices. The reason is that there are composite stellar populations (CSPs) in galaxies and the YSPs make the results derived from colours bias younger and richer in metal compared to those of the dominant populations (DSPs) of galaxies (Li & Han, 2007). In detail, because the age of a YSP affects the colours of a star system more stronger than the mass fraction of the YSP, YSPs with only a few percent stellar mass can make the colour-fitted stellar populations younger and metal-richer than DSPs of galaxies if the YSPs are not too old. Then in panels (b) and (d) Fig. 3, we compare the stellar-population parameters measured by colours and corrected for the effects of YSPs to those determined by Lick indices. The correction is accomplished using the possible distributions of the differences between the stellar-population parameters of the DSPs of CSPs and the parameters derived from two colours of CSPs (Li & Han, 2007). The above distributions were obtained by a statistical method, in which the fractions of YSPs were assumed to depend on the ages of the DSPs and YSPs, and the fraction of a YSP was assumed to decline exponentially with decreasing age of the YSP (see, e.g., Thomas et al. 2005). In special, the distributions can be used to give a rough correction for the effects of YSPs. Here, we get the corrected stellar age of a galaxy by submitting from the colour-fitted result a random value that fits to the distribution of the difference between the stellar ages of DSPs and those derived from two colours. A similar method is used to get the corrected stellar metallicities. For more clearly, we show the distributions of the uncorrected and corrected parameters in Fig. 4. We are shown that after the correction, the distributions of stellar ages obtained by two methods, especially the peaks, become more similar after the correction (Fig. 4). However, it is also shown that the distributions of stellar metallicities obtained by various methods are similar. Therefore, it seems that without any correction, we can get correct distributions of stellar metallicities of luminous early-type galaxies via colours. Note that because we used a least-square fitting method similar to Denicoló et al. (2005) and Li et al. (2006), the effects of the uncertainties of colours were not taken into account here. The uncertainties may effect the above distributions slightly. Furthermore, the dust may contribute to the difference between the two kinds of results. In fact, a small amount of dust can make colours of galaxies redder, and then lead to additional uncertainties in stellar ages. In detail, a dust of E() = 0.05 will change the and colours about 0.12 mag, and then lead to about 2.5 Gyr age uncertainty and 0.015 metallicity uncertainty. In addition, the average stellar-population parameters obtained by photometry and spectroscopy are found to be similar (about 7 Gyr for age and 0.02 for metallicity). Therefore, although it is difficult to get the accurate stellar-population parameters of each galaxy via colours, we can get reliable values for the average age and metallicity of a sample of galaxies, as can the distributions of the two parameters.

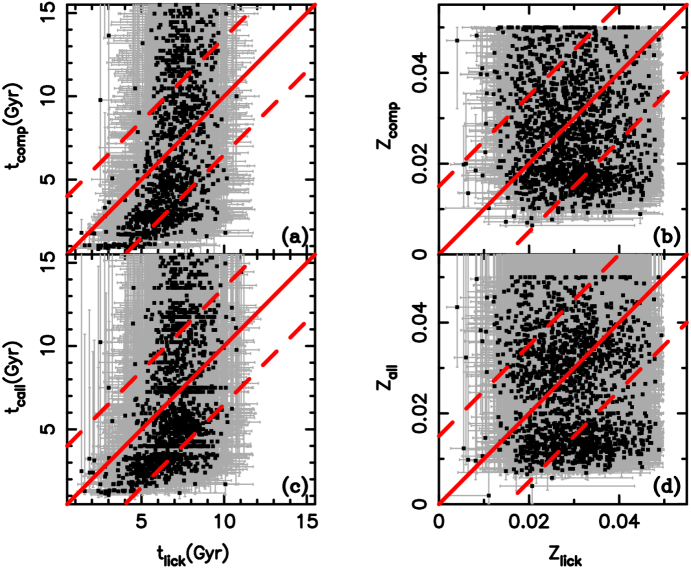
5.2 Using colours in conjunction with spectroscopic indices
Because some colours are shown to be sensitive to stellar age or metallicity, we can possibly use colours in conjunction with Lick indices to study stellar-population parameters. For example, we can use a metallicity-sensitive colour together with an age-sensitive Lick index to estimate the stellar ages and metallicities of galaxies. We have a try in this work. The above galaxy sample are used here. The stellar-population parameters are fitted via H and indices using the same method as Sect 5.1. The results are compared to those determined by Gallazzi et al. (2005) in panels (a) and (b) of Fig. 5. Note that the results did NOT correct for the effects of young populations. We see that using H instead of , the stellar ages obtained are closer to those of Gallazzi et al. (2005). This means that line indices are affected by young populations of galaxies more slightly. However, the fitted stellar metallicities of some galaxies are poorer than those obtained by Gallazzi et al. (2005). It should mainly result from the effects of YSPs in galaxies. In fact, YSPs make the colour of galaxies obviously bluer than those of the DSPs, but they affect the H index more slightly. When is used in conjunction with H to estimate the stellar-population parameters of galaxies, the two indices will lead to more poor metallicities compared those determined by a colour pair. One can see a H versus [MgFe] grid for comparison, as the shape of H versus grid is similar to that of H versus [MgFe]. Therefore, it is difficult to use photometry in conjunction with spectroscopy to estimate the metallicities of galaxies. Furthermore, we tried to give some final results for the stellar-population parameters of our sample galaxies using H, [MgFe], and indices together. Because the uncertainties of colours and Lick indices are different, we use a fit (see, e.g., Press et al. 1992) to estimate the stellar-population parameters. The stellar metallicities are shown to be different significantly from those determined by previous work. The comparison can be seen in panels (c) and (d) of Fig. 5. The results did not correct for the effects of young populations, either. Because the results of (Gallazzi et al., 2005) have taken the effects of YSPs into account, the above results are certainly affected by the YSPs in galaxies. The results may also effected by the large observational uncertainties. However, it seems that the YSPs effect the results stronger, because when we tried to estimate the stellar-population parameters via H and [MgFe], we got poorer metallicities than those of the previous work. As a whole, our results suggest that colour pairs can be used more conveniently for estimating the stellar-population parameters of distant galaxies, as colours can be obtained more easily than spectra and can constrain the stellar-population parameters with uncertainties similar to Lick indices (typically 4 Gyr for age and 0.015 for metallicity).
6 discussions and conclusions
We investigated the relative metallicity sensitivities of AB system colours relating to , , , , , , , , , , , and bands in the first place. Then we studied the abilities of colour pairs for constraining luminosity-weighed stellar ages and metallicities. The results showed that [] and [] are the best colour pairs for breaking the stellar age–metallicity degeneracy while colour pairs such as ], [], [] and [] can also be used. Colour pairs [] and [] can measure two stellar-population parameters with small uncertainties ( 3.89 Gyr, 0.34 dex for typical uncertainties in colours). However, the age uncertainties for old populations (Age 4.6 Gyrs) and metal-poor populations ( 0.001) are always significantly larger than for young populations (Age 4.6 Gyrs) and metal-rich populations ( 0.001). The reason is that the colours of some old populations or metal-poor populations are largely indistinguishable within present typical errors. One can see Fig. 3 for comparison. However, the metallicity uncertainty of metal-poor populations (about 0.0024) is much less than that of other populations (about 0.015). In the work, we did not take the uncertainties in theoretical stellar population models into account. A detailed study about it please refer to the work of Yi (2003). Furthermore, colours are usually affected by the dust of galaxies, even if early-type ones. A typical effect of dust in early-type galaxies, E(B-V) 0.05, will change the and colours of galaxies about 0.12 mag, and then lead to additional uncertainties in stellar-population parameters (about 2.5 Gyr for age and 0.015 for metallicity). Thus it is more suitable to use colours to measure the stellar-population parameters of galaxies with poor dust and gas, e.g., luminous early-type ones (with small colour uncertainties). Actually, to quantify the age and metallicity errors induced by a typical dust is in study. When we compare the results determined by photometry with those determined by Lick indices, we found that the stellar ages determined by colours are less than those determined by Lick indices. The difference mainly results from the effects of young populations in these galaxies. We also found that the average uncertainties of stellar-population parameters determined by colours and Lick indices are similar (typically 4 Gyr for age and 0.015 for metallicity). Therefore, it is actually difficult to get the absolute values of stellar ages and metallicities via colours, but we can get some relative values. This will be useful for some statistical studies of the stellar populations of galaxies. In addition, our results suggest that it is better to use colours relating to both and bands than to use those only relating to one of the two kinds of bands for estimating the two stellar-population parameters. According to the results, we can estimate the stellar-population parameters of some distant galaxies, via the photometry data supplied by, e.g., SDSS and 2MASS. The possible uncertainties of using various colour pairs can be estimated. The results presented in the paper can also help us to choose suitable bands for the observation of stellar population studies.
We also tried to find some colour pairs that are suitable for estimating the luminosity-weighted ages and metallicities of some special stellar populations. The results show that some colour pairs for estimating the two stellar-population parameters of young (Age 4.6 Gyr), old (Age 4.6 Gyr), metal-poor ( 0.001), and metal-rich ( 0.001) populations are different. However, [] can be used to estimate the ages and metallicities of all stellar populations.
Although we took the BC03 model for our work, the results can be used for other models as most stellar population synthesis models predict similar colours for the same population. Furthermore, we suggest to choose a colour pair for estimating the two stellar-population parameters of galaxies, although a few colours can give smaller range for the two parameters. The reason is that galaxies usually contain more than two populations, and via comparing observational colours with predictions of simple stellar populations, we can only measure less stellar ages and richer stellar metallicities for galaxies compared to the dominant stellar populations (DSPs) of galaxies. For a sample of galaxies, the effects of young populations on the ages and metallicities of dominant stellar populations can be roughly corrected and some reliable estimations for the averages and distributions of two stellar-population parameters can be obtained (Li & Han, 2007).
Note that the BC03 model is a single stellar population model, which does not take the binary interactions into account. This is actually different from the real stellar populations of galaxies. If stars of a population evolve as binaries rather than single stars, the colours of the population will be different with those of a single stellar population. Typically, the and colours predicted by binary stellar populations will be bluer about 0.05 mag than those predicted by single populations. Using binary populations instead of single populations, the stellar ages and metallicities will be about 1.14 Gyr older and 0.0093 richer, respectively. A detailed study about this will be given in the future.
Acknowledgments
We greatly acknowledge the anonymous referee for some useful comments. We also thank Profs. Gang Zhao, Xu Kong, and Dr. Fenghui Zhang for useful discussions, Dr. Anna Gallazzi for some useful discussions and her group for the line indices, stellar ages and metallicities of our sample galaxies, the Sloan Digital Sky Survey (SDSS), the Two-Micron All-Sky Survey (2MASS) and the NASA/IPAC Extragalactic Database (NED) for the photometry data of galaxies. This work is supported by the Chinese National Science Foundation (Grant Nos 10433030, 10521001), and the Chinese Academy of Science (No. KJX2-SW-T06).
References
- Baugh et al. (1996) Baugh C. M., Cole S., Frenk C. S., 1996, MNRAS, 283, 1361
- Baugh et al. (1998) Baugh C. M., Cole S., Frenk C. S., Lacey C. G., 1998, ApJ, 498, 504
- Bell & de Jong (2000) Bell E. F., de Jong R. S., 2000, MNRAS, 312, 497
- Bessell (2005) Bessell M. S., 2005, ARA&A, 43, 293
- Bruzual & Charlot (2003) Bruzual G., Charlot S., 2003, MNRAS, 344, 1000
- Burstein & Heiles (1982) Burstein D., Heiles C., 1982, AJ, 87, 1165
- Chabrier (2003) Chabrier G., 2003, ApJ, 586, L133
- Cole et al. (2000) Cole S., Lacey C. G., Baugh C. M., Frenk C. S., 2000, MNRAS, 319, 168
- De Lucia et al. (2006) De Lucia G., Springel V., White S. D. M., Croton D., Kauffmann G., 2006, MNRAS, 366, 499
- Denicoló et al. (2005) Denicoló G., Terlevich R., Terlevich E., Forbes D. A., Terlevich A., 2005, MNRAS, 358, 813
- Dorman et al. (2003) Dorman B., O’Connell R. W., Rood R. T., 2003, ApJ, 591, 878
- Fioc & Rocca-Volmerange (1997) Fioc M., Rocca-Volmerange B., 1997, A&A, 326, 950
- Gallazzi et al. (2005) Gallazzi A., Charlot S., Brinchmann J., White S. D. M., Tremonti C. A., 2005, MNRAS, 362, 41
- Girardi et al. (2003) Girardi M., Mardirossian F., Marinoni C., Mezzetti M., Rigoni E., 2003, A&A, 410, 461
- James et al. (2006) James P. A., Salaris M., Davies J. I., Phillipps S., Cassisi S., 2006, MNRAS, 367, 339
- Kauffmann & Charlot (1998) Kauffmann G., Charlot S., 1998, MNRAS, 294, 705
- Kaviraj et al. (2006) Kaviraj S., Rey S. ., Rich R. M., Lee Y. ., Yoon S. ., Yi S. K., 2006, ArXiv Astrophysics e-prints
- Kodama et al. (1998) Kodama T., Arimoto N., Barger A. J., Arag’on-Salamanca A., 1998, A&A, 334, 99
- Kong et al. (2006) Kong X., Daddi E., Arimoto N., Renzini A., Broadhurst T., Cimatti A., Ikuta C., Ohta K., da Costa L., Olsen L. F., Onodera M., Tamura N., 2006, ApJ, 638, 72
- Kormendy & Djorgovski (1989) Kormendy J., Djorgovski S., 1989, ARA&A, 27, 235
- Lee et al. (2007) Lee H.-c., Worthey G., Trager S. C., Faber S. M., 2007, ApJ, 664, 215
- Li & Han (2007) Li Z., Han Z., 2007, A&A, 471, 795
- Li et al. (2007) Li Z., Han Z., Zhang F., 2007, A&A, 464, 853
- Li et al. (2006) Li Z.-M., Zhang F.-H., Han Z.-W., 2006, ChJAA, 6, 669
- Peletier & Balcells (1996) Peletier R. F., Balcells M., 1996, AJ, 111, 2238
- Press et al. (1992) Press W., Teukolsky S., Vetterling W., Flannery, B., Numerical Recipes in FORTRAN: Second Edition, Cambridge university press, 1992
- Puzia et al. (2002) Puzia T. H., Zepf S. E., Kissler-Patig M., Hilker M., Minniti D., Goudfrooij P., 2002, A&A, 391, 453
- Shafieloo et al. (2006) Shafieloo A., Alam U., Sahni V., Starobinsky A. A., 2006, MNRAS, 366, 1081
- Thomas (1999) Thomas D., 1999, MNRAS, 306, 655
- Thomas et al. (2005) Thomas D., Maraston, C., Bender, R., 2005, ApJ, 621, 673
- Thomsen & Baum (1989) Thomsen B., Baum W. A., 1989, ApJ, 347, 214
- van Dokkum & Stanford (2003) van Dokkum P. G., Stanford S. A., 2003, ApJ, 585, 78
- Vazdekis (1999) Vazdekis A., 1999, ApJ, 513, 224
- Worthey (1994) Worthey G., 1994, ApJS, 95, 107
- Wu et al. (2005) Wu H., Shao Z., Mo H. J., Xia X., Deng Z., 2005, ApJ, 622, 244
- Yi (2003) Yi S. K., 2003, ApJ, 582, 202
- Zhang et al. (2005) Zhang F., Li L., Han Z., 2005, MNRAS, 364, 503