VIMOS-VLT spectroscopy of the giant Ly nebulae associated with three 2.5 radio galaxies.††thanks: Based on observations carried out at the European Southern Observatory, Paranal (Chile). Programs 075.B-0212(A) and 073.B-0189(A).
Abstract
The morphological and spectroscopic properties of the giant (60 kpc) Ly nebulae associated with three radio galaxies at 2.5 ( MRC 1558-003, MRC 2025-218 and MRC 0140-257) have been investigated using integral field spectroscopic data obtained with VIMOS on VLT.
The morphologies are varied. The nebula of one source has a centrally peaked, rounded appearance. In the other two objects, it consists of two spatial components. The three nebulae are aligned with the radio axis within 30o. The total Ly luminosities are in the range (0.3-3.4)1044 erg s-1. The Ly spectral profile shows strong variation through the nebulae, with FWHM values in the range 400-1500 km s-1 and velocity shifts 120-600 km s-1.
We present an infall model that can explain successfully the morphology, size, surface brightness distribution and the velocity field of the Ly nebula associated with MRC 1558-003. It can also explain why Ly is redshifted relative to other emission lines and the FWHM values of the non resonant HeII line. This adds further support to our previous conclusion that the quiescent giant nebulae associated with this and other high redshift powerful radio galaxies are in infall. A problem for this model is the difficulty to reproduce the large Ly FWHM values, which might be consequence of a different mechanism.
We have discovered a giant (85 kpc) Ly nebula associated with the radio galaxy MRC 0140-257 at 2.64. It shows strikingly relaxed kinematics (FWHM300 km s-1 and 120 km s-1), unique among high (2) radio galaxies.
keywords:
galaxies: active; galaxies: high redshift; galaxies: individual: MRC 1558-003, MRC 2025-218, MRC 0140-2571 Introduction
Powerful high radio galaxies (2, HzRG) are often surrounded by giant Ly nebulae which can extend for more than 100 kpc (e.g. McCarthy et al. 1990a; Reuland et al. 2003, Villar-Martín et al. 2003) and sometimes beyond the radio structures (e.g. Eales et al. 1993; Kurk et al. 2002; Maxfield et al. 2002). These are clumpy, irregular (with features such as filaments, plumes, ionization cones, e.g. Reuland et al. 2003) and often aligned with the radio axis (McCarthy et al. 1995). They are characterized by extreme kinematics, with measured FWHM 1000 km s-1 (e.g. McCarthy, Baum & Spinrad 1996; Villar-Martín et al. 2003), compared with values of a few hundred in low-redshift radio galaxies (e.g. Tadhunter, Fosbury & Quinn 1989; Baum, Heckman & van Breugel1990). There is strong evidence that interactions between the radio structures and the ambient gas, produce an outflow responsible for such extreme kinematics (e.g. Humphrey et al. 2006, van Ojik et al. 1997).
The nebulae have typical values of ionized gas mass 109-10 M⊙, Ly luminosities several1043-44 erg s-1 and densities few to several hundred cm-3 (e.g. McCarthy 1993, Villar-Martín et al. 2003). They emit a rich emission line spectrum dominated in the optical (UV rest frame) by Ly followed by CIV1550, HeII1640 and CIII]1909 (CIV, HeII and CIII] hereafter). Such a line spectrum reveals high levels of metal enrichment and excitation mechanisms mostly related to the nuclear activity, at least in the direction along the radio structures (e.g. Vernet et al. 2001).
In addition to the highly perturbed gas, HzRG are often embedded in giant (often 100 kpc), low surface brightness nebulae of metal rich, ionized gas with quiescent kinematics (Villar-Martín et al. 2003, Reuland et al. 2007), i.e., not perturbed by interactions with the radio structures. We have recently shown that these quiescent nebulae are infalling towards the central region (Humphrey et al. 2007).
There are only several narrow band Ly images of HzRG and most spectroscopic studies have been performed with the long-slit technique, with the slit aligned with the radio structures. These studies have been seriously limited by, respectively, the lack of spectral information, or the lack of spatial information in directions other than the radio axis. For this reason, we are carrying out an observational program of 3D integral field spectroscopy of powerful radio galaxies at 2-3 with VIMOS on VLT and PMAS/PPAK on the 3.5m telescope in Calar Alto Observatory. The main goal is to characterize the morphological, kinematic and ionization properties of the extended ionized gas in two spatial dimensions.
In this paper, we present results obtained for MRC 1558-003 (=2.53), MRC 2025-218 (=2.63) and MRC 0140-257 (=2.64), based on VIMOS-VLT data. Results on MRC 2104-242 (=2.49) can be found in Villar-Martín et al. (2006). A similar study of 4C40.36 (=2.27) and 4C48.48 (=2.34) based on PMAS/PPAK data (3.5m telescope, Calar Alto Observatory) will be presented in Sánchez et al. (2007, in prep.).
A 0.73, = 0.27 and = 62 km Mpc-1 cosmology is adopted in this paper (Sandage et al. 2006).
2 Observations and data reduction
The observations (program 075.B-0212(A)) were made on UT 2005 July 28, 29 and 30 using the VIsible MultiObject Spectrograph (VIMOS, Le Févre et al. 2003), on the Nasmyth focus of the UT3 VLT. The instrument is equipped with an integral field unit with 6400 microlenses coupled to fibres. For the configuration selected by us, the number of fibers in use is 1600, covering 27” x 27” on the sky with a 0.67” sampling. The HRblue grating was used, with an effective wavelength range 4150-6200 Å, an instrumental profile of FWHM 1.70.2 Å and a pixel scale of 0.5 Å pixel-1.
The exposure time on each target was 7.3 h (221200 s) on MRC 1558-003, 10 h (301200 s) on MRC 2025-218 and 8.3 h (251200 s) on MRC 0140-257. In addition, we had 4.5 h (91800 s) on MRC 1558-003 obtained in June 2004 (program 073.B-0189(A), see Villar-Martín et al. 2006 for a description of these observations). The total integration time on this source was therefore 11.8 h.
The seeing full width at half maximum during the observations was in the range 0.44-1.32” (1st night), 0.4-1.2” 2nd night) and 0.5”-3.0” (3rd night) for the 2005 observations, and 1.0-1.4 for the 2004 data on MRC 1558-003.
For each galaxy a dithering pattern was applied, with a maximum offset of 3”, and a range of dithering pointings between 3 and 7.
The data were reduced using R3D (Sánchez 2006) and IRAF routines. The data were bias subtracted. The locations of the spectra were traced on a continuum-lamp exposure obtained before each target exposure. The corresponding spectrum was then extracted for each fiber by coadding the flux intensity within a 5 pixel aperture, along the spectral dispersion axis, centered on the estimated location of the fiber centroid.
The wavelength calibration was performed using arc lamp spectra and the telluric emission lines in the science data. The wavelength solution was stable within a fraction of 1 spectral pixel (0.5 Å) across the whole spectral range and the whole field of view.
The wavelength calibration in the blue (i.e. the Ly spectral region) was problematic due to the lack of bright emission lines in the arc lamp and sky spectra. Residual, artificial shifts in of up to 6 Å were measured for Ly relative to CIV and HeII in MRC 1558-003 and MRC 2025-218. We have been able to correct for this effect by comparing with available Keck long-slit spectroscopy (Villar-Martín et al. 2003, Humphrey 2004), to an accuracy of 1 Å. In any case, such uncertainty will not affect the results presented here.
The fibre-to-fibre response at each wavelength was determined from a continuum-lamp exposure.
After these basic reduction steps, a data cube was created for each exposure. The cubes for MRC 2025-218 were then recentered spatially at each wavelength by determining the centroid of a nearby star in the VIMOS field of view. This recentering corrects for differential atmospheric refraction.
For the other two objects, there are no stars in the VIMOS field of view. We used the information on the spatial shifts contained in the image headers to apply the corresponding shifts. However, we found that this technique left substantial spatial offsets. For this reason, we used the Ly peak of emission to recenter all cubes. Although this recentering is valid in the blue, it is not clear that it is also valid in the red. In particular, in the case of MRC 1558-003, we found a residual spatial shift of 1 spaxel in the direction of the radio structures between the blue (Ly) and red (CIV, HeII) parts of the spectrum, which is much larger than found in previous works (Villar-Martín et al. 1999; Humphrey et al. 2007). For this reason, an additional correction was applied. Uncertainties remain regarding the spatial centering in the direction perpendicular to the radio axis, although this is likely to be 1 spaxel or 0.67. This will not affect seriously the results presented here.
For MRC 0140-257, no useful previous works or additional data were available. Although the accuracy of the spatial centering between the red and the blue ends of the spectrum is uncertain, this will not affect the results presented here, due to the nature of our analysis and the clear separation between the spatial components of the Ly nebula.
The cubes were then combined using IRAF tasks, masking the broken and/or low sensitivity fibres. A 3 clipping algorithm removed cosmic rays. The sky background was estimated before subtraction by selecting the spectra of object free areas and creating an interpolated datacube (using E3D, Sánchez 2004). A spatial median smoothing using a 4x4 spaxel box was applied.
The nights were non-photometric. Observations of standard stars were used to perform a relative calibration from blue to red. The absolute flux calibration for MRC 1558-003 and MRC 2025-218 was done using available Keck long-slit spectroscopy along the radio axis. We extracted a pseudo-slit from the Vimos data as similar as possible to the slit aperture of the Keck spectra. The flux in different spectral windows was then compared and scaled. The final flux calibration has an accuracy of 20%. For MRC 0140-257, this could not be done, due to the unavailability of a high quality long-slit spectrum, but as we explain in §5.3, the agreement between the measured Ly flux and published values is reasonably good (20%).
Cross-talk effects are estimated to be negligible. The fibre to fibre contamination is expected to be 5% for adjacent spectra in the CCD, dropping to less than 1% for the 3rd adjacent spectra.
To overlay the radio maps (Carilli et al. 1997, Pentericci et al. 2000) on the Ly images, a different method was used for each object depending on the information available in the data. For MRC 2025-218, we placed the radio core at the position of the continuum centroid in the VIMOS data. Since this is a broad line object (§3.2), it is reasonable to expect that this marks the location of the active nucleus (AGN). This is further supported by the fact that the UV continuum has an spatially unresolved component (§3.2).
For MRC 1558-003, we positioned the radio core at the spaxel with the maximum Ly flux, which is expected to be shifted by a few tenths of a spaxel relative to the continuum centroid (Humphrey et al. 2007). This method would be incorrect if the AGN is spatially shifted relative to the continuum and/or line centroids. However, we do not expect this to be the case since this is a broad line object and moreover, it shows little evidence for Ly absorption (see below). The 1 uncertainty in the Ly-radio registration is 0.3” in both cases.
For MRC 0140-257, we assumed that the radio core is placed between the two Ly spatial components, although it is not necessarily the case. This is the main source of uncertainty since the radio core could be shifted by 2 if it is associated with one of the two Ly blobs (§4.3). The impact of this assumption on the interpretation of our results will be discussed when relevant.
2.1 Vimos sensitivity
The main scientific goal of our VIMOS-VLT observational program is to study the properties of the giant nebulae associated with a sample of HzRG. By isolating spectroscopically and/or spatially the emission from the perturbed and the quiescent gaseous components (e.g. Villar-Martín et al. 2003), one of our priorities is to characterize the morphological, kinematic and ionization properties of the quiescent gas. In this way we can study the gas without the strong distortions that the radio structures can imprint on its observed properties. Such study has the potential to provide critical information on the star formation and chemical enrichment histories as well as the galaxy formation process (Villar-Martín et al. 2003, Humphrey et al. 2006, 2007).
In order to achieve these goals, it is critical to detect the main UV lines (very especially Lya and HeII) with high signal/noise in the faint, outer regions of the objects, which are usually characterized by quiescent kinematics. Moreover, this would allow to study in detail the high surface brightness regions (at least several times brighter). Although usually distorted by the radio structures, it should be possible to isolate spectroscopically the emission from the quiescent and the perturbed gas using especially the non resonant HeII line, as Villar-Martín et al. (2003).
The faintest regions of our interest have often Ly surface brightness levels which are, within the errors, consistent with or even below the detection limit or our Vimos data (310-17 erg s-1 cm-2 arcsec-2) for 8-10 hours exposure time. For comparison, van Ojik et al. (1996) detected in 4 hours the giant, quiescent, low surface brightness nebula (l0-17 erg s-1 cm-2 arcsec-2) associated with a radio galaxy at 3.6 using long slit spectroscopic data obtained with EMMI (ESO Multi-Mode Instrument) on the 3.5m NTT telescope (La Silla). With a 2.5 wide slit, the spectral resolution was of 2.8 Å, not very different to that of our data. In the VIMOS data, not even Ly could be definitively detected from the faintest regions of our interest, which at least in MRC 1558-003 and MRC 2025-218 we knew exist (§3). HeII and CIV are detected only from the highest surface brightness regions, but with not enough signal/noise ratio to perform an adequate kinematic and ionization analysis in two spatial dimensions.
Thus, the investigation of the properties of the quiescent gas has been possible only for those objects where there is no signature of interactions between the radio structures and the gas (MRC 1558-003 and MRC 0140-257, see §4) or objects with no spectroscopic blend between the perturbed and the quiescent nebula (MRC 2104-242, Villar-Martín et al. 2006). Moreover, in all three cases, Ly is not heavily absorbed. For objecs where the emissions from the perturbed and the quiescent gas are blended and/or Ly is absorbed (i.e. an important fraction of HzRG), a more sensitive instrument/telescope combination is needed.
3 Previous results
The three radio galaxies discussed in this paper, MRC 1558-003, MRC 2025-218, MRC 0140-257, belong to the Molonglo Catalogue of high redshift radio galaxies (Large et al. 1981, McCarthy et al. 1990b). The objects were selected based on previous evidence for strong Ly emission. The two first objects were previously known to be associated with giant (60 kpc) Ly nebulae (see below).
3.1 MRC 1558-003 (z=2.53)
This object is associated with radio structures which extend for 9” or 84 kpc (Pentericci et al. 2000) along a position angle () of 75o.
Previous long-slit spectroscopic studies have shown that Ly is extended for at least 14 (130 kpc) along the slit with 72o, well beyond the radio structures (e.g. Villar-Martín et al. 2003). CIV and HeII are extended across 6”, while NV, which is fainter, has a more compact appearance. The optical continuum is also extended.
ISAAC near infrared spectroscopy revealed very broad H (FWHM11700900 km s-1, Humphrey2004; Humphrey et al. 2007, in prep.), evidence for an obscured broad line region (BLR). According to the unified scheme of quasars and radio galaxies (Barthel 1989), the detection of BLR emission implies that the ionization cones axis is at a small angle to line of sight (45). This is further suggested by the detection of a clear one-sided radio jet (see Fig. 1).
High resolution optical spectroscopy (FWHM1.7 Å) showed no absorption features in the Ly spectral profile integrated along =85o (van Ojik et al. 1997). Absorption features were not found either along =75o by Villar-Martín et al. (2003), although the spectral resolution was rather low in this case (FWHM11 Å). The small impact of absorption effects is also suggested by the large Ly/HeII values measured across the nebula (Humphrey 2004, Villar-Martín et al. 2007)
For this object no HST or emission line images are available in the literature.
3.2 MRC 2025-218 (z=2.63)
This radio galaxy is associated with a small radio source (5” or 46 kpc, Carilli et al. 1997).
There is strong evidence for an obscured BLR in MRC 2025-218. The morphology of the object at optical and near infrared wavelengths is dominated by a point source (Pentericci et al. 1999, 2001; McCarthy, Person & West 1992). Broad CIV and broad H (FWHM6000 km s-1 ) revealed by optical (Villar-Martín et al. 1999) and near infrared (Larkin et al. 2000; Humphrey2004; Humphrey et al. 2007, in prep.) spectra confirm this interpretation. The UV rest frame continuum emission shows also an extended (6”) diffuse component, which is well aligned with the radio axis (Pentericci et al. 1999).
The Ly emission is distributed bimodally (McCarthy et al. 1990b) north-south with two peaks that correspond roughly to the two radio lobes. The authors measured a total extension of 4” or 37 kpc. Keck long-slit optical spectroscopy (Humphrey2004) reveals that Ly is extended up to 9” or 83 kpc. CIV, HeII and CIII] are also spatially extended. CIV and CIII] each have a spatially unresolved component centered at the continuum centroid and also an underlying extended component spanning 5” along the radio axis. NV is spatially unresolved.
Villar-Martín et al. (1999) detected absorption in the spectrum of MRC 2025-218 for CIV, CII1335, SiIV1393.8,1402.8 and, maybe, OI1302.2+ SiII1402.8. The steep Ly profile on the blue side of the line was also proposed to be a signature of absorption.
3.3 MRC 0140-257 (z=2.64)
This object is associated with a small double radio source (4.2 or 39 kpc, Carilli et al. 1997). In the optical, it appears as a faint galaxy spatially extended and aligned with the radio source (McCarthy, Persson & West 1992).
Ly and H are the two lines detected in previous spectroscopic studies (McCarthy et al. 1991; Eales & Rawlings 1996). It has not been reported whether the lines are spatially extended.
The F160W filter NICMOS-HST image (rest frame spectral window 3850-4950 Å, Pentericci et al. 2001) shows two peaks of emission with almost the same flux, closely aligned with the radio axis. The authors suggest that this morphology could be due to a dust lane. There are a few fainter clumps within 2-3”.
Eales & Rawlings (1996) report Ly/H=0.31, which is 30 times lower than standard case B photoionization model predictions. As the authors explain, this value is very uncertain, since they had to assume a fixed value of the [NII]/H ratio (0.5) and no aperture corrections to the line fluxes were attempted. In spite of these uncertainties, the very large discrepancy with the model predictions suggest that Ly absorption/extinction is present.
For this object no emission line images are available in the literature.
4 Results
We present below the most relevant results obtained for the three radio galaxies investigated here.
4.1 MRC 1558-003 (z=2.53)
The Ly nebula
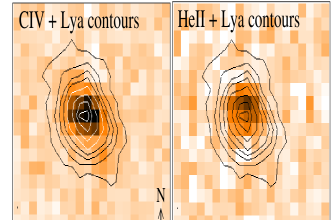
The VIMOS Ly+continuum image of MRC 1558-003 was created by adding the monochromatic images of the object within the [4285-4315] Å range. A continuum image was subtracted to keep the line emission only. This was created by combining the images extracted from two adjacent spectral windows at both sides of Ly, with the same spectral width as the line+continuum image. The resulting Ly image is shown in Fig. 1 (see also Fig. 2), with the 8.2GHz radio contours overlaid (Pentericci et al. 2000).
The nebula extends across 9”7.5” or 8470 kpc2 (but see §3.1). It is characterized by a strongly peaked rounded morphology. Emission from the nebula is detected only within the radio structures. The faintest Ly emission we detect on the VIMOS image has surface brightness 10-17 erg s-1 cm-2 arcsec-2 (3 values).
The angle between the nebular axis and the radio structures was measured using the position angle on the sky of the longest dimension of the Ly nebula and the position angle of the line between the two brightest radio hot spots. The nebula is misaligned by 305o relative to the radio axis.
As we found for MRC 2104-242 (Villar-Martín et al. 2006), Ly emission is detected outside any plausible ionization cones with opening angle 90o (Barthel 1989). Seeing effects are not likely to be responsible for this Ly emission since the observations of this object were carried out under seeing conditions of FWHM 1.5. Since this is a broad line object, it is possible that the broad rounded morphology of the Ly nebula is due to orientation effects (see §5.3). If the ionization cone axis lies close to the line of sight, a broader, rounder morphology is expected.
The total Ly flux integrated over the nebula is 4.810-15 erg s-1 cm-2 corresponding to a luminosity of 3.41044 erg s-1.
CIV and HeII morphologies
The CIV and HeII images were created by adding the monochromatic images of the object within the spectral windows [5455-5485] Å and [5780-5800] Å respectively. Continuum images adjacent in wavelength to each line and of the same spectral width were subtracted to keep the line emission only.
The resulting images are shown in Fig. 2. The Ly contours have been overplotted on the top panels for comparison. The CIV line is spatially extended with a maximum projected size of 7.5. The outer, low surface brightness regions extend in the same direction as Ly. HeII, which is fainter, appears more rounded and compact, although it is spatially resolved with a maximum extension of 3.
The inner (2) regions of the CIV nebula seem to be extended along an axis (roughly E-W) which is shifted by 15 anti-clockwise relative to the axis defined by the outer regions and aligned within a few degrees with the radio structures. The HeII emission seems to be extended also in this direction. There is some hint that this could also be the case for the inner Ly nebula. However, higher spatial resolution data would be necessary to investigate whether there is a real rotation of the nebular axis as we move outwards, which could be a consequence of an inhomogeneous distribution of material.
Continuum is also detected, although the image is too noisy to characterize its morphology and determine its spatial centroid.
Spatially extended emission line spectroscopy
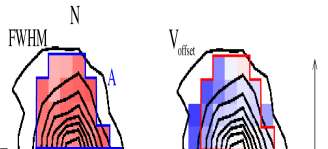
We show in Fig. 3 the spatial maps of the FWHM (corrected for instrumental profile) and velocity shift of the Ly line. These values have been measured fitting Gaussian profiles spaxel to spaxel. has been computed relative to the Ly emission at the spatial line centroid. The errors on the FWHM and are estimated to be, in general, 100 km s-1 and 40 km s-1 respectively.
Although the line profile is asymmetric at some spatial positions, this method allows a first order study of the spatial variation of the Ly spectral profile across the nebula. The line spectral profile shows strong spatial variations, as is obvious from Fig. 3.
The first striking characteristic is that Ly presents an increasing redshift towards the nebular centroid, with a maximum shift in velocity of 400 km s-1 at this position relative to the outer regions.
The FWHM varies between 450 and 1350 km s-1 across the nebula. Three distinct regions (, and in Fig. 3) can be isolated in the FWHM map according to the line width. The maximum values are measured in region (in the range 1050-1340 km s-1), which runs approximately along the radio axis and contains the nebular centroid. The HeII FWHM measured from the integrated spectrum is 600100 km s-1. Region shows narrower Ly, although the line is still quite broad (FWHM in the range 700-1030 km s-1) while the HeII FWHM is 650200 km s-1 in the integrated spectrum. At some positions HeII is as narrow as 45050 km s-1 (consistent with Villar-Martín et al. 2003). Ly trends to be notably broader than HeII (this was also found by Villar-Martín et al. 2003 along the radio axis).
Region is clearly different both in line width (FWHM(Ly)=65050 km s-1, Fig. 4, bottom) and velocity shift. This region shows the largest blueshift relative to the Ly centroid (35020 km s-1 for the integrated spectrum). CIV is detected in region , although noisy, and it has FWHM=600100 km s-1.
Ly absorption
We do not find definitive Ly absorption features in the VIMOS data across the nebula. This is consistent with previous studies (§3.1).
4.2 MRC 2025-218(z=2.63)
The Ly nebula
The VIMOS Ly+continuum image of MRC 2025-218 was created by adding the monochromatic images of the object within the [4385-4445] Å range. A continuum image extracted from an adjacent line-free region of the same spectral width was subtracted to keep the line emission only. The resulting Ly image is shown in Fig. 4, with the VLA 8.2GHz radio contours overlaid (Carilli et al. 1997; see also Fig. 5).
The Ly maximum extension is 6.0” or 55 kpc (but see §3.2), very similar to the radio source size . The faintest Ly emission we detect on the VIMOS image has surface brightness 1.510-17 erg s-1 cm-2 arcsec-2 (3 values). The maximum extension in the direction perpendicular to the radio structures as measured from the VIMOS data is 4. As McCarthy et al. (1990b) already pointed out, the nebula is aligned with the radio structures within a few degrees. The bimodal distribution described in §3.2 is clearly seen.
The total Ly flux integrated over the nebula is 2.110-15 erg s-1 cm-2 corresponding to a luminosity of 1.71044 erg s-1.
CIV and continuum morphologies
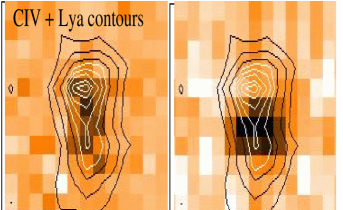
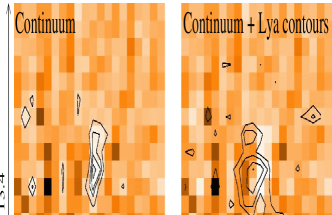
The CIV image (HeII is too faint) was created by adding the monochromatic images of the object within the spectral window [5610-5650] Å and subtracting the adjacent continuum. The continuum image of the object was created by integrating across the [5670-5850] Å spectral window.
The resulting images are shown in Fig.5. The Ly contours have been overplotted (top panels) for comparison.
CIV extends for 4 in the same direction as Ly (N-S). The bimodal distribution shown by Ly is distinguished in the CIV image. Interestingly, the continuum is spatially unresolved in this direction, but is barely resolved in the E-W direction, with a FWHM of 1.10.1, compared with FWHM=1.50.2 for the star in the field. The continuum centroid is located between the two Ly spatial components, i.e., where this line presents a minimum.
Spatially extended emission line spectroscopy
We show in Fig. 6 the spatial maps of the FWHM and velocity shift of the Ly line. As before, these values have been measured by fitting Gaussian profiles to the line spaxel by spaxel. has been computed relative to the Ly emission at the position of the continuum centroid. The errors on the FWHM and are estimated to be, in general, 100 km s-1 and 35 km s-1 respectively.
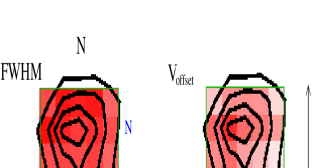
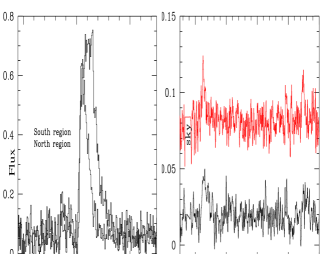
This analysis reveals two clearly distinct regions (north and south), which are different both in FWHM and . These are coincident with the two Ly spatial components discussed above. The continuum centroid (located between both regions) shows intermediate FWHM values. The Ly spectra extracted from the apertures and (north and south regions, Fig. 6) and the region in between (2 spaxels, see aperture in Fig. 6) are shown in Fig. 7 (left panels). Both regions emit also CIV and HeII (Fig.7, top-right panel). The CIV-HeII spectra (Fig. 7, top right panel) have been extracted using ony the highest flux spaxels in the N and S regions (5 and 4 spaxels respectively) in order to maximize the signal to noise ratio for the lines. The differences in FWHM and seen in Fig. 6 are obvious also here.
The region shows the narrowest Ly spectral profiles (FWHM in the range 500-650 km s-1) and the gas is blueshifted relative to the continuum centroid (values in the range -100 to -200 km s-1). CIV (which is a doublet and, therefore, expected to be intrinsically broader) and HeII are also rather narrow, with FWHM=65030 and 50030 km s-1 respectively, as measured from the spatially integrated spectrum.
The region is characterized by broader emission lines (FWHM in the range 850-1070 km s-1 for Ly) and the gas is redshifted relative to the continuum centroid ( in the range +50 to +250 km s-1). The CIV FWHM is 122040 km s-1. HeII is too noisy in the VIMOS spectrum to measure its FWHM. However, Keck long-slit spectroscopy (Humphrey 2004) of this region implies FWHM=1100100 km s-1. Therefore, the three lines in the N region are very broad compared with the S region.
Although absorption plays an important role in the Ly spectral differences across the nebula (see below), kinematics is also clearly having an effect, since the CIV and HeII lines show marked differences between the N and S regions.
The Ly and CIV spectra at the position of the continuum centroid are shown in Fig. 7 (bottom panels). Very broad wings (presumably from the BLR, see §3.2) are seen in the line profiles of both Ly and CIV.
Ly and CIV absorption
The Ly and CIV lines are clearly absorbed in this object (Fig. 7), as was already discussed by other authors (Villar-Martín et al. 1999). Since this paper is mostly focused on the properties of the emission line nebulae, we will present here a general description and defer a more detailed analysis of the absorbers for another publication (Humphrey et al. 2007, in prep).
Some peculiar properties of the Ly spectral profile are a consequence of absorption rather than kinematics: the multiple peaks, the fact that the flux drops below the continuum level at some wavelengths, the sharp, almost vertical edge of the blue wing of the line, and the identical wavelength over the nebula at which this sharp edge is measured (see below) are most naturally explained by absorption. Several absorption features are detected in both Ly and CIV (Fig. 7).
Ly absorption is detected in more than 30 spaxels. We set a lower limit to the size of the main absorber of 4.73.5 or 4332 kpc2. It is possible that this absorber covers the Ly nebula completely. Since absorption is detected in CIV as well, this implies that the absorbing gas is highly ionized.
A striking characteristic is that the sharp edge of the Ly blue wing (see Fig. 7) happens at almost exactly the same wavelength (4403.30.5 Å) in all spaxels where we have been able to measure it (20), revealing very little kinematic structure of the main absorber along the line of sight and accross its whole spatial extension.
4.3 MRC 0140-257 (z=2.64)
The Ly nebula
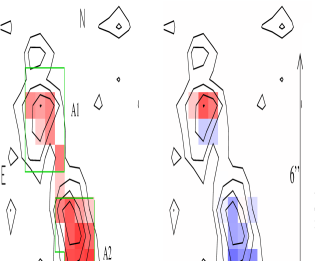
The VIMOS Ly+continuum image of MRC 0140-257 was created by adding the monochromatic images of the object within the [4410-4430] Å range. An adjacent continuum image was subtracted to keep the line emission only. The resulting Ly image is shown in Fig. 8 with the VLA 8.2GHz radio contours overlaid (Carilli et al. 1997).
Two main spatial components ( and in the figure) are identified in the image, which are aligned with the radio structures within a few degrees. We have assumed that the radio core is located between and (but see §2). The Ly spatial centroids of and are separated by 3.5 or 32 kpc. The maximum extension of the nebula ( and ) is 9 or 83 kpc. It, therefore, extends well beyond the radio structures. This conclusion is independent of the location of the radio core along the - line (§2). The faintest Ly emission we detect on the VIMOS data has surface brightness 10-17 erg s-1 cm-2 arcsec-2 (3 values).

The total Ly flux integrated over the nebula is 3.610-16 erg s-1 cm-2, which, taking aperture corrections into account, is consistent with McCarthy et al. (1991). It corresponds to a luminosity of 2.91043 erg s-1.
Continuum morphology
A continuum image was created by collapsing the data cube across the continuum spectral windows [5270-5550] Å and [5640-5800] Å, i.e. rest frame range [1450-1530] Å and [1555-1600] Å respectively. For comparison, the optical image of McCarthy, Persson & West (1992) was obtained using a Gunn-Thuan filter, covering the rest frame range [1675-1920].111The authors used a 2.5m telescope and an exposure time of 2700 sec to obtain this image.. We detect a faint source, which overlaps partially with component (Fig.9). Due to the large separation in wavelength between the continuum and Ly images, we cannot discard that the spatial shift between the continuum centroid and is partially artificial (see §2).
Although the source is apparently extended in the N-S direction, this is dubious. The faintest structures to the north are consistent within the errors with the image detection limit. On the other hand, there are noise residuals at similar flux levels at different positions accross the VIMOS field of view.
Spatially extended emission line spectroscopy
We show in Fig. 10 the spatial maps of the FWHM and of the Ly line. has been measured relative to the Ly emission between and . The erros on are estimated to be 40 km s-1. The errors on the FWHM are in the range 60-100 km s-1. The main reason for these large relative errors is the uncertainty on the continuum level, due to the noise (this object is fainter) and the presence of an underlying broad component (see below). The line is narrow, with FWHM500 km s-1 accross the whole nebula, compared with typical values of HzRG.

The Ly spectra integrated over the highest signal to noise spaxels of (16 spaxels) and (14 spaxels, see Fig. 10, green lines) are shown in Fig. 11 (right panels). In both spatial components, the Ly spectral profile is dominated by a strikingly narrow component, with FWHM=25050 and 120 km s-1 for and respectively. An underlying broad component seems to be also present in both components. 222Using a single Gaussian, as the fits used to produce Fig. 11 (left) the narrow peak is broadened because of the broad wings and the derived FWHM have values of up to 500 km s-1. This is most clearly detected when both spectra are added. The fit to the line profile in the coadded spectrum of and is shown in Fig. 12 together with the individual components isolated in the fit. The underlying broad component has FWHM=1200200 km s-1. The velocity shift between and is 12020 km s-1, which is also rather low compared with typical values in HzRG (e.g. McCarthy et al. 1996).
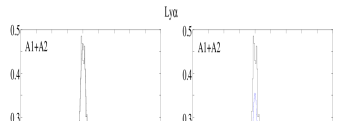
CIV and HeII are detected in (Fig. 11, left). Two very narrow emission lines are identified at the expected wavelengths of the CIV doublet. We have fitted the lines with no constraints applied. The resulting doublet consists of two emission lines separated by 8.01.0 Å (consistent within the errors with the theoretical 9.2 Å at the redshift of the object) and with flux ratio of 1.00.2, as expected in the optically thin case. Taking the errors into account, both lines are unresolved (observed FWHM=2.50.6 and 2.40.7 Å respectively), with FWHM100 km s-1. This is in excellent agreement with the width of the Ly narrow component. HeII is also detected and is similarly narrow with FWHM=18060 km s-1.
The small FWHM values of the CIV and HeII lines confirm that Ly is intrinsically very narrow (rather than absorbed).
Ly absorption
The Ly spectral profile does not show clear evidence for absorption. This is further supported by the large Ly ratios. In Ly/HeII and Ly/CIV are 14.01.5 and 7.41 respectively. These values are consistent with standard photoionization model predictions for the measured CIV/HeII=1.80.3 (Villar-Martín et al. 2007). Ly/HeII and Ly/CIV are 6 and 5 respectively for and it is not possible to say whether Ly is absorbed. The values for the integrated spectrum are 15 and 92 respectively which for the measured CIV/HeII1.5 do not imply absorption either. This is in contradiction with Eales & Rawlings (1996) (see §3.3).
5 Discussion
5.1 Main properties of the Ly nebulae
The three radio galaxies investigated here are associated with giant (60 kpc) Ly nebulae. This was already known for MRC 1558-003 and MRC 2025-218, but not for MRC 0140-257. The total Ly luminosities are (0.3-3.4)1044 erg s-1, within the range of typical values measured for HzRG.
The morphologies are varied. The nebula of one source has a centrally peaked, rounded appearance (MRC 1558-003). In the other two objects it consists of two spatial components. This bimodal morphology could be a consequence of an obscuring dust structure (e.g. Knopp & Chambers 1997, Reuland et al. 2003). For MRC 2025-218 this is supported by the fact that the continuum centroid coincides with a minimum in the Ly flux. Pentericci et al. (2001) also proposed the existence of a dust lane in MRC 0140-257 to explain the near infrared continuum morphology.
The alignment between the Ly nebulae and the radio structures is remarkable in MRC 2025-217 and MRC 0140-257 (10o). In MRC 1558-003, the nebula is misaligned by 305o. Similar values have been measured for other HzRG radio galaxies (McCarthy, Spinrad & van Breugel 1995).
Based on previous, deeper spectroscopic studies and this work, we conclude that, although the high surface brightness emission tends to be confined within the radio lobes, Ly emission is also detected beyond the radio structures in the three objects studied here (see also Villar-Martín et al. 2003 for other examples).
In one case (MRC 1558-003), the new data reveal Ly emission outside any plausible ionization cone and far from the radio structures (see Reuland et al. 2003, Villar-Martín et al. 2006 for other examples). Projection effects might be responsible, since this is a broad line object and this is our favoured explanation (see §5.3). Alternatively, part of the Ly emission might be resonantly scattered or powered by a mechanism not related to the active nucleus, such as young stars (Villar-Martín et al. 2007). Unfortunately, the data are not deep enough to check whether lines other than Ly are emitted in these regions. Cooling radiation (Haiman, Spaans & Quataert 2000) is an interesting possibility often discussed in the subject of radio quiet (e.g. Nilsson et al. 2006) and radio loud Ly nebulae. However, the Ly surface brightness we measure in regions outside the reach of the ionization cones (10-17 erg s-1 cm-2 arcsec-2) is too high compared with the model predictions (see Villar-Martín et al. 2003 for a more detailed discussion on this issue; see also Dijkstra, Haiman & Spaans 2006).
5.2 Interactions between the gas and the radio structures
Interactions between the radio structures (jet and radio lobes) and the ambient gas are known to have a profound impact on the kinematic properties of the giant nebulae associated with many HzRG (§1).
For the three objects studied here, this is obvious only in MRC 2025-218, in the northern region in particular, where the emission lines, Ly, HeII and CIV have FWHM1000 km s-1 (§4.2). No evidence for interactions is found in the southern region, where the radio structures present a sharp bend (see Fig. 4). If this has been caused by the collision of the radio structures with a dense gaseous region333Since this is a broad line object, projection effects might exaggerate the angle of the observed bend of the radio structures, no clear signature has remained in the gas kinematic properties.
Ly is also very broad across the MRC 1558-003 nebula. However, FWHM1000 km s-1 values are measured also in distant regions from the radio structures. Since moreover HeII is relatively narrow (450-650 km s-1 across the nebula, see also Villar-Martín et al. 2003), we cannot discard that resonance scattering effects are responsible for broadening the Ly spectral profile.
In MRC 0140-257 the nebular emission is dominated by quiescent gas (§4.3), i.e., not perturbed by the radio structures. We cannot tell whether the faint Ly underlying broad component (FWHM=1200200 km s-1) is a consequence of radio/gas interactions or resonance scattering effects. In fact, the most interesting result for this object is the strikingly quiescent kinematics revealed by the bulk of the emission lines across the nebula (FWHM300 km s-1 and 120 km s-1). This characteristic is unique among HzRG. Similar relaxed kinematics is rather extreme also among low radio galaxies, since only a few show such narrow line widths, usually measured in extranuclear regions (e.g. Baum, Heckman & van Breugel 1990).
5.3 Are the nebulae infalling?
Humphrey et al. (2007) proposed that the extended quiescent ionized nebulae associated with numerous powerful radio galaxies at different redshifts are in the process of infall. These authors searched for correlations between several radio and optical/UV asymmetries, and found that (i) the quiescent ionized gas has its highest redshift on the side of the nucleus with the brightest and more polarized radio hotspot, and that (ii) on the side where the Lya emission is brightest relative to the other emission lines and continuum. They concluded that orientation effects, with the quiescent gas in infall towards the nucleus, is the most natural scenario for explaining these correlations.
Our study of MRC 2104-242 based on integral field VIMOS data also suggested that the giant quiescent Ly nebula associated with this object could be in the process of infall (Villar-Martín et al. 2006). However, due to the uncertainty on the spatial gas distribution, a rotational pattern could not be discarded. It was our later work (Humphrey et al. 2007) on a larger sample what allowed us to discard rotation and favour the infall interpretation.
We investigate next whether the morphological and kinematic properties of the nebulae studied here are consistent with infall.
MRC 1558-003

According to Humphrey et al. (2007) the giant nebula associated with MRC 1558-003 is infalling towards the center. Here we describe an infall model that can explain the observations quite well. An AGN sits in the center of a halo of mass . A dusty torus surrounding the AGN causes it to photoionize a biconical region of the surrounding gas. The opening angle of each cone is assumed to be . The cone axis is not perfectly aligned with the line-of-sight (L.O.S), but intersects it at an angle of . Furthermore, the cones are rotated by counterclockwise on the sky. In this scenario, one cone is pointing almost directly at the observer, while the other points in the opposite direction. Photoionization and subsequent recombination in the cones converts ionizing radiation emitted by the AGN into Ly, and thus results in spatially extended fluorescent Ly emission (Haiman & Rees, 2001). In this picture, infalling gas in the nearest cone will be emitted with a redshift relative to the systemic redshift.
We found that a model in which the gas density increases as , and the gas velocity increases can reproduce most observed properties of the nebula (Fig. 13). In order to match the observations, it is crucial that the emission from the furthest cone is not observed (see below). For a more detailed description of the model, the reader is referred to Appendix A. According to Fig. 13, our infall model produces the following features:
-
•
A rounded and centrally peaked morphology (left panel). This is a consequence of the geometry of our model and the increase of the recombination rate (and thus of fluorescent Ly emission) towards the AGN. The innermost contour level in Fig. 13 encloses a surface brightness that is times higher than that surrounded by the outermost contour. These properties are similar to those observed (Fig. 2), within a similar nebular size. In order to obtain a more symmetric appearance, as shown by the data, the axis cone should be closer to the line of sight. This would correspond to a quasar. The fact that the AGN continuum and broad line emission are detected at rest frame optical wavelengths, but are not obvious in the UV rest frame could be explained by the existence of dust obscuring the central regions.
-
•
The largest redshift is observed at the Ly centroid (central panel), as observed in the data (Fig. 3, right). Because the infall velocity increases towards the AGN, the redshift of the Ly line decreases outwards. Labels in the figure denote the mean velocity shift of the emission line in km s-1 with respect to he centroid, i.e., the position of maximum Ly flux. These values are consistent with the measured velocity offsets.
-
•
The nebular centroid has the largest redshift w.r.t the systemic redshift. It is not possible to determine the systemic redshift in this object. However, it is interesting to note that in MRC 1558-003 Ly is redshifted relative to the main rest-frame UV emission lines (CIV, HeII, CIII]) both in the spatially integrated spectrum (Röttgering et al. 1997) and at different spatial positions (Villar-Martín et al. 2003). In our scenario, the Ly emission from the far cone is negligible. The other emission lines might also be fainter from the more distant cone because of extinction, but these effect would be less pronounced, since they are not affected by resonance scattering effects (see also Humphrey et al. 2007). As a result, the relative contribution from the far cone to the flux of these lines is larger than for Ly both in the integrated spectrum and at different projected spatial positions. Since the emission from the more distant cone must be blueshifted relative to the near cone because of the infall pattern, the lines will be blueshifted relative to Ly, which is consistent with the observations.
To reproduce these two last features, the Ly emission detected from the furthest cone must be negligible as the expected blueshift of these photons would eliminate the predicted increase of the Ly redshift towards the nebular centroid and the blueshift relative to other emission lines. Although radiation blueward of the rest-frame Ly frequency is subject to absorption in the IGM, the IGM at is not opaque enough to completely eliminate the flux from the far cone (we used the model of Dijkstra et al. 2007 to calculate the impact of the IGM on the Ly line). Alternatively, the flux from the far side could be eliminated by a neutral and dusty spatially extended structure that lies between the two cones. Several studies suggest the existence of such structure (e.g. Humphrey et al. 2006, van Ojik et al. 1997).
Our model has greater difficulty reproducing the observed Ly FWHM (right panel, Fig. 13). Especially if purely radial infall is considered, the model produces a maximum FWHM of 500 km s-1, which is a factor of almost 3 short of what is observed for Ly. The model FWHM shown in Fig. 13 is boosted to km s-1 by convolving the spectrum at each pixel with a Gaussian with a standard deviation of km s-1 ( is the 1-D velocity dispersion of the halo). This reflects that the infall probably does not occur purely along radial paths. Although inconsistent with the Ly measurements, this model reproduces successfully the spatial variation of the HeII FWHM observed by (Villar-Martín et al. 2003) along the radio axis using long slit spectroscopic data. In this direction, the nebula shows broader FWHM750 km s-1 at the spatial centroid and 500 km s-1 in the outer parts (Villar-Martín et al. 2003), consistent with the models.
Resonant scattering of Ly photons has been ignored in our model because the gas within the cones is highly ionized and likely optically thin to Ly (see Appendix A). Although resonant scattering effects could explain the large Ly FWHM values, and its broader profile compared with HeII (§4.1), they would contradict other observational results. (2006) have performed radiative transfer calculations through neutral collapsing gas clouds and found that resonant scattering does not only broaden the Ly line, but that energy transfer from the infalling gas to the Ly photons shifts the line to bluer wavelengths. On the contrary, the observations suggest that the Ly line is redshifted with respect to other emission lines and probably relative to the system’s redshift. Neither does resonant scattering through optically thick, collapsing, gas clouds reproduce the observation that the Ly line is redshifted more towards the center. If resonant scattering does not occur, then it remains to be explained why Ly shows such large FWHM values and it is much broader than HeII.
An alternative mechanism that can broaden Ly relative to other emission lines and could produce a similar velocity pattern as that of infall is outflows (Dijkstra, Haiman & Spaans 2006). In this scenario, a shell propagates outwards from the center, which is thick enough to be self-shielding (with column densities of hydrogen of 1020 cm-2). All material is highly ionized, except inside the shell that is moving outwards. In this case, Ly photons basically bounce off the shell as if it were a mirror, scattering back and forth between the two expanding mirrors until they have been Doppler boosted far enough for them to be able to simply propagate through the shell (each time a Lya photon scatters off the shell, it picks up a Doppler shift from the shell). This process will broaden Ly, not affecting the other emission lines. Detailed modeling would be necessary to test whether outflows can reproduce all other observed properties of the nebula as infall does. However, since outflows cannot explain the radio/optical asymmetries seen in MRC 1558-003 (Humphrey et al. 2007), which on the other hand, are successfully explained with infall, here we will not explore the outflows scenario further.
In conclusion, our infall model can explain successfully the morphology, size, surface brightness distribution and the velocity field of the Ly nebula associated with MRC 1558-003. It can also explain why Ly is redshifted relative to other emission lines and the FWHM values of the non resonant HeII line. The infall scenario is also consistent with our previous results which imply that the quiescent nebulae in many HzRG (and MRC 1558-003 in particular) are infalling (Humphrey et al. 2007). On the other hand, this model fails to explain the large Ly FWHM values. A mechanism which might not be connected with the infall process could be responsible for the line broadening), while keeping the infall pattern and the HeII FWHM intact.
MRC 2025-218
It is not possible to investigate the kinematic pattern of the quiescent gas, since the data do not allow to isolate its emission in the NE component.
MRC 0140-257
It is not possible to disentangle how the quiescent gas is moving in this object. The relaxed kinematics is not suggestive of outflows.
MRC 0140-257 does not follow the trend found by Humphrey et al. (2007) in powerful radio galaxies at different , such that the quiescent gas has the highest redshift at the side of the brightest and more polarized radio hot spot. The authors interpret these results as evidence for infall. On the contrary, the highest redshift in MRC 0140-257 is measured in , at the side of the fainter (northern) radio hotspot.
This discrepancy could be due to three different reasons: (i) the orientation diagnostics based on the radio properties is not valid (ii) the gas is not in infall (iii) our radio-optical registration (§2) is incorrect. If the radio core was located on or (rather than between the two Ly components), we would have no information on the redshift on one side of the nucleus.
The interpretation of infall by Humphrey et al. (2007) is based on the fact that the radio asymmetries in their sample provide a powerful diagnostic tool to constrain the orientation of the radio source (and the Ly nebula as a consequence). One possible explanation for the MRC 0140-257 discrepancy is that in this particular case the radio properties are not reliable indicators of the object orientation. This is actually suggested by the fact that the brightest (southern) hot spot shows the lowest polarization (Carilli et al. 1997), contrary to what we would expect if both flux and polarization asymmetries where mostly determined by orientation.
The orientation diagnostics based on the radio properties would fail, for instance, when the radio axis is very close to the plane of the sky. For MRC 0140-257, on the contrary, the detection of a radio core (Carilli et al. 1997) rather suggests that the angle between the radio axis and the plane of the sky is not negligible.
The diagnostics would also fail if the radio asymmetries are a consequence of environmental effects (e.g. McCarthy, van Breugel & Kapahi 1991), rather than orientation. This is possibly the case in MRC 0140-257. On one hand, the brightest, less polarized hotspot is closest to the nucleus, and the Ly emission on that side of the nucleus (adopting our present radio-optical registration) is also brightest. This is what we expect from McCarthy, van Breugel & Kapahi (1991) environmental scenario. On the other hand, the southern (brighter) radio structure consists of two radio hot spots (Fig.8). If this is due to a interactions with the gas (e.g. Carilli et al. 1997), this process would enhance the radio emission and the higher brightness of the southern radio structure would therefore be a consequence of environmental effects.
Alternatively, it is possible that the Ly nebula is not infalling towards the center. and could be two objects rotating around a common center of mass (e.g. De Breuck et al. 2005). If this is located between and , we estimate a dynamical mass of 3 M⊙ for a radius =16 kpc and a projected rotation velocity of 60 km s-1 (i.e. half of the value between and ). This mass value is at least a factor of 100 smaller than the stellar masses inferred for other HzRG (Seymour et al. 2007, Villar-Martín et al. 2006) or for massive, early-type galaxies at 2 in deep, IR surveys (e.g. Daddi et al. 2004). MRC 0140-257 could be an unusually small mass HzRG, a possibility that is also suggested by the small FWHM values measured in and . It would be essential to obtain rest frame H and K magnitudes (e.g. Seymour et al. 2007, Villar-Martín et al. 2006) to make a proper estimation of the stellar mass.
If, on the contrary, this is progenitor of a massive elliptical galaxy, as one expects for a powerful HzRG (e.g. McLure et al. 1999), the rotation plane of and must almost coincide with the plane of the sky.
5.4 Ly absorption
Ly absorption has definitively been detected in MRC 2025-218, spatially extended for 4332 kpc2. The absorber could therefore be larger in size than the optical size of the host (if already formed) underlying galaxy. CIV is also absorbed and, thus, the absorbing gas is highly ionized. As in this object, very little kinematic structure along the line of sight was also found by Wilman et al. (2005) across the giant Ly radio quiet nebula LAB-2 discovered by Steidel et al. (2000). A more detailed analysis of the absorbers associated with MRC 2025-218 will be presented in Humphrey et al. (2007, in prep.).
6 Summary and conclusions
The morphological and spectroscopic properties of the giant (60 kpc) Ly nebulae associated with three radio galaxies (MRC 1558-003, MRC 2025-218 and MRC 0140-217) at 2.5 have been investigated using VIMOS integral field spectroscopic data on VLT. The three objects are associated with giant (60 kpc) Ly nebulae. This was already known for MRC 1558-003 and MRC 2025-218, but not for MRC 0140-257.
The morphologies are varied. In one source the nebula has a centrally peaked, rounded appearance (MRC 1558-003), while in two objects it consists of two spatial components (MRC 2025-218, MRC 0140-257). The total Ly luminosities are in the range (0.3-3.4)1044 erg s-1.
The Ly spectral profile shows strong variation through the nebulae, with FWHM values in the range 400-1500 km s-1 and velocity shifts 120-600 km s-1. Kinematic disturbance induced by the radio structures plays a clear important role in MRC 2025-218.
Most spectroscopic and morphological properties of the giant nebula associated with MRC 1558-003 are successfully explained by a scenario such that the giant nebula is collapsing towards the center in the potential well of a 51012 M⊙ halo. This is consistent with our previous conclusion that the giant nebulae associated with this and other HzRG are in infall (Humphrey et al. 2007). On the other hand, this model has problems to reproduce the large Ly FWHM values (1000 km s-1), which might be a consequence of a mechanism unrelated to the infall process.
We have discovered a giant (75 kpc) Ly nebulae associated with a radio galaxy at 2.64. It is very closely aligned with the radio axis and it extends well beyond the radio structures. It is characterized by a strikingly relaxed kinematics (FWHM300 km s-1 and 120 km s-1), unique among HzRG. This object might have an unusually small dynamical mass (3109 M⊙) for a HzRG, although this needs further investigation with other type of data.
Ly absorption is definitively detected in MRC 2025-218. The absorbing screen has a spatial extension of 4332 kpc2 at least. It is highly ionized (CIV is also absorbed) and shows a remarkable velocity coherence (100 km s-1) across its spatial extension.
Acknowledgments
Thanks to an anonymous referee for useful comments on the paper. We thank Chris Carilli and Laura Pentericci for providing the radio maps presented in this paper. The work of MV-M and RGD has been supported by the Spanish Ministerio de Educación y Ciencia and the Junta de Andalucía through the grants AYA2004-02703 and TIC-114. SFS thanks the Spanish Plan Nacional de Astronomía, program AYA2005-09413-C02-02 (MEC) and the Plan Andaluz de Investigación of Junta de Andalucía, research group FQM322. AH acknowledges support from a UNAM postdoctoral research fellowship. Thanks to Joel Vernet for producing figures 3 and 8.
References
- Barthel (1989) Barthel P., 1989, ApJ, 336, 606
- Baum, Heckman & van Breugel ( 1990) Baum S., Heckman T., van Breugel W., 1990, ApJS, 74, 389
- Carilli et al. (1997) Carilli C., Röttgering H., van Ojik R., Miley G., van Breugel W., 1997, ApJSS, 109, 1
- Daddi et al. (2004) Daddi E. et al. 2004, ApJ, 600L, 127
- De Breuck et al. ( 2005) De Breuck C., Downes D., Neri R., van Breugel W., Reuland M., Omont A., Ivison R., 2005, A&AL,430L,1
- (6) Dijkstra M., Haiman Z., Spaans M., 2006, ApJ, 649, 14
- Dijkstra et al. (2007) Dijkstra, M., Lidz, A., Wyithe, S, MNRAS, 2007, in press (astro-ph/0701667)
- (8) Eales S., Rawlings S., Dickinson M., Spinrad H., Hill G., Lacy M., 1993, ApJ, 409, 578
- Eales & Rawlings (1996) Eales S., Rawlings S., 1996, ApJ, 460, 68
- Haiman & Rees (2001) Haiman Z., Rees M. J. 2001, ApJ, 556, 87
- Haiman, Spaans & Quataert (2000) Haiman Z., Spaans M., Quataert E., 2000, ApJL, 537, 5
- Humphrey ( 2004) Humphrey A., 2004, PhD Thesis, Univ. of Hertfordshire
- Humphrey et al. (2006) Humphrey A., Villar-Martín M., Fosbury R. Vernet J., di Serego Alighieri S., 2006, MNRAS, 369, 1103
- Humphrey et al. (2007) Humphrey A., Villar-Martín M., Fosbury R. Vernet J., di Serego Alighieri S., 2007, MNRAS, 375, 705
- Knopp & Chambers (1997) Knopp G., Chambers K., 1997, ApJS, 109, 367
- Kurk et al. (2002) Kurk J., Pentericci L., Röttgering H, Miley G., 2002, Revista Mexicana de Astronomía y Astrofísica (Serie de Conferencias), Vol. 13, pp. 191-195
- Large et al. (1981) Large M., Mills B., Little A., Crawford D., Sutton J., 1981, MNRAS, 194, 693
- Larkin et al. (2000) Larkin J. et al. 2000, ApJL, 533, 61
- Le Févre et al. (2003) Le Févre O. et al., 2003, Proc. of the SPIE, 4841, p. 1670, Masanori & Moorwood Eds.
- Maxfield et al. (2002) Maxfield L., Spinrad H., Stern D., Dey A., Dickinson M., 2002, AJ, 123, 2321
- McCarthy et al. (1990a) McCarthy P.J., Spinrad H., Dickinson M., van Breugel W., Liebert J., Djorgovski S., Eisenhardt P., 1990a, ApJ, 365, 487
- McCarthy et al. (1990b) McCarthy P.J., Kapahi V., van Breugel W., Subrahmanya, C., 1990b, AJ, 100, 1014
- McCarthy et al. (1991) McCarthy P.J., van Breugel W., Kapahi V., Subrahmanya, C., 1991, AJ, 102, 522
- McCarthy, van Breugel & Kapahi (1991) McCarthy P.J., van Breugel W., Kapahi V., 1991, ApJ, 371, 478
- McCarthy, Person & West (1992) McCarthy P., Persson S. & West S., 1992, ApJ, 382, 52
- McCarthy (1993) McCarthy P., 1993, ARA&A, 31, 639
- McCarthy et al. (1995) McCarthy P.J., Spinrad H., van Breugel W., 1995, ApJSS, 99, 27
- McCarthy et al. (1996) McCarthy P. Baum S., Spinrad H., 1996, ApJS, 106, 281
- McLure et al. (1999) McLure R., Kukula M., Dunlop J., Baum S., O’Dea C., Hughes D., 1999, MNRAS, 308, 377
- Nilsson et al. (2006) Nilsson K., Fynbo J., Möller P., Sommer-Larsen J., Ledoux C., 2006, A&AL, 452, 23
- Pentericci et al. (1999) Pentericci L., Röttgering H., Miley G., McCarthy P., Spinrad H., van Breugel W., Macchetto F., 1999, A&A, 341, 329
- Pentericci et al. (2000) Pentericci L., Van Reeven W., Carilli C., Röttgering H., Miley G., 2000, A&AS, 145, 121
- Pentericci et al. (2001) Pentericci L., McCarthy P., Röttgering H., Miley G.,van Breugel W., Fosbury R., 2001, ApJSS, 135, 63
- Reuland et al. (2003) Reuland M. et al., 2003, ApJ, 592, 755
- Reuland et al. (2007) Reuland M. et al., 2007, AJ, in press (astro-ph/0702753)
- Röttgering et al. (1997) Röttgering H., van Ojik, R., Miley G., Chambers K., van Breugel W., de Koff S., 1997, A&A, 326, 505
- Sánchez (2004) Sánchez S.F., 2004, AN, 325, 167
- Sánchez (2006) Sánchez S.F., 2006, AN, 327, 850
- Sandage et al. (2006) Sandage A., Tamman G., Saha A., Reindl B., Macchetto F., Panagia N., 2006, ApJ, 653, 843
- Seymour et al. (2007) Seymour N., Stern D., De Breuck D., Vernet J., Rettura A., Dickinson M., Dey A., Eisenhardt P. et al., 2007, ApJS, in press (astro-ph/0703224)
- Steidel et al. (2000) Steidel C., Adelberer K., Shapley A., Pettini M., Dickinson M., Giavalisco M., 2000, ApJ, 532, 170
- Tadhunter et al. (1989) Tadhunter C., Fosbury R., Quinn P., 1989, MNRAS, 240, 225
- van Ojik et al. (1996) Van Ojik R., Röttgering H., Carilli C., Miley G., Bremer M., Macchetto F., 1996, A&A, 313, 25
- van Ojik et al. (1997) Van Ojik R., Röttgering H., Miley G., Hunstead R., 1997, A&A, 317, 358
- Vernet et al. (2001) Vernet J., Fosbury R., Villar-Martín M., Cohen M., Cimatti A., di Serego Alighieri, Goodrich R., 2001, A&A, 366, 7
- Villar-Martín et al. (1999) Villar-Martín M., Fosbury R., Binette L., Tadhunter C., Rocca-Volmerange B., 1999, MNRAS, 351, 47
- Villar-Martín et al. (2003) Villar-Martín M., Vernet J., di Serego Alighieri S., Fosbury R., Humphrey A., Pentericci L., 2003, MNRAS, 346, 273
- Villar-Martín et al. (2006) Villar-Martín M. et al. 2006, MNRAS, 359, 5
- Villar-Martín et al. (2007) Villar-Martín M., Humphrey A. De Breuck C., Fosbury R., Binette L., Vernet J., 2007, MNRAS, 375, 1299
- Wilman et al. (2005) Wilman R., Gerssen J., Bower R., Morris R., Bacon R., de Zeeuw P., Davies R., 2005, Nature, 436, 227
Appendix A Infall Model of MRC 1558-003
For each position the spectrum was obtained by adding the emission from each cell inside the cone along that line of sight (L.O.S). The emissivity for a cell was calculated by assuming photoionization equilibrium. This implies the volume emissivity at radius scales as , where is the number density of hydrogen nuclei at radius , and we used that the gas is (almost) fully ionized.
In the frame of the cell (which itself is falling toward the center), the Ly line is broadened by thermal motions of the atoms in the gas, which results in a Voigt profile. The bulk motions of the cell then cause a Doppler shift of the Ly line. The total spectrum at on the sky, denoted by , is obtained by adding the contributions from all cells. To be more precise, the spectrum at is given by
| (1) |
where if the cell is inside the cone, and otherwise . Furthermore, is the Voigt function444The Voigt function is given by , where . Here is the Einstein A-coefficient for the transition, is the thermal velocity of the hydrogen atoms in the gas, given by , where is the Boltzmann constant, the gas temperature, and the proton mass..
The gas density and velocity profiles were assumed to be of the forms , . The infall velocity was assumed to be equal to the circular velocity of the halo at the virial radius To prevent both fields from diverging, both and were kept constant at radii less than times the virial radius (which corresponds to kpc). These fields were chosen to give the best agreement with the observations. Note that these parameters were chosen to produce a good fit to the observations. To enhance the FWHM at each location were convolved with a Gaussian of width km s-1.
Equation 1 is valid in the limit where the cloud is transparent to all Ly photons. In our model the Ly from the furthest cone is not observed and we only need to consider Ly emission from the nearest cone. For these photons we find that the optically-thin approximation is very reasonable: all Ly photons are emitted in the cone where the gas is highly ionized. For the cone orientation of our model, each Ly photon never leaves the cone on its way to the observer. The total optical depth for a given Ly photon is reduced even further by velocity gradients along a L.O.S. Since all these photons are emitted predominantly redward of the Ly resonance, scattering in the IGM is not important.