The dependence of the estimated luminosities of ULX on spectral models
Abstract
Data from Chandra observations of thirty nearby galaxies were analyzed and 365 X-ray point sources were chosen whose spectra were not contaminated by excessive diffuse emission and not affected by photon pile up. The spectra of these sources were fitted using two spectral models (an absorbed power-law and a disk blackbody) to ascertain the dependence of estimated parameters on the spectral model used. It was found that the cumulative luminosity function depends on the choice of the spectral model, especially for luminosities ergs/s. In accordance with previous results, a large number () of the sources have luminosities ergs/s (Ultra-Luminous X-ray sources) with indistinguishable average spectral parameters (inner disk temperature keV and/or photon index ) with those of the lower luminosities ones. After considering foreground stars and known background AGN, we identify four sources whose minimum luminosity exceed ergs/s, and call them Extremely Luminous X-ray sources (ELX). The spectra of these sources are in general better represented by the disk black body model than the power-law one. These ELX can be grouped into two distinct spectral classes. Two of them have an inner disk temperature of keV and hence are called “supersoft” ELX, while the other two have temperatures keV and are called “hard” ELX. The estimated inner disk temperatures of the supersoft ELX are compatible with the hypothesis that they harbor intermediate size black holes, which are accreting at times their Eddington Luminosity. The radiative mechanism for hard ELX, seems to be Inverse Comptonization, which in contrast to standard black holes systems, is probably saturated. Extensive variability analysis of these ELX, will be able to distinguish whether these two spectral class represent different systems or they are spectral states of the same kind of source.
Subject headings:
Galaxies: general - X-rays: binaries1. Introduction
In the last few years, Chandra observations of nearby galaxies have detected many non-nuclear X-ray point sources (Kaaret et al., 2001; Matsumoto et al., 2001; Zezas & Fabbiano, 2002), some of which have isotropic luminosities ergs/s and are called Ultra luminous X-ray Sources (ULX). While some of these ULX are supernova remnants (e.g. Ryder et al., 1993; Fox et al., 2000), it is believed that the majority of them are compact accreting systems. Indeed, ASCA X-ray spectral studies of many ULX have revealed that they display the characteristics of accreting black holes (Makishima et al., 2000; Mizuno et al., 2001). ULX have also been called Super-Eddington Sources (Fabbiano, 1989, 2004) and Intermediate luminosity X-ray objects (Roberts & Warwick, 2000; Colbert & Mushotzky, 1999).
Since these ULX sources emit radiation at a rate larger than the Eddington luminosity for a ten-solar mass black hole, they are believed to harbor a black hole of mass (Colbert & Mushotzky, 1999; Makishima et al., 2000) where the upper limit is constrained by the fact that a more massive black hole would have settled into the nucleus due to dynamical friction (Kaaret et al., 2001). Black holes in this mass range are called Intermediate Mass Black Holes (IMBH), since they seem to represent the missing component of the black hole mass spectrum with masses prevailing in the gap between those of stellar mass black holes found in Galactic X-ray binaries and those associated with Active Galactic Nuclei, (Richstone et al., 1998). Miller & Colbert (2004) and Miller (2005) review the present evidence for IMBH in ULX and Liu & Mirabel (2005) have compiled a catalogue of some ULX and properties.
Alternate models for ULX are that their luminosities are super-Eddington (Begelman, 2002) or that their emission is beamed from a geometrically thick accretion disk (King et al., 2001). However, it has been argued that in the latter case, such thick ”funnel” shaped disks enhance the observed flux by just a factor of few (Misra & Sriram, 2003). For all of these models, the creation of such sources (Portegies, Zwart & McMillian, 2002; Taniguchi et al., 2000; Madau & Rees, 2001) and process by which they sustain high accretion rates (King et al., 2001), are largely unknown.
Investigations on the nature of ULX have been undertaken by studying the spectra and variability of individual sources. For example analysis of the spectra of NGC 1313 X-1, X-2 (Miller et al., 2003) and M81 X-9 (Miller, Fabian & Miller, 2004), revealed the presence of a cool accretion disk component ( keV), suggesting that ULX indeed harbor IMBH. Transitions between two spectral states, similar to those seen in Galactic black hole systems, have been reported in NGC 1313 X-1(Colbert & Mushotzky, 1999) and two sources in IC342 (Kubota et al., 2001). Spectral transitions have also been reported in two sources in NGC 1313 (Feng & Kaaret, 2006).
The large collecting area of XMM-Newton, allows for detailed spectral fits to ULX, which often comprise of two components (Wang et al., 2004; Feng & Kaaret, 2005). However, Gonçalves & Soria (2006), have argued that such soft spectral components depend on the complexity of the fitting model. An interesting object is the brightest X-ray point source in M 82, whose intrinsic luminosity has been measured to be as high as 1.6 1041 ergs/s (Ptak and Griffiths, 1999). The detection of a mHz quasi-periodic oscillation in its X-ray light curve suggests that the source is a compact object and not a background AGN (Strohmayer & Mushotzky, 2003; Dewangan et al., 2006a). The spectra of this source can be fitted by a power-law with photon index, (Fiorito & Titarchuk, 2004), but is more consistently fitted with a flatter power-law with an high energy cutoff around keV, which can be interpreted as optically thick, saturated Comptonization (Agrawal & Misra, 2006). A quasi-periodic oscillation has also been discovered in the bright X-ray source of Holmberg IX, which is similar to the source in M82 in having a flat spectrum () with a keV cutoff (Dewangan et al., 2006b). Recently, Stobbart et al. (2006) found that the XMM-Newton spectra of eleven of the eighteen ULX studied by them, showed such high energy curvature. Chandra observations of NGC 5204 X-1, also reveals the presence of an optically thick Comptonized component (Roberts et al., 2006). While these results of individual ULX are intriguing, there does not seem to be any significantly distinguishable spectral property of ULX, and in general their spectra can be described either by steep or flat power-law indices, with and without soft components (e.g. Dewangan et al., 2005).
Another line of investigation is to construct the cumulative luminosity function and histograms of spectral parameters of a large sample of X-ray sources (e.g. Colbert & Ptak, 2002). The hope here is that, in case ULX are a distinct class of sources and/or they can be classified into distinct subgroups, the luminosity function should exhibit a break and their spectral parameters should show clustering. Swartz et al. (2004) analyzed data from 82 galaxies and estimated the luminosity function and spectral parameters of the X-ray point sources in these galaxies. They found that the average photon index (as well as the distribution) of the ULX and the less luminous sources is nearly same. Moreover, their spatial and variability distributions are also similar. While, their analysis revealed that the luminosity functions of ULX depend on the host galaxy type and star formation rate, they did not find any significant evidence for breaks in them.
As emphasized by Swartz et al. (2004), the power-law model they used to fit the data was chosen as an empirical one. They attempted to fit all the sources with the power-law model and only for those sources that did not provide a reasonable fit, they used other models like disk black body. They note that for many sources that are well fitted by the power-law model, other spectral models can also represent the spectra. In this work, we consider a smaller sample of 30 galaxies but fit the spectra of the points sources, with both a power-law and a disk blackbody model. In principle, the intrinsic (i.e. the absorption corrected) luminosity inferred for a source may be different for the two spectral models. Our first motivation here is to make a qualitative estimate of this difference by noting the dependency of the luminosity function on the spectral model used. A second motivation for this work is based on the expectation that estimations of a different spectral parameter like the inner disk temperature (as compared to the photon index), maybe better in distinguishing ULX from other sources or they may reveal dependencies (like correlations between luminosity and temperature) which could shed light on the nature of these sources. As mentioned earlier, the spectra of several ULX are complex requiring more than one components. Thus, the two spectral models, an absorbed power-law and and an absorbed disk blackbody, should be considered as empirical ones, which can adequately represent low count data and these models need not be the correct physical representation of the actual source spectrum.
It is clear that ULX are fairly common in nearby galaxies. For example, Swartz et al. (2004) identified 154 of them in 82 galaxies. If these sources are Eddington limited, then black holes may indeed be quite common. However, only a few of these sources have luminosities greater than ergs/s. It is these sources, (the best example being the bright source in M82 X-1), that require black hole with masses, . The development of a self-consistent theory which explains the process by which such black holes are created and undergo high accretion, is theoretically challenging. Hence, it is important to estimate the number of sources whose minimum intrinsic luminosity exceeds ergs/s. Here the minimum value of the luminosity should not only include the statistical spectral fitting error, but also the variations in the luminosity estimation that may occur upon using different viable spectral models. The third motivation of this work is to identify such sources which we call Extremely Luminous X-ray sources (ELX). To avoid possible ambiguities in determining the luminosity, we have chosen only those sources whose spectra are not contaminated by excessive diffuse emission and which are not affected by photon count pile up. Identification of such relatively “clean” systems would allow for more detailed studies of their properties to be undertaken and would be the first step toward understanding their nature.
A similar analysis has been undertaken recently by Winter et al. (2006) for thirty galaxies observed by XMM-Newton. Since their motivation was to check if ULX also exhibit soft and hard spectral states like black hole binaries, they limited their analysis to bright sources where detailed spectral analysis could be done. They found 16 sources as possible low-state ULX and 26 as high state ones. For the high state ULX, the observed range for the black body temperature was keV, with the more luminous sources having lower temperature. The Chandra analysis undertaken here, can be compared with this contemporary work and as we discuss later, the analysis are more or less consistent with each other. This consistency is important, since although the larger collecting area of XMM-Newton, allows for more complex spectral analysis, the higher angular resolution of Chandra ensures that a source spectrum is not contaminated by diffuse emission and flux from nearby sources.
2. Observations and Data Reduction
The names of the thirty host galaxies and the details of the Chandra ACIS observations are tabulated in Table 1. Distances to the galaxies were obtained from Swartz et al. (2004) and references therein. This sample of galaxies is a subset of those analyzed by Swartz et al. (2004). No particular criterion was imposed on the selection, since our motivation is limited to obtaining enough sources and not to study dependency on galaxy type.
| Galaxy | Distance (Mpc) | ObsID | N() | |
|---|---|---|---|---|
| NGC0253 | ||||
| NGC0628 | ||||
| NGC0891 | ||||
| NGC1291 | ||||
| NGC1316 | ||||
| NGC1399 | ||||
| NGC1569 | ||||
| NGC2403 | ||||
| NGC3034 | ||||
| NGC3079 | ||||
| NGC3379 | ||||
| NGC3556 | ||||
| NGC3628 | ||||
| NGC4125 | ||||
| NGC4365 | ||||
| NGC4374 | ||||
| NGC4449 | ||||
| NGC4485/90 | ||||
| NGC4559 | ||||
| NGC4579 | ||||
| NGC4594 | ||||
| NGC4631 | ||||
| NGC4649 | ||||
| NGC4697 | ||||
| NGC5055 | ||||
| NGC5128 | ||||
| NGC5194/5 | ||||
| NGC5457 | ||||
| NGC5775 | ||||
| NGC6946 |
Note. — ()the exposure time in ks; (N) the number of point sources with total counts from the source 60 as detected by wavdetect with fluxscale
The data reduction and analysis were done using CIAO3.2 and HEASOFT6.0.2. Using the CIAO source detection tool wavdetect, X-ray point sources were extracted from the level 2 event list. It was found that at least 60 counts are required to fit the spectral data with a two parameter model and hence only those sources with net counts were chosen for the spectral analysis. Choosing a lower threshold of counts resulted in a large number of sources for which spectral parameters could not be constrained. To avoid photon pile up effects, a conservative threshold of the count rate being counts/s was imposed which led to the rejection of fifteen sources which have been listed in Table 3 of the appendix. For some sources, typically near the nucleus, it was difficult to find nearby source free background regions and hence these sources were also not included in the analysis. Sources embedded in excessive diffuse emission (i.e. when the background flux was larger than counts/arcsec2 ) were also rejected. Typically, this amounted to considering only those sources for which the estimated background counts were less than . For each data set, observation-specific bad pixel lists were set in the ardlib parameter file. Using a combination of CIAO tools and calibration data, the source and background spectra were extracted.
These selection criteria makes the sample incomplete both in low and high luminosity ends. Thus the results obtained should not be used for quantitative analysis of the luminosity functions. The motivation here is evaluate dependency on spectral models and to identify sources which have high intrinsic luminosity. Thus, care has been taken to avoid possibly contaminated data, even if such criteria result in a loss of sources.
Spectral analysis was done using XSPEC version 12.2 and the data was fitted in the energy range 0.3-8.0 keV. All sources were fitted with two spectral models, the absorbed power-law and an absorbed disk blackbody. Absorption was taken into account using the XSPEC model phabs. Since the number of counts in each spectrum was typically low, the C-statistics was used for the analysis. Technically, the C-statistics is not appropriate for high counts and/or for background subtracted data. However, it was ascertained that the model parameters obtained either by C-statistics or statistics, were consistent with each other for high count rate sources. This is reassuring, because if the results depended on the statistics used, it would be imperative to use the correct statistics for high count sources (which need not be ) taking into account the correct (possibly non-Gaussian) error profiles.
An important problem, when fitting low count data with a two parameter (plus normalization) model, is the possibility of many local minima in the discerning statistic (in this case C-statistic) space. Hence, we take a cautious approach and do not fit the data using the XSPEC minimization routine. Instead we compute the C-statistic for a range of parameter values (using the XSPEC command steppar) and find the global minimum. Such a technique is numerically expensive, but it ensures that the global minimum has been found and the correct errors are obtained for the best fit parameters.
3. Results
The 365 sources considered in this analysis were classified into three categories, depending on whether the data was better fit by the disk black body model (23 sources) or the power-law one (67 sources) or both (275 sources). The criterion chosen to determine a better fit to the data was that C-statistic difference between the models should be larger than 2.7. If the difference was less, than both model fits were considered to equally represent the data. Although such a criterion is ad hoc (considering the uncertainties in the actual error statistics) and count rate dependent, it does serve as an qualitative guideline to differentiate between those systems which can be represented by a power-law emission and/or a black body one. The spectral parameters for all sources for the power-law and disk blackbody models are tabulated in Tables 4 and 5 of the appendix.
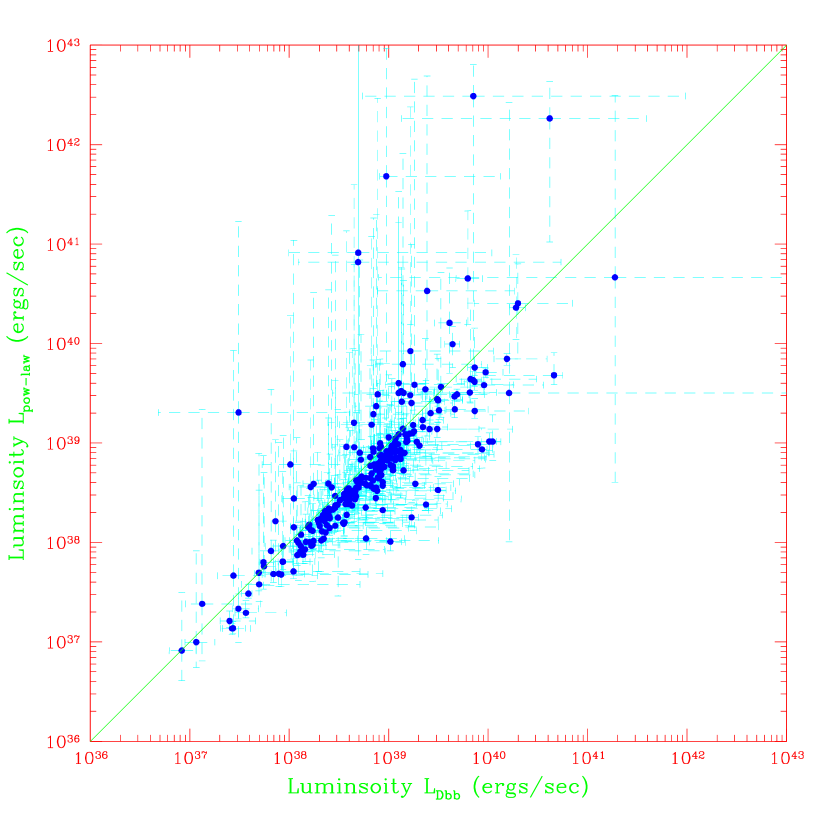
For ULX, the physically relevant parameter is the intrinsic bolometric luminosity which should be used to define and identify them. However, given the limitations of an instrument’s energy sensitivity range, the bolometric luminosity is spectral model dependent. For a power-law the bolometric luminosity cannot be estimated and only a lower limit can be obtained using the observed energy range. Since our motivation is to show how the bolometric luminosity is affected by the use of different spectral models, we have plotted in Figure 1, the bolometric luminosity for the disk black body model versus the lower limit to the luminosity using the power-law model. The figure represents only those sources which can be represented by both models. The figure shows that while for most sources the difference in luminosities is not substantial, there are sources with estimated luminosities erg/s, where the disk black body luminosity estimation is significantly smaller than the power-law one. This happens for sources for which the spectral index is large.
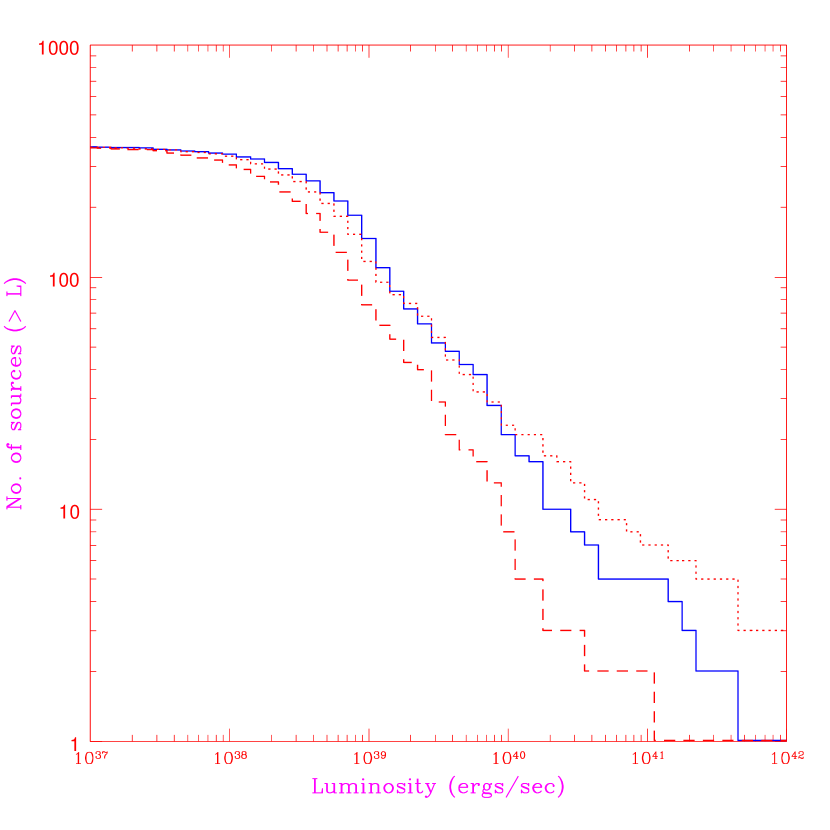
To show the dependence of the luminosity function on the fitting model, we compute the cumulative luminosity function in two ways. For the disk black body cumulative luminosity function (DBCLF), the luminosity obtained form fitting a black body is used, except for those sources that are fitted better with a power-law for which the power-law model estimated luminosity is considered. Similarly, for the power-law cumulative luminosity function, (PLCLF) the luminosity corresponds to the power-law fit, except for those sources which are better represented by a disk black body spectrum. In Figure 2, the solid line represents the DBCLF while the PLCLF is plotted as a dotted one. There are less number of sources with ergs/s for disk black body preferred representation. Moreover, there is a significant difference in the slope of the two luminosity function and the presence of a faint break at ergs/s for the PLCLF, is not evident in the DBCLF. Of particular interest is the number of sources whose minimum luminosity (i.e. the minimum of the two lower limits obtained by fitting the two spectral models) exceeds a certain value. In Figure 2, the dashed line represents such a minimum cumulative luminosity function, which reveals that there are eight sources with minimum luminosity greater ergs/s (ELX) and sources with minimum luminosity greater ergs/s (ULX).
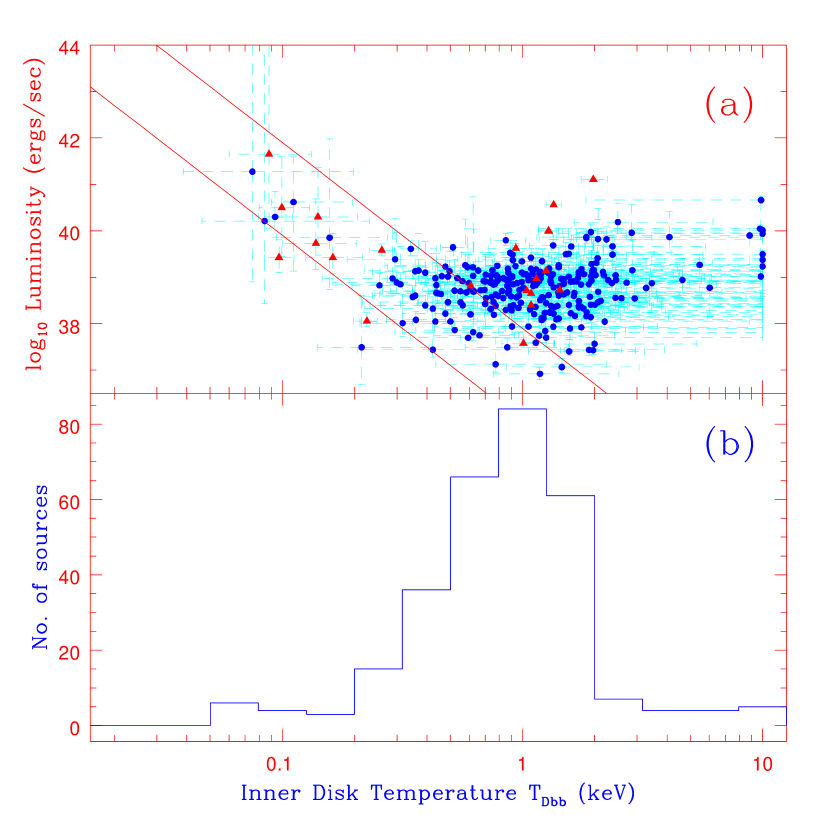
Figures 3 (a) shows the variation of the luminosity versus the disk black body temperature, While most of the sources have an inner disk temperature keV, as is evident from the distribution (Figure 3 b), there is a population of high luminosity source with low ( keV) temperature. Although the number of sources is low, there seems to be some evidence, that ELX (i.e. sources with luminosities ergs/s ) can be divided in two groups, a “super-soft” group with temperature less than keV and an harder group with temperature keV. Figure 3 may be compared with the results obtained by Winter et al. (2006) using XMM-Newton data for a different sample and selection criteria. They also find that sources with luminosities ergs/s have have a similar bimodal distribution in temperature as shown in Figure 3. This supports the hypothesis that ELX can be divided into two groups and this is not an artifact of sample selection bias.
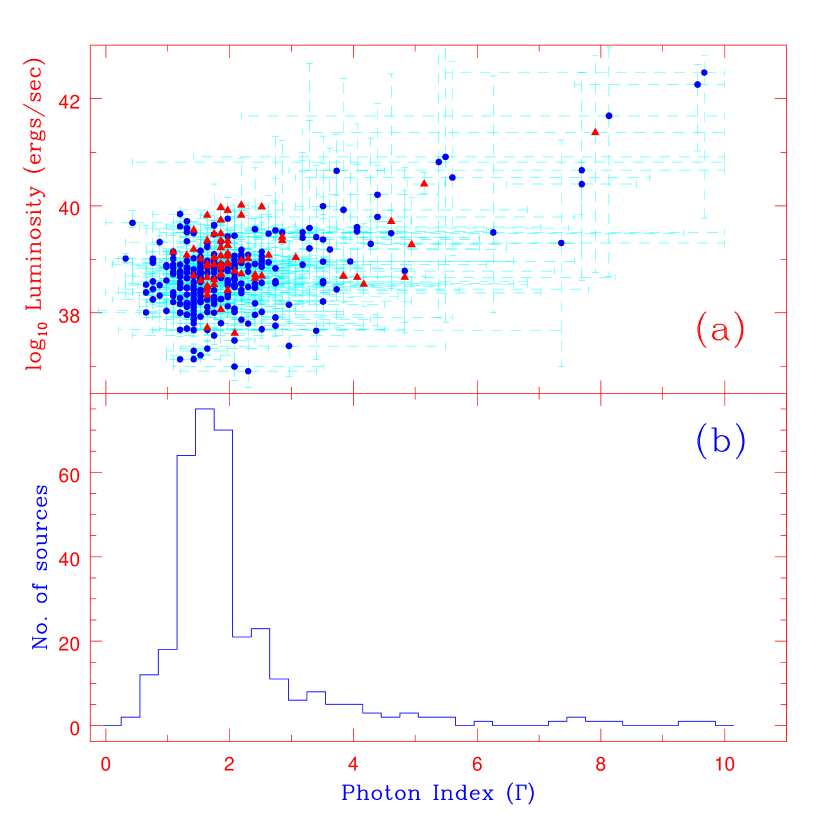
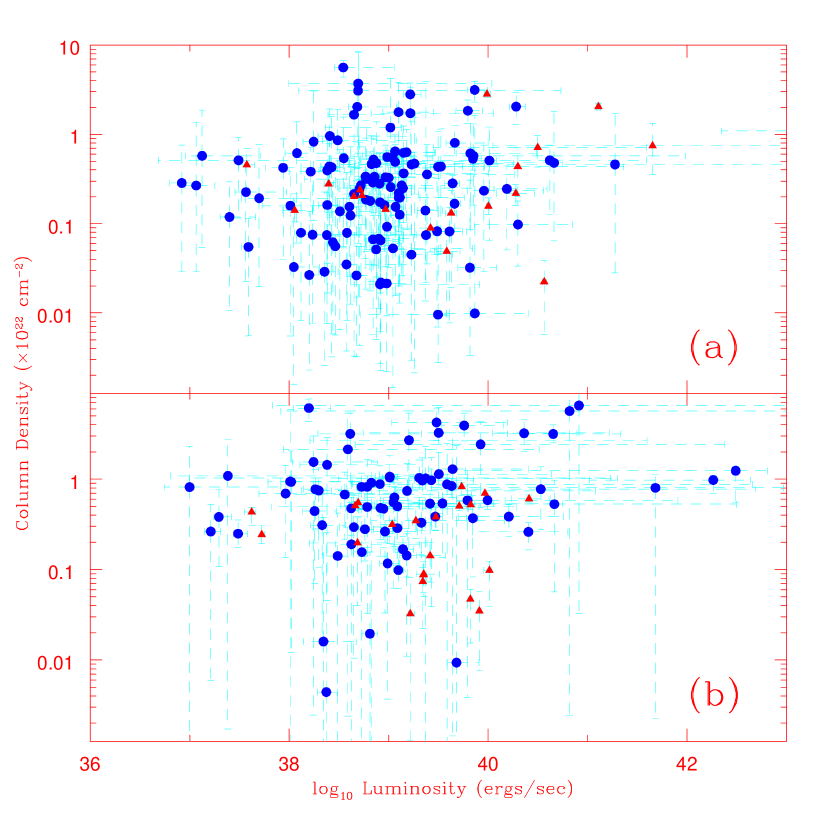
Figure 4 (a) shows the variation of luminosity with power-law photon index for those sources which can be fitted by a power-law model. There is a clear correlation between the two. This correlation does not seem to be due to overestimation of column density, since no such correlation is seen in the luminosity versus plot (Figure 5 b). Similar to the analysis using the disk black body model, there is a group of “super-soft” sources (i.e. photon spectral index ) which are also highly luminous ( ergs/s). The column density versus luminosity plots for both the power-law and disk black body models (Figure 5), reveal an absence of correlation, which is indicative that there may not be a bias in the analysis, i.e. the luminosities are not being over-estimated because of a overestimation.
In this analysis, there are eight sources which have an apparent minimum luminosity greater than ergs/s. However, two of these sources (NGC 5055, R.A: 13 15 30.18, Dec: +42 03 13.5 and NGC 4594, R.A: 12 39 45.22, Dec: -11 38 49.8) are foreground stars based on the optical images of the galaxies. Optical spectroscopy of a source in NGC 5775 ( R.A: 14 53 55.8, Dec: +3 33 28.02) reveals that it is a background AGN (Gutiérrez & López-Corredoira, 2005), while a source in NGC 1399 ( R.A: 14 53 55.8, Dec: +3 33 28.02) is a BLAGN (Green et al., 2004). The spectral properties of the other four sources, which we call Extremely Luminous sources (ELX) are tabulated in Table 2. The NGC 0628 source reported in Table 2, is a different source than the well studied ULX, CXOU J013651.1+154547. The luminosity of this highly variable source (Krauss et al., 2005) is ergs/s and its spectral properties are listed in Table 4. The source in NGC 6946 is a well known variable source (Liu & Mirabel, 2005) and has been called X7 with ergs/sec(Lira et al., 2000), IXO 85 (Colbert & Ptak, 2002) and source no. 56 (Holt et al., 2003). Although, the best fit parameters for C-statistics are shown, these results have been checked using statistics and by C-statistics fit for unbinned and background not subtracted data and it was found that the parameters values are consistent within errors and the errors on the estimated luminosities do not vary by more than a factor two. In general, these sources are better represented by disk black body emission than a power-law model, except for the source in NGC 6946, which however requires an exceptionally large power-law photon spectral index, (). The spectral properties of these bright sources suggest that they may be divided into two groups. The first group of four sources (Table 2), are represented by low inner disk temperatures ( keV), and hence may be called “supersoft” sources. In contrast the second group of three sources, have harder spectra with inner disk temperatures keV or with power-law photon index () and hence may be called hard sources. For this group, the spectra are marginally fitted better with a disk blackbody emission, although considering the uncertainties in the spectral fitting, a power-law representation may also be acceptable.
| galaxy | R.A. | Dec. | Counts | Bins | kTin (keV) | log | C-statDbb | log | C-statPow | |
|---|---|---|---|---|---|---|---|---|---|---|
| NGC0628 | 01 36 47.45 | +15 47 45.01 | ||||||||
| NGC6946 | 20 35 0.13 | +60 9 7.97 | ||||||||
| NGC4579 | 12 37 40.30 | +11 47 27.48 | ||||||||
| NGC5775 | 14 53 58.90 | + 3 32 16.78 |
Note. — Host Galaxy name; Right Ascension; Declination; Total counts; Number of energy bins after rebinning; Best fit inner disk temperature; Bolometric luminosity estimate using disk black body model; C-statistic for disk black body model; Photon index for the power-law model; Luminosity estimate (0.3-8.0 keV) using the power-law model; C-statistic for power-law model;
4. Summary and Discussion
Chandra observations of thirty galaxies were analyzed and the spectra of their points sources were fitted using both a power-law and a disk black body emission model. Only those sources were chosen, which were bright enough to allow a meaningful spectral fit, but whose data was not contaminated by excessive diffuse emission and/or effected by pile-up. It was found that the shape of the luminosity function especially at the high luminosity end, depends on the choice of the spectral model.
In accordance with earlier results, a large number of the sources ( ) have a luminosity which exceeds ergs/s and hence satisfy the standard definition of being Ultra Luminous X-ray sources (ULX) and do not seem to have any spectral distinction when compared with sources having lower luminosity. In this sample of 365 sources, there are four source which we refer to as Extremely luminous X-ray sources (ELX) since their luminosities were estimated to exceed ergs/s. These sources are in general better described by disk blackbody emission and can be distinctively grouped into two classes. This is consistent with the results of an independent analysis using XMM-Newton data (Winter et al., 2006). The members of the first class have soft spectra with best fit inner disk temperature keV, while for the other class the spectra is harder with inner disk temperature keV.
If disk black body emission is indeed the correct radiative process for the supersoft class then the inner disk temperature should correspond to the maximum color temperature of a disk, which can be estimated to be
| (1) |
where is the luminosity in ergs/s, is the color factor and is the Eddington luminosity. In Figure 3 (a), the two solid lines represent this relationship for and . Thus within the uncertainties, the supersoft sources are compatible with having pure black body disk emission, and have .
ELX which are members of the hard class have inner disk temperatures which are higher than that expected from a Eddington limited black body accretion disks. Hence, for these source the radiative mechanism is probably inverse Comptonization of soft photons. Detailed spectral analysis, which included XMM observations, of the bright X-ray source in M82 X-1 has revealed that its spectrum is better fitted by a saturated Comptonization model (Agrawal & Misra, 2006), which is also the case for the the bright X-ray source in Holmberg IX. Holmberg IX is not part of the sample studied here and M82 X-1 has been excluded because of pile-up effects and excess diffuse emission. Thus, these sources, with estimated luminosities erg/s, could also be members of the hard class of ELX. Thus it seems that like the the hard state of standard black hole binaries, the hard class ELX also have spectra which is due to thermal Comptonization, however unlike black hole binaries, in ELX the Comptonization seems to be saturated. Thus, it is tempting to draw by analogy, that the two spectral classes of ELX are actually two spectral states of the same kind of object. This can be verified if spectral transition between the two classes is observed.
With the identification of these ELX and other sources from the literature, it is now possible to undertake a more extensive study of their properties. Temporal variability of these sources will shed more light on the nature of these enigmatic sources.
References
- Agrawal & Misra (2006) Agrawal, V. K., & Misra, R. 2006, ApJ, 638, L83
- Begelman (2002) Begelman, M. C., 2002, ApJ, 568, L97.
- Colbert & Mushotzky (1999) Colbert, E. J. M., & Mushotzky, R. F. 1999, ApJ, 519, 89
- Colbert & Ptak (2002) Colbert, E. J. M., & Ptak, A. F. 2002, ApJS, 143, 25
- Dewangan et al. (2006a) Dewangan, G. C., Griffiths, R. E., & Rao, A. R. 2006, ApJ, 641, L125
- Dewangan et al. (2006b) Dewangan, G. C., Titarchuk, L., & Griffiths, R. E. 2006, ApJ, 637, L21
- Dewangan et al. (2005) Dewangan, G. C., Griffiths, R. E., Choudhury, M., Miyaji, T., & Schurch, N. J. 2005, ApJ, 635, 198
- Feng & Kaaret (2006) Feng, H., & Kaaret, P. 2006, ApJ, 650, L75
- Feng & Kaaret (2005) Feng, H., & Kaaret, P. 2005, ApJ, 633, 1052
- Fabbiano (1989) Fabbiano, G. 1989, ARA&A, 27, 87
- Fabbiano (2004) Fabbiano, G. 2004, Revista Mexicana de Astronomia y Astrofisica Conference Series, 20, 46
- Fiorito & Titarchuk (2004) Fiorito, R. & Titarchuk, L., 2004, ApJ, 614, L113.
- Fox et al. (2000) Fox, D. W., et al. 2000, MNRAS, 319, 1154
- Green et al. (2004) Green, P. J., et al. 2004, ApJS, 150, 43
- Gonçalves & Soria (2006) Gonçalves, A. C., & Soria, R. 2006, MNRAS, 371, 673
- Gutiérrez & López-Corredoira (2005) Gutiérrez, C. M., & López-Corredoira, M. 2005, ApJ, 622, L89
- Holt et al. (2003) Holt, S. S., Schlegel, E. M., Hwang, U., & Petre, R. 2003, ApJ, 588, 792
- Kaaret et al. (2001 ) Kaaret, P., et al. 2001, MNRAS, 321, L29.
- King et al. (2001) King, A. R. et al. 2001, ApJ, 552, L109.
- Krauss et al. (2005) Krauss, M. I., Kilgard, R. E., Garcia, M. R., Roberts, T. P., & Prestwich, A. H. 2005, ApJ, 630, 228
- Kubota et al. (2001) Kubota, A., et al., 2001, ApJ, 547, L119.
- Lira et al. (2000) Lira, P., Lawrence, A., & Johnson, R. A. 2000, MNRAS, 319, 17
- Liu & Mirabel (2005) Liu, Q. Z., & Mirabel, I. F. 2005, A&A, 429, 1125
- Madau & Rees (2001) Madau, P., & Rees, M. J., 2001, ApJ, 551, L27.
- Makishima et al. (2000) Makishima, K., et al. 2000, ApJ, 535, 632
- Matsumoto et al. (2001) Matsumoto, H., et al. 2001, ApJ, 547, L25.
- Miller et al. (2003) Miller, J. M., Fabbiano, G., Miller, M. C., & Fabian, A. C., 2003, ApJ, 585, L37.
- Miller & Colbert (2004) Miller, M. C., & Colbert, E. J. M. 2004, International Journal of Modern Physics D, 13, 1
- Miller, Fabian & Miller (2004) Miller, J. M., Fabian, A. C., & Miller, M. C., 2004, ApJ, 607, 931.
- Miller (2005) Miller, J. M. 2005, Ap&SS, 300, 227
- Misra & Sriram (2003) Misra, R., & Sriram, K., 2003, ApJ, 584, 981.
- Mizuno et al. (2001) Mizuno, T., Kubota, A., & Makishima, K. 2001, ApJ, 554, 1282
- Portegies, Zwart & McMillian (2002) Portegies Zwart, S. F., & McMillian, S. L. W., 2002, ApJ, 576, 899.
- Ptak and Griffiths (1999) Ptak A., & Griffiths R., 1999, ApJ, 517, L85
- Richstone et al. (1998) Richstone, D., et al. 1998, Nature, 395, A14
- Roberts & Warwick (2000) Roberts, T. P., & Warwick, R. S. 2000, MNRAS, 315, 98
- Roberts et al. (2006) Roberts, T. P., Kilgard, R. E., Warwick, R. S., Goad, M. R., & Ward, M. J. 2006, MNRAS, 371, 1877
- Ryder et al. (1993) Ryder, S., Staveley-Smith, L., Dopita, M., Petre, R., Colbert, E., Malin, D., & Schlegel, E. 1993, ApJ, 416, 167
- Stobbart et al. (2006) Stobbart, A.-M., Roberts, T. P., & Wilms, J. 2006, MNRAS, 368, 397
- Strohmayer & Mushotzky (2003) Strohmayer, T. E., & Mushotzky, R. F., 2003, ApJ, 586, L61.
- Swartz et al. (2004) Swartz, D. A., Ghosh, K. K., Tennant, A. F., Wu K. 2004, ApJS, 154, 519.
- Taniguchi et al. (2000) Taniguchi, Y., Shioya, Y., Tsuru, T. G. & Ikeuchi, S., 2000, PASJ, 52, 533.
- Wang et al. (2004) Wang, Q. D., Yao, Y., Fukui, W., Zhang, S. N., & Williams, R. 2004, ApJ, 609, 113
- Winter et al. (2006) Winter, L. M., Mushotzky, R. F., & Reynolds, C. S. 2006, ApJ, 649, 730
- Zezas & Fabbiano (2002) Zezas, A., & Fabbiano, G., ApJ, 577, 726.
| Galaxy | R.A. | Dec. | Count rate s-1 |
|---|---|---|---|
| NGC0253 | 0 47 32.97 | -25 17 48.80 | 0.0845164 |
| NGC0253 | 0 47 22.59 | -25 20 50.87 | 0.0657110 |
| NGC0253 | 0 47 17.55 | -25 18 11.18 | 0.0569807 |
| NGC1569 | 4 31 16.85 | +64 49 50.13 | 0.0567468 |
| NGC2403 | 7 36 55.61 | +65 35 40.85 | 0.0746877 |
| NGC2403 | 7 36 25.53 | +65 35 40.02 | 0.1521207 |
| NGC3628 | 11 20 15.75 | +13 35 13.70 | 0.0530390 |
| NGC4374 | 12 25 11.92 | +12 51 53.53 | 0.0563400 |
| NGC4449 | 12 28 17.83 | +44 6 33.86 | 0.0525013 |
| NGC4485 | 12 30 43.26 | +41 38 18.36 | 0.0509909 |
| NGC4485 | 12 30 30.56 | +41 41 42.33 | 0.0758634 |
| NGC4559 | 12 35 58.56 | +27 57 41.91 | 0.1233310 |
| NGC4559 | 12 35 51.71 | +27 56 4.05 | 0.1984267 |
| NGC4631 | 12 41 55.56 | +32 32 16.90 | 0.0554584 |
| NGC6946 | 20 35 0.74 | +60 11 30.74 | 0.1448118 |
Note. — The spectra of these sources would be affected by pile-up and hence have not been included in the sample
| Galaxy | R.A. | Decl. | () | log(L) ergs/s | Cstat | d. o. f. | |
|---|---|---|---|---|---|---|---|
| NGC0253 | 0 47 43.07 | -25 15 29.28 | |||||
| NGC0253 | 0 47 42.80 | -25 15 2.02 | |||||
| NGC0253 | 0 47 35.25 | -25 15 11.53 | |||||
| NGC0253 | 0 47 34.28 | -25 17 3.32 | |||||
| NGC0253 | 0 47 34.00 | -25 16 36.51 | |||||
| NGC0253 | 0 47 33.55 | -25 18 16.51 | |||||
| NGC0253 | 0 47 32.05 | -25 17 21.43 | |||||
| NGC0253 | 0 47 30.98 | -25 18 26.23 | |||||
| NGC0253 | 0 47 28.01 | -25 18 20.21 | |||||
| NGC0253 | 0 47 25.20 | -25 19 45.22 | |||||
| NGC0253 | 0 47 18.50 | -25 19 13.94 | |||||
| NGC0253 | 0 47 40.66 | -25 14 11.71 | |||||
| NGC0253 | 0 47 17.65 | -25 18 26.45 | |||||
| NGC0628 | 1 36 51.06 | +15 45 46.86 | |||||
| NGC0628 | 1 36 47.45 | +15 47 45.01 | |||||
| . . . . | . . . . . |
Note. — Host galaxy name; Right Ascension; Declination; , equivalent hydrogen column density; , photon power-law index; L, X-ray luminosity in the energy range: 0.3-8.0 keV; C-statistics; degree of freedom. The complete version of this table is in the electronic edition of the Journal. The printed edition contains only a sample.
| Galaxy | R.A. | Decl. | () | kTin (keV) | log(L) ergs/s | Cstat | d. o. f. |
|---|---|---|---|---|---|---|---|
| NGC0253 | 0 47 43.07 | -25 15 29.28 | |||||
| NGC0253 | 0 47 42.80 | -25 15 2.02 | |||||
| NGC0253 | 0 47 35.25 | -25 15 11.53 | |||||
| NGC0253 | 0 47 34.28 | -25 17 3.32 | |||||
| NGC0253 | 0 47 34.00 | -25 16 36.51 | |||||
| NGC0253 | 0 47 33.55 | -25 18 16.51 | |||||
| NGC0253 | 0 47 32.05 | -25 17 21.43 | |||||
| NGC0253 | 0 47 30.98 | -25 18 26.23 | |||||
| NGC0253 | 0 47 28.01 | -25 18 20.21 | |||||
| NGC0253 | 0 47 25.20 | -25 19 45.22 | |||||
| NGC0253 | 0 47 18.50 | -25 19 13.94 | |||||
| NGC0253 | 0 47 40.66 | -25 14 11.71 | |||||
| NGC0253 | 0 47 17.65 | -25 18 26.45 | |||||
| NGC0628 | 1 36 51.06 | +15 45 46.86 | |||||
| NGC0628 | 1 36 47.45 | +15 47 45.01 | |||||
| . . . . | . . . . . |
Note. — Host galaxy name; Right Ascension; Declination; , equivalent hydrogen column density; , inner disk temperature; L, Bolometric X-ray luminosity; C-statistics; degree of freedom. The complete version of this table is in the electronic edition of the Journal. The printed edition contains only a sample.