Evidence for a Massive Protocluster in S255N
Abstract
S255N is a luminous far-infrared source that contains many indications of active star formation but lacks a prominent near-infrared stellar cluster. We present mid-infrared through radio observations aimed at exploring the evolutionary state of this region. Our observations include 1.3 mm continuum and spectral line data from the Submillimeter Array, Very Large Array 3.6 cm continuum and 1.3 cm water maser data, and multicolor IRAC images from the Spitzer Space Telescope. The cometary morphology of the previously-known UCH ii region G192.584-0.041 is clearly revealed in our sensitive, multi-configuration 3.6 cm images. The 1.3 mm continuum emission has been resolved into three compact cores, all of which are dominated by dust emission and have radii AU. The mass estimates for these cores range from 6 to 35 M☉. The centroid of the brightest dust core (SMA1) is offset by (2800 AU) from the peak of the cometary UCH ii region and exhibits the strongest HC3N, CN, and DCN line emission in the region. SMA1 also exhibits compact CH3OH, SiO, and H2CO emission and likely contains a young hot core. We find spatial and kinematic evidence that SMA1 may contain further multiplicity, with one of the components coincident with a newly-detected H2O maser. There are no mid-infrared point source counterparts to any of the dust cores, further suggesting an early evolutionary phase for these objects. The dominant mid-infrared emission is a diffuse, broadband component that traces the surface of the cometary UCH ii region but is obscured by foreground material on its southern edge. An additional 4.5 m linear feature emanating to the northeast of SMA1 is aligned with a cluster of methanol masers and likely traces a outflow from a protostar within SMA1. Our observations provide direct evidence that S255N is forming a cluster of intermediate to high-mass stars.
1 Introduction
The formation and early evolution of stellar clusters occurs in deeply embedded regions of giant molecular clouds (Lada & Lada, 2003). While much has been learned from recent surveys in the infrared (Gutermuth et al., 2005; Muench et al., 2002), the earliest stages of cluster formation will (at least in many cases) be hidden from all but the longest IR/millimeter wavelengths. Due to the small size scales of young clusters–multiplicity of protostars has been observed on scales of a few thousand AU (e.g. Megeath, Wilson, & Corbin, 2005)–high angular resolution is necessary to resolve individual objects, particularly in massive star forming regions which lie at relatively large distances ( kpc). These considerations point to millimeter-wavelength interferometric observations of thermal dust continuum emission as an effective means of searching for clusters of young protostars, as the mm emission remains optically thin up to high column densities (1025 cm-2 ).
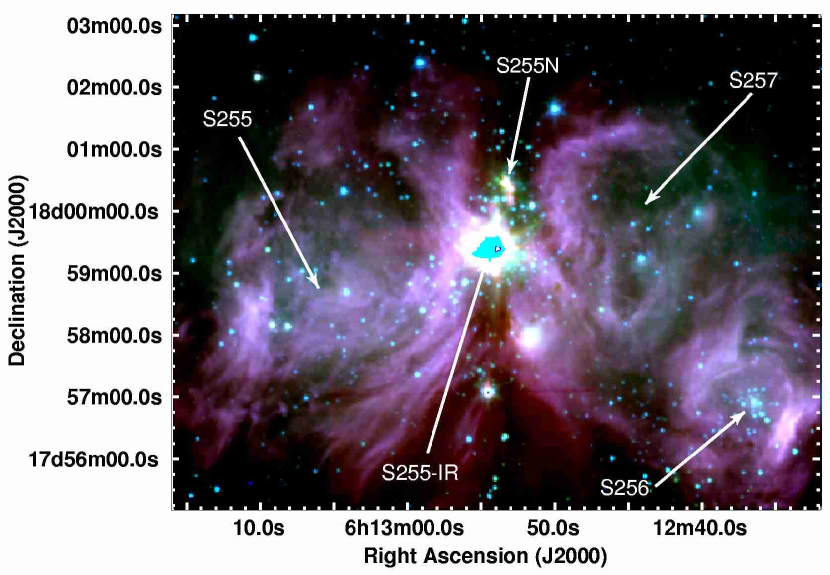
Located north of the luminous infrared cluster S255IR, S255N is a promising target in the search for young protoclusters. As illustrated in Figure 1, S255N is located in a complicated region of past and ongoing massive star formation. S255N and S255IR (saturated in this mid-IR Spitzer IRAC image) lie between two large H ii regions, S255 and S257. Large-scale 12CO and HCN observations show that S255IR and S255N occupy opposite ends of a molecular ridge between the H ii regions (Heyer et al., 1989). The total luminosity of S255N ( L⊙) is about twice that of S255IR (Minier et al., 2005), and single-dish continuum and spectral line observations at submillimeter and millimeter wavelengths have established the presence of large column densities of dust and gas toward both regions (e.g. Richardson et al., 1985; Mezger et al., 1988; Zinchenko, Henning, & Schreyer, 1997; Minier et al., 2005). Observations at infrared and radio wavelengths, however, suggest that S255N is the younger of the two regions. For example, S255IR is bright ( Jy) in all infrared bands of the Midcourse Space Experiment (MSX) and contains a well-developed near-IR cluster of early-B type stars (S255-2 Howard, Pipher & Forrest, 1997; Itoh et al., 2001), a cluster of compact H ii regions (Snell & Bally, 1986), and a wealth of complex H2 emission features (Miralles et al., 1997). In contrast, S255N (also called S255 FIR1 and G192.60-MM1) is undetected in MSX images at wavelengths shorter than 21 m (Crowther & Conti, 2003), and contains only a single cometary UC H ii region, G192.584-0.041 (e.g. Kurtz, Churchwell, & Wood, 1994).
Additional evidence for protostellar activity in S255N exists in the form of outflow tracers. For example, two small knots of H2 emission bracket the UC H ii region and may be tracing an outflow (Miralles et al., 1997). In beamsizes of , redshifted CO emission (Heyer et al., 1989) and highly-blueshifted OH absorption (Ruiz et al., 1992) are also seen toward the UC H ii region. Finally, 44 GHz (70-61) A+ Class I methanol masers form a linear feature extending northeast of the UC H ii region (Kurtz, Hofner, & Álvarez, 2004); masers of this type have been observed in association with molecular outflows in other objects (Plambeck & Menten, 1990; Kurtz, Hofner, & Álvarez, 2004).
At this stage, further understanding of the state of star formation in S255N requires resolving the mm dust continuum emission in order to search for additional compact sources that may be present in the vicinity of the UC H ii region. The high angular resolution now available with the Submillimeter Array (SMA)111The Submillimeter Array is a joint project between the Smithsonian Astrophysical Observatory and the Academia Sinica Institute of Astronomy and Astrophysics and is funded by the Smithsonian Institution and the Academia Sinica. makes this goal possible, while the wide bandwidth allows simultaneous observation of many spectral lines, which are sensitive to a range of gas conditions across the region. We describe our observations in section 2, present our results in section 3, and discuss our interpretations in section 4.
A range of distances to S255 and S255N have been used in the literature. At the extremes, Georgelin, Georglein, & Roux (1973) find an optical distance of 3.2 kpc to each of the adjacent H ii regions S254 and S257 (located west of S255N), while Hunter & Massey (1990) find a distance of 1.1 kpc to the optical H ii region S255 (located east of S255N, see Figure 1) based on spectroscopy of its exciting star. Using a LSR velocity of +9 km s-1 (typical of the centroid velocities of our observed lines), and a Galactic center distance of 8.5 kpc, we find a kinematic distance to S255N of 2.2 kpc using the rotation curve of Brand & Blitz (1993). In this paper we adopt a distance of 2.6 kpc for S255N (also see Moffat et al., 1979; Minier et al., 2005).
2 Observations
2.1 Submillimeter Array (SMA)
Our SMA observations toward S255N were obtained on December 06, 2003 in the compact configuration. Six antennas were operational and the projected baseline lengths ranged from 12 to 62 k, resulting in a synthesized beam of (P.A.=). In this configuration, the interferometer is not sensitive to smooth structures larger than 17′′. The phase center was , (J2000), and the double-sideband SIS receivers were tuned to an LO frequency of 222.78 GHz. With a bandwidth of 2 GHz, the correlator covered 216.796-218.764 GHz in lower sideband (LSB) and 226.796-228.764 GHz in upper sideband (USB). The data were resampled to provide uniform spectral resolution of 1.12 km s-1. The zenith opacity as measured by the 225 GHz tipping radiometer at the Caltech Submillimeter Observatory (CSO) was 0.18 at the beginning of the observations and fell as low as 0.16. Data recorded late in the observing session, when the opacity had climbed to 0.3, were not used. The typical system temperature at source transit was 200 K. The primary beamsize of the 6-meter SMA antennas at this frequency is 56′′.
Initial calibration of the data was performed in Miriad. The gain calibrators were J0739+016 and J0423-013. J0423-013 was also used for passband calibration. Subsequent processing was carried out in AIPS. The continuum emission was measured using line-free channels and removed in the plane. The resulting continuum-only data were then self-calibrated; these complex gain solutions were also applied to the continuum-subtracted line data. The absolute position uncertainty is estimated to be and the amplitude calibration is accurate to 20%. For maximum sensitivity, both the continuum and line data were imaged with natural weighting. The rms sensitivity of the continuum image is 4 mJy beam-1 (8 mK) and the rms sensitivity of the line data is 89 mJy beam-1 (170 mK).
2.2 Very Large Array (VLA)
Archival 3.6 cm data from the NRAO222The National Radio Astronomy Observatory is a facility of the National Science Foundation operated under agreement by the Associated Universities, Inc. Very Large Array (VLA) were calibrated and imaged in AIPS. The observation date was 2003 June 15 and the total time on source was 70 minutes (project code AH819). The VLA was in A-configuration, in which the interferometer is not sensitive to smooth structures larger than 7′′. The bandwidth was 50 MHz in two IFs. The flux calibrator was 3C147, and the gain calibrator was J0613+131. The synthesized beam of the 3.6 cm continuum image is (P.A.=) and the rms sensitivity is 18 Jy beam-1. Archival 3.6 cm data from the B configuration (in which the interferometer is not sensitive to smooth structures larger than 20′′), observed on 1990 August 27 (project code AM301), and from the the CnB configuration, observed on 2005 June 21 (project code TSTCJC), were also reduced and combined with the A-configuration data. The resulting image, made with a UV taper at 500 k, has a synthesized beam of (P.A.=) and a rms sensitivity of 34 Jy beam-1.
Archival 1.3 cm data from the VLA A-configuration (project code AC299) were analyzed for water maser emission at 22.235 GHz. The observation date was 1991 August 1, total on-source integration time was 10 minutes. The phase center of this observation was toward the IR cluster to the south of S255N, hence a correction for the primary beam attenuation has been applied to the data. The bandpass calibrator was 3C84 and the flux calibration was derived assuming a flux density of 2.16 Jy for J0528+134. The synthesized beam is (P.A.=), the spectral line channel spacing is 0.33 km s-1, and the rms noise is 0.13 Jy beam-1.
2.3 Spitzer Space Telescope
Mid-infrared images of S255 were obtained with the IRAC camera (Fazio et al., 2004) on the Spitzer Space Telescope as part of Guaranteed Time Observations program 201 (P.I. G. Fazio) on 12 March 2004. Integrations of 0.4 s and 10.4 s were taken in the high dynamic range mode; S255N is not saturated in the longer exposures, and only the 10.4 s exposures are discussed in this paper. Four 10.4 s exposures covered S255N, for a total integration time on S255N of 41.6 s. Mosaiced post-BCD 3.6, 4.5, 5.8, and 8.0 m images, calibrated and processed using pipeline version S13.2.0, were downloaded from the Spitzer data archive.
2.4 Caltech Submillimeter Observatory
Our submillimeter continuum observations were obtained at the CSO using the Submillimeter High Angular Resolution Camera (SHARC), a 3He-cooled monolithic silicon bolometer array of 24 pixels in a linear arrangement (Hunter, Benford & Serabyn, 1996; Wang et al., 1996). For a typical dust source with a submillimeter spectral index of , the effective frequency of the broadband 350 m filter is 852 GHz and the bandwidth is 103 GHz. An on-the-fly (OTF) map of S255 was obtained on 21 December 1995 by scanning the array through the source in azimuth while the secondary mirror was chopping at a rate of 4.1 Hz and a throw of . Successive scans were made after stepping the array in elevation by increments of . Airmass corrections were applied to each scan using the opacity derived from frequent scans of Saturn during the night. The map data were restored with a NOD2 dual beam restoration algorithm (Emerson, Klein & Haslam, 1979) and transformed into equatorial coordinates. The resulting image was smoothed with a Gaussian to produce an effective half-power beamsize of .
3 Results
3.1 Continuum emission
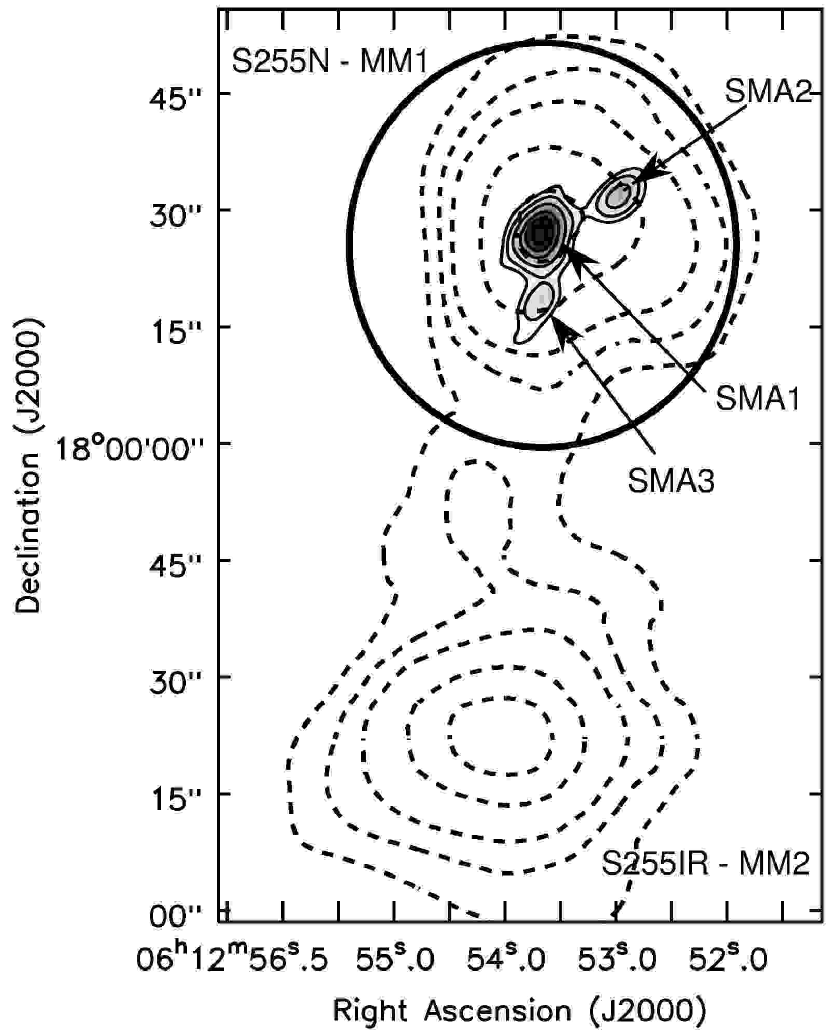
Our 1.3 mm SMA continuum data resolve three distinct sources within the previously-observed submm/mm clump of S255N (aka S255 FIR1 and G192.60-MM1: Jaffe et al., 1984; Mezger et al., 1988; Minier et al., 2005). Figure 2 shows the SMA 1.3 mm continuum image with CSO 350 m contours superposed. As illustrated in Figure 2, the strongest SMA 1.3 mm emission peak coincides with the CSO 350 m peak (resolution ). The CSO 350 m integrated flux density is 575 Jy, consistent to within 10% of the value predicted by the dust spectral energy distribution (SED) models of Minier et al. (2005). The three mm sources resolved with the SMA are designated SMA1, SMA2, and SMA3 in order of descending peak intensity. The observed properties of each source (peak intensity, brightness temperature, integrated flux density, and source size) are listed in Table 1, and the sources are labeled in Figure 2. The integrated flux densities and source sizes listed in Table 1 were determined by fitting a single Gaussian component to each SMA source. SMA1 was not well fit by a single Gaussian, indicating that the observed continuum emission may arise from multiple sources unresolved by the SMA beam; this issue is discussed further in §4.2. The total flux density of the three compact mm sources is 0.790.16 Jy; stated errors include the 20% uncertainty in flux calibration. This total corresponds to 153% of the single-dish flux density measured by Minier et al. (2005) with the SEST 15m telescope at 1.2mm (resolution 24′′).
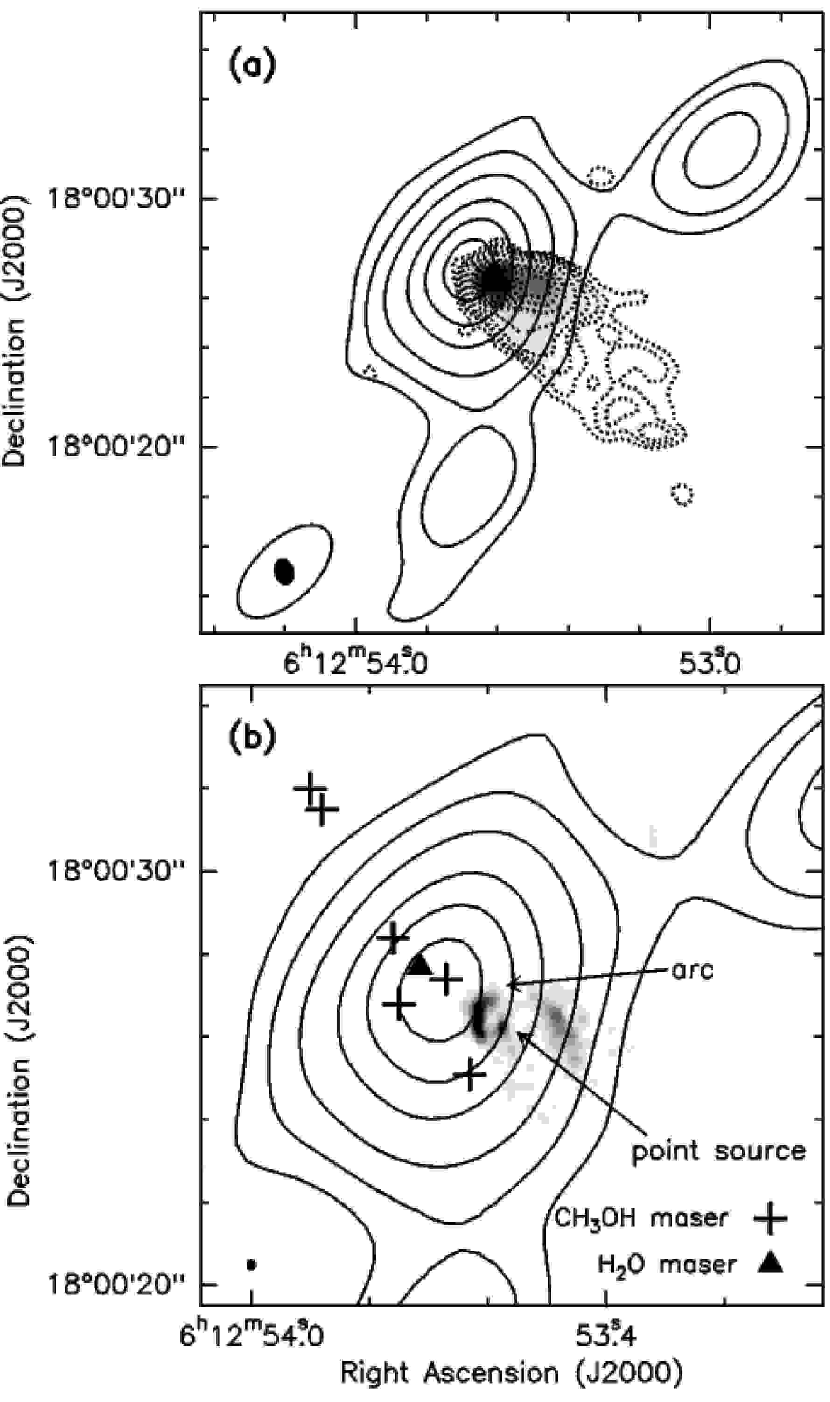
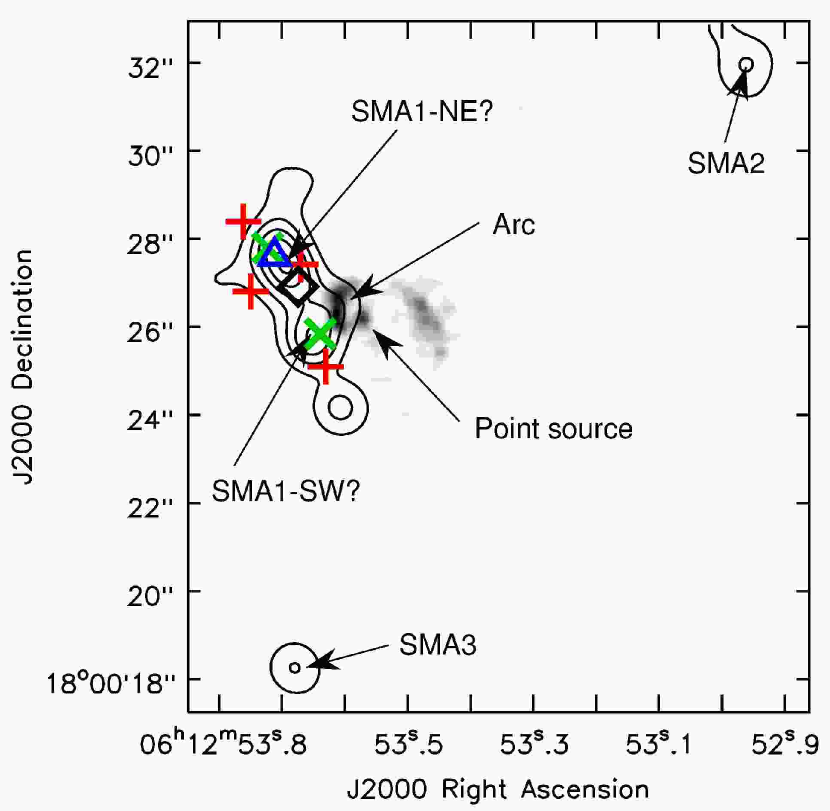
Figure 3 compares the morphology of the 1.3 mm dust continuum emission with the 3.6 cm free-free continuum emission from the cometary UC H ii region, G192.584-0.041. Figure 3a shows the lower-resolution () 3.6 cm VLA image superposed on the SMA 1.3 mm continuum, while Figure 3b shows the high-resolution VLA 3.6 cm image (), with the positions of the newly-reported water maser (see §3.2) and the Class I methanol masers detected by Kurtz, Hofner, & Álvarez (2004) indicated.
The resolution 3.6 cm VLA image presented in Figure 3a provides the most detailed view to date of the diffuse cometary “tail” of the UC H ii region. The integrated flux density of G192.584-0.041 measured from this image is 26.00.1 mJy. Based on our measurement and published 2 cm integrated flux densities for G192.584-0.041 (Kurtz, Churchwell, & Wood, 1994; Rengarajan & Ho, 1996), the spectral index from 3.6 cm to 2 cm is -0.1, consistent with optically thin free-free emission. The flux density is consistent with a single exciting star of spectral type B0.5 (as determined by Kurtz, Churchwell, & Wood, 1994; Snell & Bally, 1986). Extrapolating to 1.3 mm, we estimate the free-free contribution of G192.584-0.041 to the 1.3 mm flux density of SMA1 to be 20 mJy (3.5%).
The 3.6 cm VLA image presented in Figure 3b is the highest-resolution cm-wavelength image of G192.584-0.041 to date. With a resolution of , the continuum emission from G192.584-0.041 is resolved into three components (east to west): an arc, a point source, and an extended feature (the extended “tail” is resolved out in the higher resolution data). All three of these components overlap with the eastern side of SMA1, but none is coincident with the mm emission peak, in agreement with the estimate that the free-free contribution at 1.3 mm is quite small. The arc, which is oriented with its convex side towards the mm peak, contains the brightest 3.6 cm emission. The 3.6 cm peak is located in the southern part of the arc, east of the point source, and is offset by 11 (2800 AU) from the location of the SMA1 mm continuum peak determined by fitting a single Gaussian component. The 3.6 cm point source, which is located west of the arc and faces its concave side, is offset by 16 (4,200 AU) from the SMA1 mm continuum peak. The peak brightness temperature of the 3.6 cm point source is only 122 K at the current resolution. Absent a second radio frequency image with comparable resolution, it is not currently possible to ascertain the spectral indices of the individual components. The 3.6 cm images presented in Figure 3(a-b) place strong limits on the presence of any additional H ii regions in S255N. Other than G192.584-0.041, no cm-wavelength emission is detected down to a 5 limit of 90 Jy beam-1 (high-resolution image).
3.2 Water maser emission
Water maser emission was detected at the position , (J2000), offset (2,300 AU at 2.6 kpc) to the northeast of the 1.3 mm continuum emission peak of SMA1, as determined by fitting a single Gaussian component. This is the first report of water maser emission from S255N. The peak intensity is 2.8 Jy beam-1 (corrected for primary beam attenuation) at =+8.5 km s-1. The line is barely resolved by the 0.33 km s-1 spectral resolution.
The positions of the Class I 44 GHz (70-61) A+ methanol masers detected by Kurtz, Hofner, & Álvarez (2004) are marked with crosses in Fig. 3b, which shows the 1.3 mm and 3.6 cm continuum emission and the newly-reported water maser. Kurtz, Hofner, & Álvarez (2004) estimate an astrometric uncertainty of for the CH3OH maser spots, while the absolute astrometry of the H2O maser is better than 01. The position of one of the CH3OH maser spots is consistent with SMA1, within the astrometric uncertainty. The newly detected water maser is 1″ from two CH3OH masers, and falls into the linear pattern of 44 GHz (70-61) A+ CH3OH maser spots that extends northeast from SMA1.
3.3 Line emission
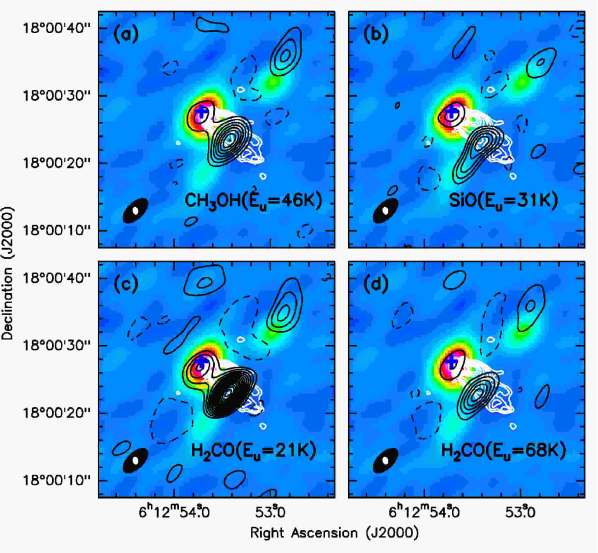
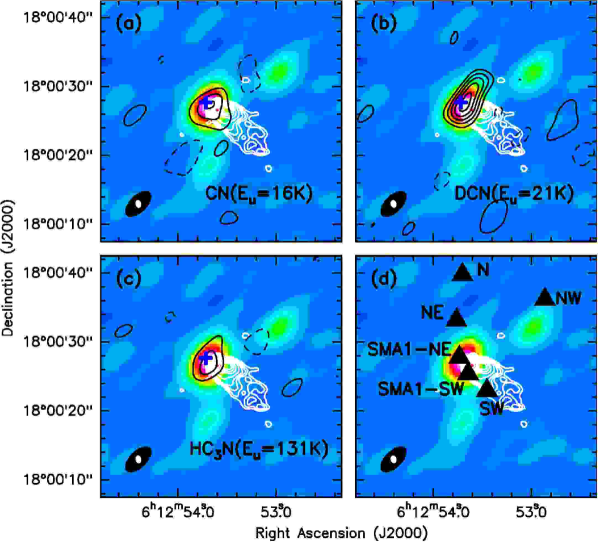
Molecular line emission from H2CO, CH3OH, SiO, CN, DCN, and HC3N is detected in S255N; the specific transitions, frequencies, and upper state energies are listed in Table 2. The lines detected in S255N are the same as those detected in the spectral regions covered by our sidebands by Sutton et al. (1985) in their line survey of the Orion A molecular cloud, which is similar to our data in spectral resolution (1.3 km/s), rms sensitivity (0.2 K), and linear size scale (30′′= 13,500 AU at 450 pc). Integrated intensity images for CH3OH, SiO, and H2CO are presented in Figure 4(a-d) and for DCN, HC3N, and CN in Figure 5(a-c). The distributions of molecular emission observed in S255N fall into two main categories: CH3OH, H2CO and SiO exhibit emission from multiple locations, while DCN and HC3N are detected only in the vicinity of SMA1. CN exhibits compact emission towards SMA1, and is also weakly detected toward SMA3. The CN lines have the lowest Eupper of the observed transitions, and the CN images show artifacts from large-scale emission resolved out by the interferometer, suggesting that much of the CN emission originates in an extended, cool envelope around the compact continuum sources.
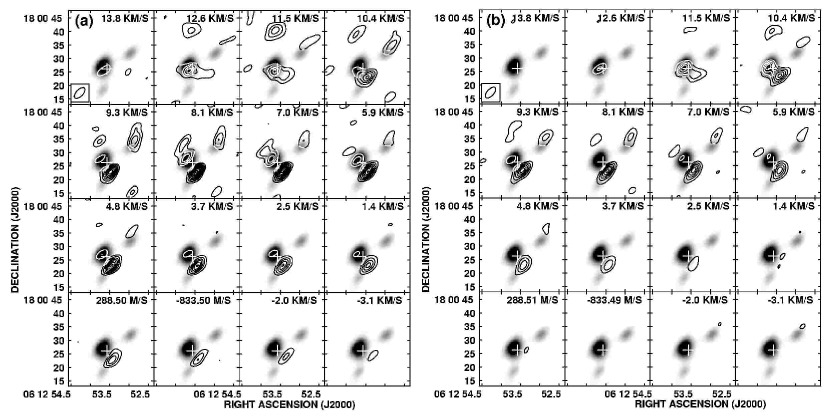
As shown in Figure 4(a-d), the spatial distributions of the integrated emission from H2CO, CH3OH, and SiO are similar to one another. The kinematics of these molecules are complex, as illustrated in Figures 6 and 7, with multiple spatially and kinematically distinct components apparent. A finder chart for the positions of the profiles displayed in Fig. 7 (named after their relative positions with respect to SMA1) is shown in Figure 5(d). The positions are listed in Table 3. Line centroid velocities, , and integrated line intensities obtained from Gaussian fits to the line profiles at these positions are listed in Table 4. Unless otherwise noted, the fit parameters in Table 4 are for the strongest component in the spectrum. Fits to SiO line profiles are not included because the SiO line shapes are so complex.
The strongest molecular emission in S255N lies toward the “SW” position to the southwest of SMA1 at a peak velocity between km s-1 (Figs. 4, 6, 7c, Table 4). This molecular emission is not coincident with any mm continuum emission and overlaps the southern edge of the extended “tail” of the UC H ii region (Fig. 4). The line emission toward the “SW” position is broader than at any other location in S255N, with 7 and 9 km s-1 for CH3OH and H2CO, respectively, and shows pronounced blue wings. The velocity of the H2CO peak is slightly more blueshifted than CH3OH, while SiO is significantly blueshifted relative to both H2CO and CH3OH (Fig. 7c, Table 4).
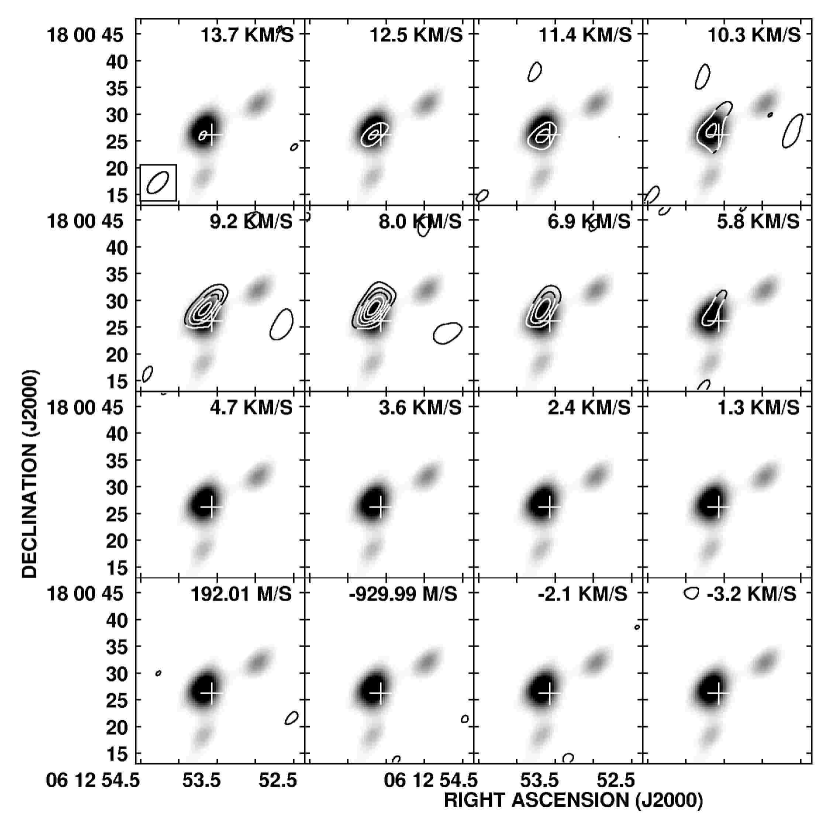
The second-brightest region of H2CO, CH3OH, and SiO emission in S255N is located in the vicinity of SMA1, east of the cometary head of the UCH ii region (Fig. 4). DCN, CN, and HC3N have their strongest emission in this area (Fig. 5). Spectral line profiles for DCN, CN, and HC3N are shown in Figure 8 and channel maps for DCN are shown in Figure 9. Two positionally and kinematically distinct components are evident in H2CO, DCN, CN, HC3N, and weakly, CH3OH, in the vicinity of SMA1. One component (denoted SMA1-NE) lies to the northeast of the SMA1 mm peak at a velocity of km s-1, and the other (denoted SMA1-SW) lies southwest of the SMA1 mm peak at km s-1 (Figs. 6, 7a,b, and 8a,b). SMA1-SW is east of the 3.6 cm point source.
Interestingly, SMA1-NE and SMA1-SW also show differences in their chemical properties. For example, H2CO shows nearly equal strength towards both positions, as does HC3N, while CH3OH is much stronger toward SMA1-SW (Fig. 6, 8). In contrast, DCN and CN are both significantly stronger toward SMA1-NE (Fig. 8). Some differences in the peak velocities at the two positions are also apparent amongst species. Relative to the other molecules, SiO is significantly blueshifted ( km s-1) towards both SMA1-SW and SMA1-NE (Fig. 7, Table 4). DCN is slightly redshifted relative to CN and HC3N toward both positions (Fig. 8, Table 4). The CN and HC3N lines are also more than twice as broad as those of H2CO or CH3OH toward SMA1-SW (Table 4).
The H2CO, CH3OH, and SiO integrated intensity peak located 5″ north of the mm continuum source SMA2 (Fig. 4, “NW” position in Fig. 5d), is comprised of relatively weak, broad emission (Fig. 7f). The H2CO and CH3OH lines are narrower than at the SW position, but broader than at any of the other positions (Table 4). As at the other positions, the peak of the SiO line profile is blueshifted relative to H2CO and CH3OH (Fig. 7f).
The line emission north and northeast of the SMA1 region (“N” and “NE” positions, finding chart Fig. 5d) consists of narrow velocity features in CH3OH and H2CO, and, at the NE position, SiO (Figs. 6 & 7d-e). In contrast to the other positions, at the NE position CH3OH, H2CO, and SiO have the same velocity, 8 km s-1(Fig. 7d, Table 4). The velocity of the H2CO and CH3OH emission at the N position is similar to the 11.5 km s-1 component toward SMA1-SW (Table 4). The H2CO and CH3OH lines are narrow, and the CH3OH peak is slightly blueshifted relative to H2CO. Broad and weak blueshifted SiO emission is also detected at this position (Table 4, Fig. 7e).
3.4 Spitzer Space Telescope IRAC Observations
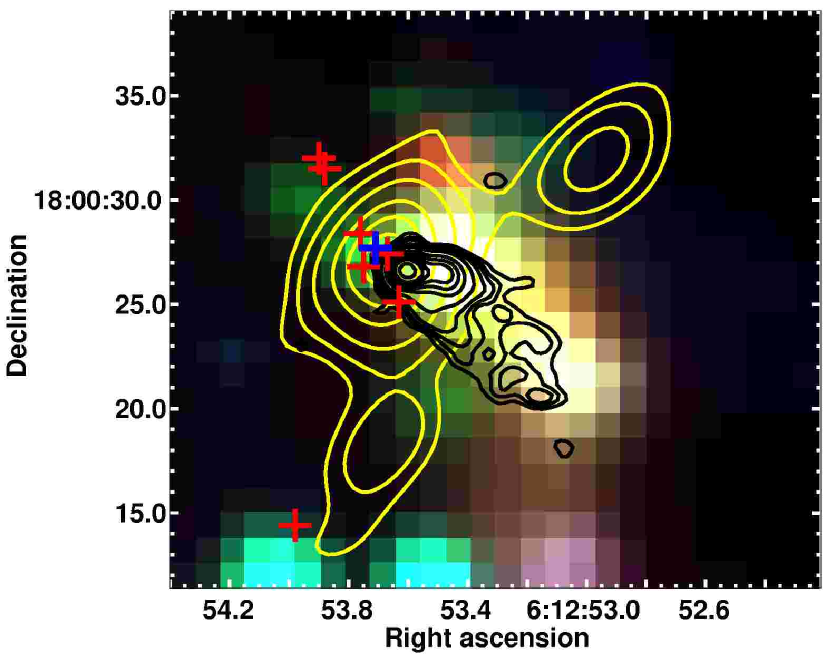
Figure 10 shows a three-color IRAC image (red 8.0 m, green 4.5 m, blue 3.6 m) of S255N, overlaid with contours of the 1.3 mm continuum emission (yellow) and the 3.6 cm continuum emission (white). The positions of the Class I CH3OH masers reported by Kurtz, Hofner, & Álvarez (2004) and the newly-reported water maser are marked with crosses. Most of the observed mid-IR emission is offset to the northwest of the UC H ii region, and this diffuse emission appears in all IRAC bands. An exception is the linear, green 4.5 m emission feature that extends NE from the SMA1 mm continuum peak. No mid-IR emission is associated with either SMA2 or SMA3, indeed these two positions are notably absent of IR emission.
4 Discussion
4.1 Mass estimates from the dust emission
With an estimate of the dust temperature, we can estimate the masses of the compact dust sources SMA1, SMA2, and SMA3 using a simple isothermal model of optically thin dust emission (Beltrán et al., 2006):
| (1) |
where R is the gas-to-dust mass ratio (assumed to be 100), is the observed flux density, D is the distance to the source, B() is the Planck function, and is the dust mass opacity coefficient. At 1.3 mm, the value of for gas densities of 106-108 cm-3 does not differ much for grains with thick or thin ice mantles; we adopt a value of =1 cm2 g-1 for all of the compact mm sources (Ossenkopf & Henning, 1994). The assumption of low optical depth is justified by the low observed millimeter brightness temperatures (Table 1), however, for highest accuracy we have made the small correction to our derived masses for non-zero optical depth using the formula: .
Previous determinations of the dust temperature and mass in S255N have relied on fitting multiple components to the (unresolved) mid-IR to mm SED. Minier et al. (2005) fit a hot, compact core (T = 106 K, diameter = 400 AU) and an extended warm envelope (T = 44 K, diameter = 58,000AU) to a SED comprised of MSX, IRAS, SCUBA, and SEST data, assuming a distance of 2.6 kpc. The derived luminosity and gas mass are L☉ and 220 M☉, respectively. While many of the datapoints in the SED constructed by Minier et al. (2005) blend emission from all three SMA sources, the very compact hot core implied by their fits would be unresolved by our SMA beam (12,200 6,200 AU at 2.6 kpc). Thus, the hot core temperature of 106 K derived from the SED modeling provides an upper limit for the dust temperature of the compact SMA sources. The fitted warm envelope temperature of 44 K is likewise a good lower limit to the temperature of SMA1 since it dominates the 1.3 mm flux, contributing 73% of the total SMA flux density.
Several single dish estimates of the gas temperature are also available. For example, Effelsberg 100-m observations of NH3 (1,1) and (2,2) (resolution ) suggest that the kinetic temperature of the gas is only K (Zinchenko, Henning, & Schreyer, 1997). Measurements of CH3C2H(6-5) K=0-3 toward S255N with the Onsala 20-m (resolution ) by Malafeev et al. (2005) yield K, in better agreement with the extended warm component derived for the dust. These authors find significantly higher temperatures using CH3C2H(6-5) than NH3 towards all five sources observed (including S255) and suggest that methyl acetylene may preferentially trace warmer/denser gas. In any case, since beam dilution may play a significant role in these single dish estimates, they can only provide a lower limit to the gas temperatures on SMA sizescales.
From our SMA line data it is clear that SMA1 is the warmest of the compact mm sources: the two detected transitions with the highest Eupper (both HC3N, Eupper=131 K and 142 K) are detected only towards SMA1, suggesting this may be a hot core (e.g. Hatchell, Millar, & Rodgers, 1998). DCN is also seen at this warm position. Though DCN is formed in cold clouds, in this case it can serve as a young hot core tracer since its presence in this warm region suggests it has recently been liberated from the icy mantles of dust grains (e.g. Mangum et al., 1991). The HC3N emission is consistent with an upper temperature limit of 100 K; a more quantitative determination is not possible with only two observed transitions. In contrast, the ratio of the H2CO(–) and H2CO(–) lines is a reliable density-independent temperature diagnostic for T 50 K, and (para-H2CO)/ 1013.5 cm-2 (km s-1)-1 (Mangum & Wootten, 1993). In this regime, the –/– ratio ranges from 15 to 5 for =20 to 50 K. In contrast, the observed line ratios in S255N are less than 2.5 throughout the imaged region and are smallest () toward SMA1, suggesting that the column density (i.e. opacity) and/or temperature is too high for these lines to be diagnostic. For the position of SMA1-NE, assuming a temperature of 75 K, N3.7 1013 cm-2 from the H2CO(–) line and N1.0 1014 cm-2 from the H2CO(–). This comparison suggests that the – line is moderately optically thick compared to the – line, and that the low line ratios are a combination of both the column density and temperature being higher than the diagnostic range of these two transitions. Combining this analysis with the SED models and the single dish line results described above, the allowed temperature range for SMA1 is 40 - 100 K. The resulting ranges of gas mass, column density, and number density computed for SMA1 are shown in Table 5. The high derived gas density (n3-16106 cm-3), also implied by the presence of the water maser, indicates that the gas and dust temperatures are likely to be well-coupled (e.g. Kaufman, Hollenbach, & Tielens, 1998; Ceccarelli, Hollenbach & Tielens, 1996).
Unlike SMA1, SMA2 and SMA3 are not accompanied by significant line emission. H2CO, CH3OH, and SiO emission are present to the north of SMA2, and CN emission is detected toward SMA3 (§3.3), but the physical relationship (if any) between this line emission and the dust continuum sources is unclear. Also unlike SMA1, SMA2 and SMA3 are not associated with mid-IR emission in any IRAC band (§3.4). Instead, SMA2 and SMA3 appear to be cold, dark, young mm cores, without evidence for current star formation. On the basis of the lack of line and mid-IR emission towards SMA2 and SMA3, we adopt a lower temperature limit of 20 K and an upper temperature limit of 40 K for these sources. The corresponding range of masses, column densities, and number densities for SMA2 and SMA3 are tabulated in Table 5. The mass of each (7-17 M⊙ for SMA2, 6-13 M⊙ for SMA3) is sufficient to form a low to intermediate mass star. No other cores are detected in the field to a upper limit of M⊙ (at K).
4.2 Velocity Structure and Outflows
Figure 10 shows a close-up view of the Spitzer 3-color IRAC image shown in Figure 1. The brightest mid-IR emission is extended along a NE-SW axis, approximately parallel to the axis of the UCH ii region, but with an offset to the northwest of . The overall morphology of S255N is consistent with the multi-band bright mid-IR emission tracing the surface of the UCH ii region, which is less dense to the southwest (of SMA1), as indicated by the diffuse “tail” of the cometary UC H ii region extending in this direction. However, the detailed interpretation of the mid-IR emission toward S255N is complicated by the offset described above, and the sharp cutoff of the 3.6 and 8.0 m emission along the southeast boundary of the UCH ii region. Indeed, mid-IR emission is notably absent toward SMA2 and SMA3, as well as toward much of SMA1. A likely scenario for this behavior is absorption of the mid-IR emission by the high column density mm cores; in this scenario the bulk of the relatively cold mm cores must be in front of the UCH ii region.
With the exception of SMA1, the molecular emission in S255N is not obviously associated with any continuum emission, and is therefore unlikely to be centrally heated. However, as described in §4.1 the H2CO line ratios suggest the gas is warm. Thus, it is likely that much of this emission is associated with outflow material, although the number of outflows and their driving source(s) are unclear. Published data on large-scale outflows in the region (e.g. Miralles et al., 1997; Richardson et al., 1985; Heyer et al., 1989; Ruiz et al., 1992) are unfortunately too low in angular resolution to be useful in distinguishing outflows associated with S255N from those associated with S255IR to the south, and/or the maps are swamped by emission from a large outflow flowing north from S255IR. Excluding the “SW” position, the relatively narrow linewidths of these S255N line emission regions suggest that they are density enhancements within a larger extended flow resolved out by the interferometer. The relative similarity of the line center velocities further suggests that the outflows are mostly in the plane of the sky.
The linear morphology of the (green) 4.5 m emission northeast of SMA1 is suggestive of an outflow (Fig. 10). Such 4.5 m nebulosity is a conspicuous feature of IRAC images of star forming regions. Recent analysis of the massive DR21 outflow, the best-studied example, has shown that H2 line emission accounts for 50% of the observed 4.5 m IRAC flux, and that the outflow morphology is almost identical in IRAC 4.5 m and narrow-band 2.122 m (H2 1-0 S(1) line) images (Davis et al., 2007; Smith et al., 2006). In S255N, the 2.122 m H2 clump S255:H2-3 lies at the base of the 4.5 m nebulosity; the H2 clump is also coincident, within reported astrometric uncertainties, with our newly-reported water maser. Both the 2.122 m H2 1-0 S(1) line and the 4.6947 m H2 0-0 S(9) line, identified by Smith et al. (2006) as the dominant contributor to IRAC band 2, trace moderate-velocity shocks (Draine, Roberge, & Dalgarno, 1983). Recent models by Smith & Rosen (2005) of shocks in dense protostellar molecular jets predict that the integrated H2 line contribution to IRAC band 2 will be 5-14 times greater than to IRAC band 1 (3.6 m), consistent with the ratio of the emission seen in these bands toward the linear 4.5 m feature. The 44 GHz Class I methanol masers, five of which lie along the 4.5 m emission feature, provide further evidence for its identification as an outflow. Kurtz, Hofner, & Álvarez (2004) found that masers of this type are often found in association with such outflow tracers as SiO (IRAS 20126+4104, G31.41+0.31 and G34.26+0.15) and H2 (IRAS 20126+4104). In G31.41+0.31, the 44 GHz methanol masers are also associated with thermal methanol emission (Kurtz, Hofner, & Álvarez, 2004), which Liechti & Walmsley (1997) found traced shock/clump interfaces in the DR21 outflow. The parallels between these examples and S255N strongly suggest that the 44 GHz methanol masers, H2CO, CH3OH, SiO, H2, and 4.5 m emission extending northeast from SMA1-NE trace a molecular outflow from a protostar, probably SMA1-NE.
At the SW position, the broad lines with strong blue wings combined with the morphology of the H2CO and CH3OH channel maps are consistent with a blueshifted outflow lobe driven by SMA1-SW. Notably, no 44 GHz methanol masers coincide with the very strong thermal CH3OH emission of the SW line peak, although elsewhere in S255N the methanol maser flux densities are loosely correlated with the strength of thermal CH3OH emission. The absence of masers towards the SW position suggests that the physical conditions are not appropriate for the collisional pumping of Class I methanol masers (Cragg et al., 1992; Plambeck & Menten, 1990).
4.3 The Nature of SMA1
The complex kinematic behavior of the molecular line emission in the vicinity of SMA1 including SMA1-NE, SMA1-SW, and position “SW” (§3.3) is difficult to explain in the context of a single protostar. Though SMA1-NE and SMA1-SW could be interpreted as the blue and red-shifted lobes, respectively, of an outflow, this scenario does not explain the very blue-shifted emission further to the southwest at position “SW”. Rotation also seems like an unlikely explanation for the velocity gradient between SMA1-NE and SMA1-SW since the gradient is parallel to the direction of the two probable outflow regions: the 4.5 m emission to the northeast and “SW” to the southwest. Instead, the combination of the chemical and kinematic differentiation between SMA1-SW and SMA1-NE suggests the presence of two individual sources, one at +7 km s-1 and one at +11.5 km s-1. To investigate this possibility, in Figure 11 we show a uniform weighted SMA millimeter continuum image restored with a beam of 10 ( times smaller than the longest observed baseline), which essentially reveals the location of the clean components. The localization of clean components into two main regions in the vicinity of SMA1 suggests the presence of at least two sources separated by 184 (4800 AU). If these two clean component peaks correspond to real dust sources, their positions are in good agreement with the two kinematically distinct formaldehyde peaks ( and ). The northeast component of the pair is also within 02 of the water maser. That two distinct protostars would exist with this separation is reasonable, as multiplicity of protostars has been observed on scales of 6,000 AU (e.g. Megeath, Wilson, & Corbin, 2005). Although the presence of two protostars is a plausible interpretation, it clearly requires higher resolution continuum observations for confirmation.
In any case, the molecular line emission from SMA1-NE and SMA1-SW is reminiscent of hot molecular cores (HMCs), particularly the detection of DCN and HC3N. These molecules–like CH3OH and H2CO, which also show strong emission towards SMA1-NE and SMA1-SW-are present in the gas phase in HMCs because they have been evaporated from grain mantles (e.g. Caselli, 2005; Szczepanski et al., 2005). Complex organic molecules such as HCOOCH3, however, are believed to be “daughter” species, formed in the gas phase by reactions of “parent” species such as H2CO and CH3OH (Caselli, 2005). Thus, while SMA1-NE and SMA1-SW do not exhibit the truly copious molecular emission observed towards some HMCs (e.g. Hatchell, Millar, & Rodgers, 1998; Schilke et al., 2006), this is consistent with SMA1-NE and SMA1-SW being very young sources, in which gas-phase hot-core chemistry has not yet produced abundant complex organic molecules.
The line emission from the SMA1 sources is unusual in that the DCN(3-2) emission is stronger than HC3N(24–23). By modeling deuterium chemistry, Roberts & Millar (2000) find that the steady-state abundance of DCN in molecular clouds is a complicated function of temperature and density (see their Figure 7), but generally higher at low metallicity. We note this because S255N is located approximately () in the direction of the Galactic anticenter, and may have lower metallicity than inner-galaxy star-forming regions (Daflon & Cunha, 2004; Afflerbach et al., 1997). Our SMA data, however, do not allow us to disentangle the effects of abundance and excitation on the strengths of DCN and HC3N emission.
The geometry of a HMC located a few arcseconds ahead of the vertex of a cometary UCH ii region has been seen in other objects observed at high angular resolution, and this notable configuration has led to much discussion on the energy source responsible for these HMCs. The best-studied case for external heating is G34.26+0.15, in which Watt & Mundy (1999) and Mookerjea et al. (2007) argue that HMC emission (characterized by complex nitrogen and oxygen-rich molecules) arises in gas heated by component C, the most evolved of three nearby UCH ii regions. In the absence of extinction, a 1.1 104 L⊙ source at the location of the 3.6 cm point source could heat SMA1-NE to 37 K, and SMA1-SW to 51 K, consistent only with the lower end of the range of plausible gas temperatures. In contrast, G29.96-0.02 is the prototype for a HMC located ahead of a cometary UCH ii region and internally heated by a high mass protostellar object (De Buizer, Osorio, & Calvet, 2005; Gibb, Wyrowski, & Mundy, 2003). In G29.96-0.02, HMC emission is coincident with a resolved 1.4 mm continuum source, water maser spots, and a mid-IR sub-arcsecond point source (De Buizer, Osorio, & Calvet, 2005; Gibb, Wyrowski, & Mundy, 2003; Olmi et al., 2003, and references therein). In S255N, the arrangement of the 1.3 mm and 3.6 cm sources along with the presence of water maser emission coincident with the molecular emission closely resembles the case of G29.96-0.02. We favor the interpretation that one or more sources younger than the excitation source of the UCH ii region are present and responsible for the compact dust and molecular line emission from SMA1, consistent with the interpretation of the hot core emission outlined above.
5 Conclusions
Our multiwavelength observations of S255N reveal significant new details in this luminous star-forming region. While the previously-identified UCH ii region dominates the cm continuum and mid-IR emission, the 1.3 mm continuum emission has been resolved into three compact cores (SMA1, SMA2, and SMA3) clustered on scales of 0.1-0.2 pc. Dominated by dust emission, these cores range in mass from 6 to 35 M☉. There are no mid-infrared point source counterparts to any of the dust cores, suggesting an early evolutionary phase. The spectral line emission at the position of the brightest core, SMA1, is spatially compact and includes HC3N, CN, DCN, CH3OH, SiO, and H2CO. SMA1 appears to be a developing hot core offset by a few thousand AU from the UCH ii region. The chemical and kinematic structure toward SMA1 is suggestive of further multiplicity at these scales. A 4.5 m linear feature emanating to the northeast of SMA1 is aligned with a cluster of methanol masers and likely traces a outflow from a protostar within SMA1. We conclude that S255N is actively forming a cluster of intermediate to high-mass stars. In addition, we speculate that some of the missing flux in the SMA continuum image could be in the form of additional compact low-mass, cold dust cores that lie below the sensitivity limit of our observations (M⊙ at K). Higher-resolution and more sensitive observations are needed to search for additional protostars in S255N and other young protoclusters. Resolving individual protostars in regions like these is a necessary task to determine how dense these young protoclusters are, and how interactions among protostars in protoclusters may affect the process of star formation.
References
- Afflerbach et al. (1997) Afflerbach, A., Churchwell, E., & Werner, M. W. 1997, ApJ, 478, 190
- Beltrán et al. (2006) Beltrán, M. T., Brand, J., Cesaroni, R., Fontani, F., Pezzuto, S., Testi, L., & Molinari, S. 2006, A&A, 447, 221
- Brand & Blitz (1993) Brand, J., & Blitz, L. 1993, A&A, 275, 67
- Caselli (2005) Caselli, P. 2005, Cores to Clusters: Star Formation with Next Generation Telescopes, 47
- Ceccarelli, Hollenbach & Tielens (1996) Ceccarelli, C., Hollenbach, D.J., & Tielens, A.G.G.M. 1996, ApJ, 471, 400
- Cragg et al. (1992) Cragg, D.M., Johns, K.P., Godfrey, P.D., Brown, R.D. 1992, MNRAS, 259, 203
- Crowther & Conti (2003) Crowther, P. A., & Conti, P. S. 2003, MNRAS, 343, 143
- Daflon & Cunha (2004) Daflon, S., & Cunha, K. 2004, ApJ, 617, 1115
- Davis et al. (2007) Davis, C.J., Kumar, M.S.N., Sandell, G., Froebrich, D., Smith, M.D., & Currie, M.J. 2007, MNRAS, 374, 29
- De Buizer, Osorio, & Calvet (2005) De Buizer, J.M., Osorio, M., Calvet, N. 2005, ApJ, 635, 452
- Draine, Roberge, & Dalgarno (1983) Draine, B.T., Roberge, W.G., & Dalgarno, A. 1983, ApJ, 264, 485
- Emerson, Klein & Haslam (1979) Emerson, D.T., Klein, U. & Haslam, C.G.T. 1979, A&A, 76, 92
- Fazio et al. (2004) Fazio et al. 2004, ApJS, 154, 10
- Georgelin, Georglein, & Roux (1973) Georgelin, Y.M., Georgelin, Y.P., & Roux, S. 1973, A&A, 25, 337
- Gibb, Wyrowski, & Mundy (2003) Gibb, A.G., Wyrowski, F., & Mundy, L.G. 2003, in SFChem 2002: Chemistry as a Diagnostic of Star Formation, ed. C.L. Curry & M. Fich (Ottawa: NRC Press), 214
- Gutermuth et al. (2005) Gutermuth, R. A., Megeath, S. T., Pipher, J. L., Williams, J. P., Allen, L. E., Myers, P. C., & Raines, S. N. 2005, ApJ, 632, 397
- Hatchell, Millar, & Rodgers (1998) Hatchell, J., Millar, T.J., & Rodgers, S.D. 1998, A&A, 332, 695
- Heyer et al. (1989) Heyer, M. H., Snell, R. L., Morgan, J., & Schloerb, F. P. 1989, ApJ, 346, 220
- Howard, Pipher & Forrest (1997) Howard, E.M., Pipher, J.L. & Forrest, W.J. 1997, ApJ, 481, 327
- Hunter, Benford & Serabyn (1996) Hunter, T.R., Benford, D.J. & Serabyn, E. 1996, PASP, 108, 1042
- Hunter & Massey (1990) Hunter, D.A. & Massey, P. 1990, AJ, 99, 846
- Itoh et al. (2001) Itoh, Y., Tamura, M., Suto, H., Hayashi, S.S., Murakawa, K., Oasa, Y., Nakajima, Y., Kaifu, N., Kosugi, G., Usuda, T., & Doi, Y. 2001, PASJ, 53, 495
- Jaffe et al. (1984) Jaffe, D. T., Davidson, J. A., Dragovan, M., & Hildebrand, R. H. 1984, ApJ, 284, 637
- Kaufman, Hollenbach, & Tielens (1998) Kaufman, M.J., Hollenbach, D.J., & Tielens, A.G.G.M. 1998, ApJ, 497, 276
- Kurtz, Hofner, & Álvarez (2004) Kurtz, S., Hofner, P., & Álvarez, C. V. 2004, ApJS, 155, 149
- Kurtz, Churchwell, & Wood (1994) Kurtz, S., Churchwell, E., & Wood, D. O. S. 1994, ApJS, 91, 659
- Lada & Lada (2003) Lada, C. J., & Lada, E. A. 2003, ARA&A, 41, 57
- Liechti & Walmsley (1997) Liechti, S. & Walmsley, C.M. 1997, A&A, 321, 625
- Malafeev et al. (2005) Malafeev, S. Y., Zinchenko, I. I., Pirogov, L. E., & Johansson, L. E. B. 2005, Astronomy Letters, 31, 239
- Mangum et al. (1991) Mangum, J. G., Plambeck, R. L., & Wootten, A. 1991, ApJ, 369, 169
- Mangum & Wootten (1993) Mangum, J.G., & Wootten, A. 1993, ApJS, 89, 123
- Megeath, Wilson, & Corbin (2005) Megeath, S. T., Wilson, T. L., & Corbin, M. R. 2005, ApJ, 622, L141
- Mezger et al. (1988) Mezger, P. G., Chini, R., Kreysa, E., Wink, J. E., & Salter, C. J. 1988, A&A, 191, 44
- Minier et al. (2005) Minier, V., Burton, M. G., Hill, T., Pestalozzi, M. R., Purcell, C. R., Garay, G., Walsh, A. J., & Longmore, S. 2005, A&A, 429, 945
- Miralles et al. (1997) Miralles, M. P., Salas, L., Cruz-Gonzalez, I., & Kurtz, S. 1997, ApJ, 488, 749
- Moffat et al. (1979) Moffat, A. F. J., Jackson, P. D., & Fitzgerald, M. P. 1979, A&AS, 38, 197
- Mookerjea et al. (2007) Mookerjea, B., Casper, B., Mundy, L.G., & Looney, L.W. 2007, astroph/#0701827
- Muench et al. (2002) Muench, A. A., Lada, E. A., Lada, C. J., & Alves, J. 2002, ApJ, 573, 366
- Olmi et al. (2003) Olmi, L., Cesaroni, R., Hofner, P., Kurtz, S., Churchwell, E., & Walmsley, C.M. 2003, A&A, 407, 225
- Ossenkopf & Henning (1994) Ossenkopf, V., & Henning, Th. 1994, A&A, 291, 943
- Plambeck & Menten (1990) Plambeck, R. L., & Menten, K. M. 1990, ApJ, 364, 555
- Rengarajan & Ho (1996) Rengarajan, T. N., & Ho, P. T. P. 1996, ApJ, 465, 363
- Richardson et al. (1985) Richardson, K. J., White, G. J., Gee, G., Griffin, M. J., Cunningham, C. T., Ade, P. A. R., & Avery, L. W. 1985, MNRAS, 216, 713
- Roberts & Millar (2000) Roberts, H., & Millar, T.J. 2000, A&A, 361, 388
- Ruiz et al. (1992) Ruiz, A., Rodriguez, L. F., Canto, J., & Mirabel, I. F. 1992, ApJ, 398, 139
- Schilke et al. (2006) Schilke, P., Comito, C., Thorwirth, S., Wyrowski, F., Menten, K. M., Güsten, R., Bergman, P., & Nyman, L.-Å. 2006, A&A, 454, L41
- Smith et al. (2006) Smith, H.A., Hora, J.L., Marengo, M., & Pipher, J.L. 2006, ApJ, 645, 1264
- Smith & Rosen (2005) Smith, M.D., & Rosen, A. 2005, MNRAS, 357, 1370
- Snell & Bally (1986) Snell, R. L., & Bally, J. 1986, ApJ, 303, 683
- Sutton et al. (1985) Sutton, E.C., Blake, G.A., Masson, C.R., & Phillips, T.G. 1985, ApJS, 58, 341
- Szczepanski et al. (2005) Szczepanski, J., Wang, H., Doughty, B., Cole, J., & Vala, M. 2005, ApJ, 626, L69
- Wang et al. (1996) Wang, N., Hunter, T.R., Benford, D.J., Serabyn, E., Lis, D.C., et al. 1996, Applied Optics, 35, 6629
- Watt & Mundy (1999) Watt, S., & Mundy, L. G. 1999, ApJS, 125, 143
- Zinchenko, Henning, & Schreyer (1997) Zinchenko, I., Henning, T., & Schreyer, K. 1997, A&AS, 124, 385
| Source | J2000 coordinates | SizeaaDeconvolved source size determined by fitting a single Gaussian component to each source. The SMA beam is (P.A.=). | bbUncertainties include 20% calibration uncertainty. | ccBrightness temperature computed using the Rayleigh-Jeans approximation. | ||
|---|---|---|---|---|---|---|
| () | () | (Jy/b) | [ ′′ ′′ (°)] | (Jy) | (K) | |
| SMA1 | 06 12 53.67 | +18 00 26.9 | 0.29 | 3.92.0 (17.4) | 1.84 | |
| SMA2 | 06 12 52.97 | +18 00 31.9 | 0.09 | 2.21.6 (97.5) | 0.82 | |
| SMA3 | 06 12 53.69 | +18 00 18.5 | 0.05 | 5.21.3 (169.6) | 0.33 | |
| Total | ||||||
| Species | Transition | Frequency | Eupper/k |
|---|---|---|---|
| (GHz) | (K) | ||
| SiO | 54 | 217.104980 | 31.2 |
| DCN | 32 | 217.238538 | 20.9 |
| H2CO | 218.222192 | 21.0 | |
| HC3N | 2423 | 218.324723 | 131 |
| CH3OH | 218.440050 | 45.5 | |
| H2CO | 218.475632 | 68.1 | |
| H2CO | 218.760066 | 68.1 | |
| CNa,ba,bfootnotemark: | 226.874191 | 16.4 | |
| CNa,ca,cfootnotemark: | 226.874781 | 16.4 | |
| CNaaThese components are blended in our spectra. | 226.875896 | 16.4 | |
| CN | 226.887420 | 16.4 | |
| CN | 226.892128 | 16.4 | |
| HC3N | 2524 | 227.418905 | 142 |
| J2000 coordinates | ||
|---|---|---|
| Name | () | () |
| SMA1-NE | 06 12 53.73 | +18 00 27.8 |
| SMA1-SW | 06 12 53.64 | +18 00 25.4 |
| SW | 06 12 53.45 | +18 00 23.0 |
| NE | 06 12 53.76 | +18 00 33.2 |
| N | 06 12 53.70 | +18 00 39.8 |
| NW | 06 12 52.86 | +18 00 36.2 |
| H2CO(–) | CH3OH | DCN | HC3N(24-23) | |||||||||
|---|---|---|---|---|---|---|---|---|---|---|---|---|
| Position | Center | Width | Center | Width | Center | Width | Center | Width | ||||
| km s-1 | km s-1 | Jy b-1*km s-1 | km s-1 | km s-1 | Jy b-1*km s-1 | km s-1 | km s-1 | Jy b-1*km s-1 | km s-1 | km s-1 | Jy b-1*km s-1 | |
| SMA1-NE | 6.9(0.3)aaNot well fit by a single Gaussian. | 5.9(0.6)aaNot well fit by a single Gaussian. | 5.5(0.7)aaNot well fit by a single Gaussian. | 6.6(0.3)ccThis transition is used to set the velocity scale for CN in Fig 8. | 3.4(0.9)ccParameters for second-strongest velocity component. Strongest component is very similar to that towards SMA1-SW. | 0.9(0.3)ccParameters for second-strongest velocity component. Strongest component is very similar to that towards SMA1-SW. | 8.2(0.1) | 3.3(0.2) | 5.2(0.4) | 6.3(0.3)aaNot well fit by a single Gaussian. | 3.5(0.8)aaNot well fit by a single Gaussian. | 1.9(0.6)aaNot well fit by a single Gaussian. |
| SMA1-SW | 12.1(0.1) | 2.9(0.2) | 4.2(0.3) | 11.2(0.1) | 2.4(0.2) | 3.1(0.4) | 10.7(0.3)bbThe CN hyperfine components at frequencies lower than this one lie outside of our observed bandpass. | 5.6(0.7)bbGaussian fit encompasses two blended components. | 3.1(0.5)bbGaussian fit encompasses two blended components. | 9.5(0.8)aaNot well fit by a single Gaussian. | 11.2(2.1)aaNot well fit by a single Gaussian. | 3.0(0.7)aaNot well fit by a single Gaussian. |
| SW | 6.3(0.1) | 9.2(0.4) | 24.3(1.2) | 7.8(0.1) | 6.9(0.3) | 13.4(0.8) | ||||||
| NE | 8.3(0.1) | 2.9(0.3) | 2.4(0.4) | 8.3(0.2) | 2.5(0.4) | 1.6(0.4) | ||||||
| N | 11.5(0.1) | 2.6(0.3) | 2.4(0.3) | 10.1(0.2) | 2.5(0.5) | 1.5(0.4) | ||||||
| NW | 8.9(0.2) | 5.8(0.6) | 5.3(0.7) | 8.3(0.2)aaNot well fit by a single Gaussian. | 5.7(0.5)aaNot well fit by a single Gaussian. | 3.7(0.5)aaNot well fit by a single Gaussian. | ||||||
| bbBeam-averaged quantities.The SMA beam is (P.A.=). | bbBeam-averaged quantities.The SMA beam is (P.A.=). | |||||
|---|---|---|---|---|---|---|
| SourceaaAssumed distance is 2.6 kpc. | (cm2 g-1) | (K) | (1.3mm) | () | (1023cm-2) | (106cm-3) |
| SMA1ccThe mass of SMA1 was calculated using the 1.3 mm flux density less the estimated free-free contribution of 20 mJy. | 1 | 40-100 | 0.04-0.02 | 35-13 | 10.5-3.8 | 15.9-5.8 |
| SMA2 | 1 | 20-40 | 0.02-0.01 | 17-7 | 5.0-2.2 | 7.6-3.3 |
| SMA3 | 1 | 20-40 | 0.01-0.01 | 13-6 | 3.9-1.7 | 5.9-2.5 |
| Total | 65-26 |