X-ray Timing Observations of PSR J19301852 in the Crab-like SNR G54.10.3
Abstract
We present new X-ray timing and spectral observations of PSR J19301852, the young energetic pulsar at the center of the non-thermal supernova remnant G54.10.3. Using data obtained with the Rossi X-ray Timing Explorer (RXTE) and Chandra X-ray observatories we have derived an updated timing ephemeris of the 136 ms pulsar spanning 6 years. During this interval, however, the period evolution shows significant variability from the best fit constant spin-down rate of s s-1, suggesting strong timing noise and/or glitch activity. The X-ray emission is highly pulsed ( modulation) and is characterized by an asymmetric, broad profile ( duty cycle) which is nearly twice the radio width. The spectrum of the pulsed emission is well fitted with an absorbed power law of photon index ; this is marginally harder than that of the unpulsed component. The total keV flux of the pulsar is erg cm-2 s-1. These results confirm PSR J19301852 as a typical Crab-like pulsar.
1 Introduction
Young rotation-powered pulsars typically radiate a large fraction of their spin-down energy at X-ray energies. Observations in this band are thus important to the study of the spin-down evolution of such pulsars and their emission mechanism(s). The study also helps to understand the mechanical energy output of the pulsars into their surroundings, manifested as pulsar wind nebulae (PWNe). To this end, one needs to monitor the spin-down at various evolutionary stages of young pulsars and to measure their energy spectra, both pulsed and unpulsed, with various viewing angles. However, only a dozen or so of young pulsars with PWNe have been identified and studied in detailed so far.
The recently discovered 136 ms pulsar PSR J19301852 at the center of the supernova remnant (SNR) G54.10.3 is the latest example of a Crab-like pulsar (Camilo et al. 2002). Known as the “Bulls-Eye” pulsar, PSR J19301852 is surrounded by a bright symmetric ring of emission (Lu et al. 2002) similar to the toroidal and jet-like structure associated with the Crab pulsar, but viewed nearly face-on. Based on the initial timing parameters, PSR J19301852 is the eighth most energetic pulsar known, with a rotational energy loss rate of erg s-1, well above the empirical threshold for generating a bright pulsar wind nebula ( erg s-1, Gotthelf 2004). Such young pulsars are often embedded in observable shell-type remnant which have yet to dissipate. However, like the Crab, G54.1+0.3 lacks evidence for a thermal remnant in any waveband (Lu et al. 2002). Most likely, the SN ejecta in these two remnants are still expanding into a very low density medium.
In this paper we present the first dedicated X-ray timing and spectral follow-up observations of PSR J19301852 since discovery. Previous X-ray results were based on archival data of limited quality. We use the new data to characterize the pulse shape and energy spectrum and provide a long term ephemeris. Throughout the paper, the uncertainties (statistical fluctuation only) are quoted at the 68% confidence level.
2 Observations and Data Analysis
The pulsar PSR J19301852 was observed twice with RXTE on 2002 September 12 – 14 and on 2002 December 23 – 25 using a combination of event and instrument modes. For consistency, we analyze the data taken with the proportional counter array (PCA) in the Good Xenon mode. PCA has a field of view of 1 (FWHM), total collecting area of about 6500 cm2, time resolution of 1 s, and spectral resolution of at 6 keV. The data are reduced and analyzed using the ftools software package version v5.2. We filter the data using the standard RXTE criteria, selecting time intervals for which parameters , min, , and the background electron rate . The effective exposure time after this filtering is 31.7 ks and 41.7 ks for the September and December observations. Since the background of RXTE is high and the spectral resolution is relatively low, the RXTE data is used herein exclusively for timing analysis, selecting photons detected from PCA PHA channels ( keV). This results in a total of and million counts in the two observations for the subsequent analysis. The photon arrival times are corrected to the Solar system barycenter, based on the DE200 Solar ephemeris time system and the Chandra J2000 coordinates of J193030.13+185214.1 (Lu et al. 2002).
SNR G54.10.3 was also observed with Chandra on 2003 June 30 for a total of 58.4 ks. The pulsar was placed at the aim-point of the front-illuminated ACIS-I detector. The CCD chip I3 was operated in continuous-clocking mode (CC-mode), providing a time resolution of 2.85 ms and an one-dimensional imaging, in which the 2-D CCD image is integrated along the column direction in each CCD readout cycle. The photon arrival times are post-processed to account for the spacecraft dithering and SIM motion prior to the barycenter correction. The spectral data are corrected for the effects of CTI (Charge Transfer Inefficiency). However, the spectral gain is not well calibrated in the CC-mode, requiring adjustment in the fitting process (details are given in §3). Spectral response matrices are generated for the ACIS-I aimpoint, the location of the pulsar in this observation. After filtering the data using the standard criteria, the remaining effective exposure is 57.2 ks. Reduction and analysis of the Chandra data are all based on the standard software package CIAO (v3.2) and CALDB (v3.0.0).
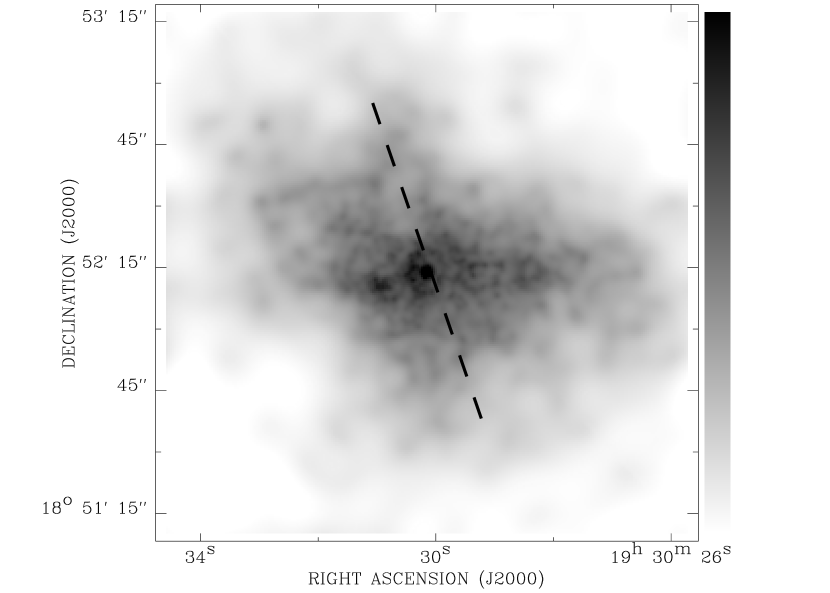
Figure 1 presents the geometry of the CC-mode observation overlaid on an archival Chandra X-ray image of SNR G54.1+0.3. The CCD image is summed along the dimension perpendicular to the marked line which is orientated with a position angle East of North. The count distribution along this dimension is shown in Figure 2. The central peak corresponds to the presence of the pulsar, which significantly contributes to the six adjacent pixels, as denoted by the upper horizontal bar. The neighboring four pixels (two on each side of the pulsar region), marked by the two lower horizontal bars, show the nearly same intensity level in the ACIS-I3 image-mode data with the pulsar excised. We therefore select counts falling in the inner six pixels for both our pulsar timing and spectral analysis of the pulsar, while those counts in the outer four pixels are used to estimate the background from the surrounding nebula.

3 Results
3.1 Pulsar Timing
For each observation, we search for the periodic signal of PSR J19301852 by folding events around the period extrapolated from the early radio ephemeris of Camilo et al (2002). For each period folding with a period , a is calculated from the fit to the pulse profile with a constant count rate. The null hypothesis of no periodic signal can be ruled out when a significant peak is seen in the resultant “periodogram” ( vs. ), which is the case for each of the X-ray observations at a high confidence ( for 10 phase bins). We further fit the peak shape with a Gaussian profile to maximize the accuracy of our pulsar period determination (Figure 3). The centroid of this Gaussian is then taken as the best estimate of the pulsar period. The light curves derived of the RXTE and Chandra observations folded at the measured periods are shown in Figures. 4–5.
To estimate the uncertainties in the period measurements, we use the bootstrap technique of Diaconis & Efron (1983). This is done as the following: (1) constructing a new data set of the same total number of counts by re-sampling with replacement from the observed events; (2) determining the period with this re-sampled data set in the exactly same way as with the original data; (3) repeating the above two steps for 500 times to produce a period distribution; (4) Using the dispersion of this distribution as an estimate of the 1 period uncertainty. The distributions produced for the three observations are shown in the right column of Figure 3, while the estimated uncertainties are included in Table 1.


To compute the pulsed fraction of the X-ray emission from PSR J19301852, we used the Chandra observation. We extracted a total of 5506 counts in the keV band from the on-pulsar pixels of the 1-D count distribution (the solid curve in Figure 2). After subtracting the local nebular contribution estimated from the neighboring off-pulsar pixels, the remaining 356092 counts are considered as the net total emission from the pulsar. This emission can be further divided into the pulsed and persistent components. To determine the persistent component, we construct a 1-D distribution of the persistent emission from the off-pulse counts, defined to be in the phase interval (Figure 5). The same on-pulsar pixels as shown in Figure 2 now contain a total of 598 counts, Corrected for the off-pulse phase fraction (1/5), the total number of persistent counts over the entire phase is then 5985. Therefore, the net number of the pulsed counts is (5506-5985)=2516143. This results in a pulsed fraction of .

| Date | Obs. Type | Epoch | Period |
|---|---|---|---|
| (UT) | (MJD[TDB]) | (s) | |
| 1997 Apr 27 | ASCA | 50566 | 0.13674374(5)aaTaken from Camilo et al. (2002) |
| 2002 Jan 17 | Radio | 52280 | 0.136855046957(9)aaTaken from Camilo et al. (2002) |
| 2002 Sep 12 | RXTE | 52530 | 0.136871312(4) |
| 2002 Dec 23 | RXTE | 52632 | 0.136877919(3) |
| 2003 Jun 30 | Chandra | 52820 | 0.136890130(5) |
3.2 Pulsed Emission Spectral Characteristics
To check for phase-dependent spectral variations across the pulse profile we compute the hardness ratio in each phase bin, defined as , where and are the counts selected from the keV and keV energy bands, respectively. The pulsar counts (pulsed and unpulsed) are extracted from the 6 pixel source region as discussed in §2 and the background from the neighboring 4 pixels. The calculated is shown in the lower panel of Figure 5. Fitting these data points assuming a constant value resulted in a of 17.94 for 9 degrees of freedom, which means that the hardness ratio changes with phase at a confidence level of 96.4. Further more, it appears that the values of the on pulse emission are higher than those of the off-pulse emission. In order to quantify this, we computed the mean for the off-pulse emission (bins 1, 2 3 and 10 in the panel) as and the on-pulse bins (4 to 9) as . Therefore, the on-pulse emission is harder than the off-pulse emission at a confidence level of , or 98.
Next, we study the Chandra spectrum of PSR J1930+1852 using the same sources and background counts as extracted above. For the pulsed spectrum, the phase width corrected off-pulse counts are subtracted from the on-pulse counts in each spectral bin. Figure 6a presents the best fit absorbed power-law model using the standard response matrix. Although the overall is acceptable (34.4 for 35 degree-of-freedom), the residuals to this fit display characteristic feature, indicating that the gain of the response function is not properly calibrated for the CC-mode. Following the method suggested by Kaaret et al. (2001) we calibrate the gain offset and scale in XSPEC by comparing the overall CC-mode spectra of PSR J19301852 to that determined by the ACIS-S3 imaging data. The latter is characterized by the same model with the absorption column density cm-2 and a photon index (Camilo et al. 2002). The resulting gain scale and offset are found to be 0.90 and -0.18, respectively. Fixing this gain correction and to the above values, we re-fit the pulsed emission spectrum to obtain a photon index of (see Figure 6b). The new value is 17.7 for 34 degree-of-freedom, significantly better than without the gain correction. The pulsed flux measured in the keV energy band is ergs cm-2 s-1. When compared to the overall keV flux of ergs cm-2 s-1 (Camilo et al. 2002), this implies that of the total emission from the pulsar is pulsed, consistent with the estimate in Section 3.1.

4 Discussion
The properties of PSR J19301852 are most similar to those found for other examples of young, energetic pulsars. The power-law spectral index of the pulsar emission is consistent with its spin-down energy according to the empirical law of Gotthelf (2003) for energetic rotation powered pulsars with erg s-1. The power law index is also consistent with that of the pulsed emission, as found for other high , Crab-like pulsars (Gotthelf 2003). As with most X-ray detected radio pulsars, the X-ray pulse morphology differs from that of the radio pulse. The full width at half maximum (FWHM) of the X-ray pulse is 0.4 phase compared to 0.15 phase in radio. Notably, the X-ray pulse has a steep rise and slow decline, whereas the radio pulse is inverted, with a slow rise and steep decay instead.
The unpulsed component of PSR J19301852 is most likely nonthermal in nature as the thermal emission from the cooling surface of the neutron star should be negligible. According to the standard theoretical cooling curves, the surface temperature of a 1.4 M neutron star is about 0.13 keV at the age of PSR J19301852 (about 3,000 years; Page 1998). Assuming a radius of 12 km the neutron star should have an absorbed keV flux of erg cm-2 s-1, which accounts for 0.4% of our detected total keV X-ray flux or 1.4% of the unpulsed flux. Tennant et al. (2001) detected the X-ray emission of the Crab pulsar at its pulse minimum, though accounting for only a tiny fraction of the total or unpulsed flux. Tennant et al. (2001) further suggested that this component is nonthermal. The unpulsed X-ray emission from PSR J19301852 may be of the same nature as that of the Crab pulsar.
Together with the previous X-ray and radio periods, the three timing measurements obtained herein provide an opportunity to study the pulsar period evolution. A linear fit to these periods yields a of 7.5116(6) s s-1 with a reduced of 3.6 (see Figure 7). The large value and the scattered residuals show that the period of PSR J19301852 evolves in a more complicated than a simply constant spin down. The period derivative obtained here is also significantly () different from that obtained by Camilo et al. (2002). This suggests that PSR J19301852 has experienced periods of timing noise and/or glitches - not unepxected for a young pulsar (e.g., Zhang et al. 2001; Wang, et al. 2001; Crawford & Demiańsky 2003). Arzoumanian et al. (1994) defined a quantity to represent the stability of a pulsar. They found an empirical relation between and , which predicts a high of -0.67 for PSR J1930+1852. This value is higher than those measured for most ordinary pulsars and is consistent with the variability in spin-down rate observed for this pulsar.

Indeed, PSR J19301852 shares other interesting properties with PSR B0540-69. For example, the pulsed X-ray emission of PSR B0540-69 has probably a harder spectrum, with a photon index of , than the steady component whose photon index is (; Kaaret et al. 2001), whereas PSR J19301852 also has a harder pulsed emission than the steady emission. Furthermore, the pulse width of PSR B0540-69 is about 0.4 and its pulsed fraction , both nearly identical to the respective values measured herein for PSR J19301852. Based on these X-ray emission similarities, the X-ray emission regions of the two pulsars may have the similar overall structures and viewing geometries.
References
- Arzoumanian (1994) Arzoumanian, Z., Nice, D.J., Taylor, J.H., & Thorestt, S.E. 1994, ApJ, 422, 671
- Camilo (2002) Camilo, F., Lorimer, D.R., Bhat, N.D.R., Gotthelf, E.V., Halpern, J.P., Wang, Q.D., Lu, F.J., & Mirabal, N. 2002, ApJ, 574, L71
- Crawford (2003) Crawford, F., & Demiański, M. 2003, ApJ, 595, 1052
- Diaconis (1983) Diaconis, P., & Efron, B. 1983, Scientific American, May P96
- Gotthelf (2003) Gotthelf, E. V. 2003, ApJ, 591, 361
- Gotthelf (2004) Gotthelf, E. V. 2004, in “Young Neutron Stars and Their Environments”, IAU Symp. 218. Ed. F. Camilo & B. M. Gaensler (S.F. CA.: ASP) 2004, 218, 225
- Kaaret (2001) Kaaret, P., et al. 2001, ApJ, 546, 1159
- Lu (2002) Lu, F.J., Wang, Q.D., Aschenbach, B., Durouchoux, P., & Song, L.M. 2002, ApJ, 568, L49
- Mi (2002) Middleditch, J., et al. 2006, ApJ, 652, 1531
- Page (1998) Page, D. 1998, in The Many Faces of Neutron Stars ed. R. Buccheri, J. van Paradijs, & M.A. Alpar (Dordrecht: Kluwer), 539
- Tennant (2001) Tennant, A.F., et al. 2001, ApJ, 554, L173
- Wang (2001) Wang, N., Wu, X.J., Manchester, R.N., et al. 2001, Chin. J. Astron. Astrophys., 1, 195
- Zhang (2001) Zhang, W., Marshall, F.E., Gotthelf, E.V., Middleditch, J., & Wang, Q.D. 2001, ApJ, 554, L177