The Sloan Digital Sky Survey Quasar Catalog IV. Fifth Data Release
Abstract
We present the fourth edition of the Sloan Digital Sky Survey (SDSS) Quasar Catalog. The catalog contains 77,429 objects; this is an increase of over 30,000 entries since the previous edition. The catalog consists of the objects in the SDSS Fifth Data Release that have luminosities larger than (in a cosmology with = 70 km s-1 Mpc-1, = 0.3, and = 0.7), have at least one emission line with FWHM larger than 1000 km s-1 or have interesting/complex absorption features, are fainter than , and have highly reliable redshifts. The area covered by the catalog is 5740 deg2. The quasar redshifts range from 0.08 to 5.41, with a median value of 1.48; the catalog includes 891 quasars at redshifts greater than four, of which 36 are at redshifts greater than five. Approximately half of the catalog quasars have ; nearly all have . For each object the catalog presents positions accurate to better than 0.2′′ rms per coordinate, five-band () CCD-based photometry with typical accuracy of 0.03 mag, and information on the morphology and selection method. The catalog also contains basic radio, near-infrared, and X-ray emission properties of the quasars, when available, from other large-area surveys. The calibrated digital spectra cover the wavelength region 3800–9200 Å at a spectral resolution of 2000; the spectra can be retrieved from the public database using the information provided in the catalog. The average SDSS colors of quasars as a function of redshift, derived from the catalog entries, are presented in tabular form. Approximately 96% of the objects in the catalog were discovered by the SDSS.
1 Introduction
This paper describes the Fourth Edition of the Sloan Digital Sky Survey (SDSS; York et al. 2000) Quasar Catalog. Previous versions of the catalog (Schneider et al. 2002, 2003, 2005; hereafter Papers I, II, and III) were published with the SDSS Early Data Release (EDR; Stoughton et al. 2002), the SDSS First Data Release (DR1; Abazajian et al. 2003), and the SDSS Third Data Release (DR3; Abazajian et al. 2005), and contained 3,814, 16,713, and 46,420 quasars, respectively. The current catalog is the entire set of quasars from the SDSS-I Quasar Survey; the SDSS-I was completed on 30 June 2005 and the Fifth Data Release (DR5; Adelman-McCarthy et al. 2007) was made public on 30 June 2006. The catalog contains 77,429 quasars, the vast majority of which were discovered by the SDSS. The SDSS Quasar Survey is continuing via the SDSS-II Legacy Survey, which is is an extension of the SDSS-I.
The catalog in the present paper consists of the DR5 objects that have a luminosity larger than (calculated assuming an = 70 km s-1 Mpc-1, = 0.3, = 0.7 cosmology [Spergel et al. 2006], which will be used throughout this paper), and whose SDSS spectra contain at least one broad emission line (velocity FWHM larger than 1000 km s-1) or have interesting/complex absorption-line features. The catalog also has a bright limit of . The quasars range in redshift from 0.08 to 5.41; 78% have redshifts below 2.0.
The objects are denoted in the catalog by their DR5 J2000 coordinates; the format for the object name is SDSS Jhhmmss.ss+ddmmss.s. Since the image data used for the astrometric information can change between data releases (e.g., a region with poor seeing that is included in an early release is superseded by a newer observation in good seeing), the coordinates for an object can change at the 0.1′′ to 0.2′′ level; hence the designation of a given source can change between data releases. Except on very rare occasions (see §5.1), this change in position is much less than 1′′. When merging SDSS Quasar Catalogs with previous databases one should always use the coordinates, not object names, to identify unique entries.
The DR5 catalog does not include classes of Active Galactic Nuclei (AGN) such as Type 2 quasars, Seyfert galaxies, and BL Lacertae objects; studies of these sources in the SDSS can be found in Zakamska et al. (2003) (Type 2), Kauffmann et al. (2003) and Hao et al. (2005) (Seyferts), and Collinge et al. (2005) and Anderson et al. (2007) (BL Lacs). Spectra of the highest redshift SDSS quasars (; e.g., Fan et al. 2003, 2006a) were not acquired as part of the SDSS quasar survey (the objects were identified as candidates in the SDSS imaging data, but the spectra were not obtained with the SDSS spectrographs), so they are not included in the catalog.
The observations used to produce the catalog are presented in Section 2; the construction of the catalog and the catalog format are discussed in Sections 3 and 4, respectively. Section 5 presents an overview of the catalog, and a summary is given in Section 6. The catalog is presented in an electronic table in this paper and can also be found at an SDSS public web site.111http://www.sdss.org/dr5/products/valueadded/qsocatdr5.html
2 Observations
2.1 Sloan Digital Sky Survey
The Sloan Digital Sky Survey uses a CCD camera (Gunn et al. 1998) on a dedicated 2.5-m telescope (Gunn et al. 2006) at Apache Point Observatory, New Mexico, to obtain images in five broad optical bands (; Fukugita et al. 1996) over approximately 10,000 deg2 of the high Galactic latitude sky. The survey data-processing software measures the properties of each detected object in the imaging data in all five bands, and determines and applies both astrometric and photometric calibrations (Pier et al., 2003; Lupton et al. 2001; Ivezić et al. 2004). Photometric calibration is provided by simultaneous observations with a 20-inch telescope at the same site (see Hogg et al. 2001, Smith et al. 2002, Stoughton et al. 2002, and Tucker et al. 2006). The SDSS photometric system is based on the AB magnitude scale (Oke & Gunn 1983).
The catalog contains photometry from 204 SDSS imaging runs acquired between 19 September 1998 (Run 94) and 13 May 2005 (Run 5326).
2.2 Target Selection
The SDSS filter system was designed to identify quasars at redshifts between zero and approximately six; most quasar candidates are selected based on their location in multidimensional SDSS color-space. The Point Spread Function (PSF) magnitudes are used for the quasar target selection, and the selection is based on magnitudes and colors that have been corrected for Galactic extinction (using the maps of Schlegel, Finkbeiner, & Davis 1998). An magnitude limit of 19.1 is imposed for candidates whose colors indicate a probable redshift of less than 3.0 (selected from the color cube); high-redshift candidates (selected from the color cube) are accepted if and the source is unresolved. The errors on the measurements are typically 0.02–0.03 and 0.03–0.04 magnitudes at the brighter and fainter limits, respectively. In addition to the multicolor selection, unresolved objects brighter than that lie within 2.0′′ of a FIRST radio source (Becker, White, & Helfand 1995) are also identified as primary quasar candidates. Target selection also imposes a maximum brightness limit () on quasar candidates; the spectra of objects that exceed this brightness could contaminate the adjacent spectra on the detectors of the SDSS spectrographs. A detailed description of the quasar selection process and possible biases can be found in Richards et al. (2002a).
The primary sample described above was supplemented by quasars that were targeted by the following SDSS spectroscopic target selection algorithms: Galaxy and Luminous Red Galaxy (Strauss et al. 2002 and Eisenstein et al. 2001), X-ray (object near the position of a ROSAT All-Sky Survey [RASS; Voges et al. 1999, 2000] source; see Anderson et al. 2003), Star (point source with a color typical of an interesting class of star), or Serendipity (unusual color or FIRST matches). The SDSS is designed to be complete in the Galaxy, Luminous Red Galaxy and Quasar programs, (in practice various limitations reduce the completeness to about 90%) but no attempt at completeness was made for the other categories. Most of the DR5 quasars that fall below the magnitude limits of the quasar survey were selected by the serendipity algorithm (see §5).
While the bulk of the catalog objects targeted as quasars were selected based on the algorithm of Richards et al. (2002a), during the early years of the SDSS the quasar selection software was undergoing constant modification to improve its efficiency. All of the sources in Papers I and II, and some of the Paper III objects, were not identified with the final selection algorithm. Once the final target selection software was installed, the algorithm was applied to the entire SDSS photometric database. Each DR5 quasar has two spectroscopic target selection flags listed in the catalog: BEST, which refers to the final algorithm, and TARGET, which is the target flag used in the actual spectroscopic targeting. There are also two sets of photometric measurements for each quasar: BEST, which refers to the measurements with the latest photometric software on the highest quality data, and TARGET, which are the values used at the time of the spectroscopic target selection.
Extreme care must be exercised when constructing statistical samples from this catalog; if one uses the values produced by only the latest version of the selection software, not only must one drop the catalog quasars that were not identified as quasar candidates by the final selection software, one must also account for quasar candidates produced by the final version that were not observed in the SDSS spectroscopic survey (this can occur in regions of sky whose spectroscopic targets were identified by early versions of the selection software). The selection for the UV-excess quasars, which comprise the majority ( 80%) of the objects in the DR5 Catalog, has remained reasonably uniform; the changes to the selection algorithm were primarily designed to increase the effectiveness of the identification of quasars. Extensive discussion of the completeness and efficiency of the selection can be found in Richards et al. (2002a) and Vanden Berk et al. (2005); Richards et al. (2006) describes the process for the construction of statistical SDSS quasar samples (see also Adelman-McCarthy et al. 2007). The survey efficiency (the ratio of quasars to quasar candidates) for the ultraviolet excess-selected candidates, which comprise the bulk of the quasar sample, is about 77%. (The catalog contains information on which objects can be used in a uniform sample; see Section 4.)
2.3 Spectroscopy
Spectroscopic targets chosen by the various SDSS selection algorithms (i.e., quasars, galaxies, stars, serendipity) are arranged onto a series of 3∘ diameter circular fields (Blanton et al. 2003). Details of the spectroscopic observations can be found in York et al. (2000), Castander et al. (2001), Stoughton et al. (2002), and Paper I. A total of 1458 spectroscopic fields, taken between 5 March 2000 and 14 June 2005, provided the quasars for the DR5 quasar catalog; the locations of the plate centers can be found from the information given by Adelman-McCarthy et al. (2007). The DR5 spectroscopic program attempted to cover, in a well-defined manner, an area of 5740 deg2. Spectroscopic plate 716 was the first spectroscopic observation that was based on the final version of the quasar target selection algorithm of Richards et al. (2002a); the detailed tiling information in the SDSS database must be consulted to identify those regions of sky targeted with the final selection algorithm (see Richards et al. 2006).
The two SDSS double spectrographs produce data covering 3800–9200 Å at a spectral resolution of 2000. The data, along with the associated calibration frames, are processed by the SDSS spectroscopic pipeline (see Stoughton et al. 2002). The calibrated spectra are classified into various groups (e.g., star, galaxy, quasar), and redshifts are determined by two independent software packages. Objects whose spectra cannot be classified by the software are flagged for visual inspection. Figure 1 shows the calibrated SDSS spectra of four previously unknown catalog quasars representing a range of properties. The processed DR5 spectra have not been corrected for Galactic extinction.
3 Construction of the SDSS DR5 Quasar Catalog
The quasars in the catalog were drawn from three sets of SDSS observations: 1) the primary survey area, 2) “Bonus” plates, which are spectroscopic observations of regions near to, but outside of, the primary survey area, and 3) “Special” plates, where the spectroscopic targets were not chosen by the standard SDSS target selection algorithms (e.g., a set of plates to investigate the structure of the Galaxy; see Adelman-McCarthy et al. 2006).
The DR5 quasar catalog was constructed, as were the previous editions, in three stages: 1) Creation of a quasar candidate database, 2) Visual examination of the spectra of the quasar candidates, and 3) Application of luminosity and emission-line velocity width criteria. All three tasks were initially done without reference to the material in the previous SDSS Quasar Catalogs, although the results of each task were compared to the Paper III database (e.g., the construction of the quasar database was not viewed as complete until it was understood why any Paper III quasars were not included).
3.1 Creation of the DR5 Quasar Candidate Database
This catalog of bona-fide quasars, that have redshifts checked by eye and luminosities and line widths that meet the formal quasar definition, is constructed from a larger “master” table of confirmed quasars and quasar candidates. This master table was created using an SQL query to the public SDSS-DR5 database (i.e., the Catalog Archive Server [CAS]; http://cas.sdss.org/astrodr5/). Two versions of the photometric database exist, which contain the properties of objects when targeted for spectroscopic observations (TARGET) and as determined in the latest processing (BEST). These databases are divided into multiple tables and subtables to facilitate access to only the most relevant data for a particular use. In the case of the quasar catalog construction, we have made use of the PhotoObjAll and SpecObjAll tables, which contain, respectively, the photometric information for all SDSS sources and for all SDSS spectra. In the case of PhotoObjAll, both the TARGET and BEST versions are queried. These tables include duplicate observations of objects and observations of objects that lie outside of the formal SDSS area (as compared to the PhotoObj and SpecObj tables, which include only sources in the formal SDSS area), and are the most complete database files. For example, in PhotoObjAll, two (or more) observations of a single object may exist; if so, one is classified as PRIMARY, the other(s) as SECONDARY.
This master table contains all objects identified as quasar candidate targets for spectroscopy in either the TARGET or BEST photometric databases. Quasar candidates are those objects which have had one or more of the following flags set by the algorithm described by Richards et al. (2002a):
TARGET_QSO_HIZ OR TARGET_QSO_CAP OR
TARGET_QSO_SKIRT OR TARGET_QSO_FIRST_CAP
OR TARGET_QSO_FIRST_SKIRT
( = 0x0000001F, except for the “special” plates [see Adelman-McCarthy et al. 2006, 2007], where additional care is required in interpreting the flags).
Objects flagged as TARGET_QSO_MAG_OUTLIER and TARGET_QSO_REJECT are not included, as these flags are meant only for diagnostic purposes. (In the CAS documentation and the EDR paper, TARGET_QSO_MAG_OUTLIER is called TARGET_QSO_FAINT.) Furthermore, the master table includes any objects with spectra that have been classified by the spectroscopic pipeline as quasars (specClass=QSO or HIZ_QSO), that have UNKNOWN type, or that have redshifts greater than 0.6. (On rare occasions the spectroscopic pipeline measures the correct redshift for a quasar but classifies the object as a galaxy.)
The query was run on the union of the database tables Target..PhotoObjAll, Best..SpecObjAll, and Best..PhotoObjAll. Multiple entries for a given object are retained at this stage.
Ten objects in the DR3 Quasar Catalog were missed by this query. One omission was due to an “unmapped” fiber (a spectrum of a quasar was obtained, but because of a failure in the mapping of fiber number to location in the sky, we are no longer certain of the celestial position of the object); the other nine were low-redshift AGN that were not classified as quasars by the spectroscopic pipeline (this result provides an estimate of the incompleteness produced by the query). We were able to identify the information for all ten quasars in the database and add the material to the master table.
Four automated cuts were made to the master table database of 329,884 candidates 222The master table is known as the QSOConcordanceALL table, which can be found in the SDSS database; see http://cas.sdss.org/astrodr5/en/help/browser/description.asp?n=QsoConcordanceAll&t=U.: 1) Objects targeted as quasars but whose spectra had not yet been obtained by the closing date of DR5 (124,447 objects), 2) Candidates classified with high confidence as “stars” by the spectroscopic pipeline that had redshifts less than 0.002 (33,653), 3) Objects whose photometric measurements have not been loaded into the CAS (3106) and 4) Multiple spectra (coordinate agreement better than 1.0′′) of the same object (40,007). In cases of duplicate spectra of an object, the “science primary” spectrum is selected (i.e., the spectrum was obtained as part of normal science operations); when there is more than one science primary observation (or when none of the spectra have this flag set), the spectrum with the highest signal-to-noise ratio (S/N) is retained (see Stoughton et al. 2002 for a description of the science primary flag). These actions produced a list of 128,671 unique quasar candidates.
3.2 Visual Examination of the Spectra
The SDSS spectra of the remaining quasar candidates were manually inspected by several of the authors (DPS, PBH, GTR, MAS, and SFA); as in previous papers in this series, we found that the spectroscopic pipeline redshifts and classifications of the overwhelming majority of the objects are accurate. Tens of thousands of objects were dropped from the list because they were obviously not quasars (these objects tended to be low S/N stars, unusual stars, and a mix of absorption-line and narrow emission-line objects); this large number of candidates that are not quasars is due to the inclusive nature of our initial database query. Spectra for which redshifts could not be determined (low signal-to-noise ratio or subject to data-processing difficulties) were also removed from the sample. This visual inspection resulted in the revisions of the redshifts of 863 quasars; the changes in the individual redshifts were usually quite substantial, due to the spectroscopic pipeline misidentifying emission lines.
An independent determination of the redshifts of 5,865 quasars with redshifts larger than 2.9 in the catalog was performed by Shen et al. (2007). The redshift differences between the two sets of measurements follow a Gaussian distribution (with slightly extended wings), with a mean of 0.002 and a dispersion of 0.01.
The catalog contains numerous examples of extreme Broad Absorption Line (BAL) Quasars (see Hall et al. 2002); it is difficult if not impossible to apply the emission-line width criterion for these objects, but they are clearly of interest, have more in common with “typical” quasars than with narrow-emission line galaxies, and have historically been included in quasar catalogs. We have included in the catalog all objects with broad absorption-line spectra that meet the luminosity criterion.
3.3 Luminosity and Line Width Criteria
As in Papers II and III, we adopt a luminosity limit of . The absolute magnitudes were calculated by correcting the BEST measurement for Galactic extinction (using the maps of Schlegel, Finkbeiner, & Davis 1998) and assuming that the quasar spectral energy distribution in the ultraviolet-optical can be represented by a power law (), where = (Vanden Berk et al. 2001). (In the 134 cases where BEST photometry was not available, the TARGET measurements were substituted for the absolute magnitude calculation.) This approach ignores the contributions of emission lines and the observed distribution in continuum slopes. Emission lines can contribute several tenths of a magnitude to the k-correction (see Richards et al. 2006), and variations in the continuum slopes can introduce a magnitude or more of error into the calculation of the absolute magnitude, depending upon the redshift. The absolute magnitudes will be particularly uncertain at redshifts near and above five, when the Lyman emission line (with a typical observed equivalent width of Å) and strong Lyman forest absorption enter the bandpass.
Quasars near the = luminosity limit are often not enormously brighter in the -band than the starlight produced by the host galaxy. Although the PSF-based SDSS photometry presented in the catalog are less susceptible to host galaxy contamination than are fixed-aperture measurements, the nucleus of the host galaxy can still contribute appreciably to this measurement for the lowest luminosity entries in the catalog (see Hao et al. 2005). An object of will reach the “low-redshift” selection limit at a redshift of 0.4.
After visual inspection and application of the luminosity criterion had reduced the number of quasar candidates to under 80,000 objects, the remaining spectra were processed with an automated line-measuring routine. The spectra for objects whose maximum line width was less than 1000 km s-1 were visually examined; if the measurement was deemed to be an accurate reflection of the line (automated routines occasionally have spectacular failures when dealing with complex line profiles), the object was removed from the catalog.
4 Catalog Format
The DR5 SDSS Quasar Catalog is available in three types of files at the SDSS public web site listed in the introduction: 1) a standard ASCII file with fixed-size columns, 2) a gzipped compressed version of the ASCII file (which is smaller than the uncompressed version by a factor of more than four), and 3) a binary FITS table format. The following description applies to the standard ASCII file. All files contain the same number of columns, but the storage of the numbers differs slightly in the ASCII and FITS formats; the FITS header contains all of the required documentation. Table 1 provides a summary of the information contained in each of the columns in the ASCII catalog.
The standard ASCII catalog (Table 2 of this paper) contains information on 77,429 quasars in a 36 MB file. The DR5 format is similar to that of DR3 with a few minor differences.
The first 80 lines consist of catalog documentation; this is followed by 77,429 lines containing information on the quasars. There are 74 columns in each line; a summary of the information is given in Table 1 (the documentation in the ASCII catalog header is essentially an expansion of Table 1). At least one space separates all the column entries, and, except for the first and last columns (SDSS designation and the object name if previously known), all entries are reported in either floating point or integer format.
Notes on the catalog columns:
1) The DR5 object designation, given by the format SDSS Jhhmmss.ss+ddmmss.s; only the final 18 characters are listed in the catalog (i.e., the “SDSS J” for each entry is dropped). The coordinates in the object name follow IAU convention and are truncated, not rounded.
2–3) The J2000 coordinates (Right Ascension and Declination) in decimal degrees. The positions for the vast majority of the objects are accurate to 0.1′′ rms or better in each coordinate; the largest expected errors are 0.2′′ (see Pier et al 2003). The SDSS coordinates are placed in the International Celestial Reference System, primarily through the United States Naval Observatory CCD Astrograph Catalog (Zacharias et al. 2000), and have an rms accuracy of 0.045′′ per coordinate.
4) The quasar redshifts. A total of 863 of the CAS redshifts were revised during our visual inspection. A detailed description of the redshift measurements is given in Section 4.10 of Stoughton et al. (2002). A comparison of 299 quasars observed at multiple epochs by the SDSS (Wilhite et al. 2005) found an rms difference of 0.006 in the measured redshifts for a given object. It is well known that the redshifts of individual broad emission lines in quasars exhibit significant offsets from their systemic redshifts (e.g., Gaskell 1982, Richards et al. 2002b, Shen et al. 2007); the catalog redshifts attempt to correct for this effect in the ensemble average (see Stoughton et al. 2002).
5–14) The DR5 PSF magnitudes and errors (not corrected for Galactic extinction) from BEST photometry for each object in the five SDSS filters. Some of the relevant imaging scans, such as special scans through M31 (see the DR4 and DR5 papers) were never loaded into the CAS, therefore the BEST photometry is not available for them. Thus there are 134 quasars which have entries of “0.000” for their BEST photometric measurements.
The effective wavelengths of the , , , , and bandpasses are 3541, 4653, 6147, 7461, and 8904 Å, respectively (for an power-law spectral energy distribution using the definition of effective wavelength given in Schneider, Gunn, & Hoessel 1983). The photometric measurements are reported in the natural system of the SDSS camera, and the magnitudes are normalized to the AB system (Oke & Gunn 1983). The measurements are reported as asinh magnitudes (Lupton, Gunn, & Szalay 1999); see Adelman-McCarthy et al. (2007) for additional discussion and references for the accuracy of the photometric measurements. The TARGET PSF photometric measurements are presented in columns 63–72.
15) The Galactic extinction in the band based on the maps of Schlegel, Finkbeiner, & Davis (1998). For an absorbing medium, the extinctions in the SDSS bands can be expressed as
where is the filter (), and values of are 5.155, 3.793, 2.751, 2.086, and 1.479 for , respectively (, , , and are 0.736, 0.534, 0.405, and 0.287 times ).
16) The logarithm of the Galactic neutral hydrogen column density along the line of sight to the quasar. These values were estimated via interpolation of the 21-cm data from Stark et al. (1992), using the COLDEN software provided by the Chandra X-ray Center. Errors associated with the interpolation are typically expected to be less than cm-2 (e.g., see §5 of Elvis, Lockman, & Fassnacht 1994).
17) Radio properties. If there is a source in the FIRST catalog within 2.0′′ of the quasar position, this column contains the FIRST peak flux density at 20 cm encoded as an AB magnitude
(see Ivezić et al. 2002). An entry of “0.000” indicates no match to a FIRST source; an entry of “” indicates that the object does not lie in the region covered by the final catalog of the FIRST survey. The catalog contains 6226 FIRST matches; 5729 DR5 quasars lie outside of the FIRST area.
18) The S/N of the FIRST source whose flux is given in column 17.
19) Separation between the SDSS and FIRST coordinates (in arc seconds).
20) In cases when the FIRST counterpart to an SDSS source is extended, the FIRST catalog position of the source may differ by more than 2′′ from the optical position. A “1” in column 20 indicates that no matching FIRST source was found within 2′′ of the optical position, but that there is significant detection (larger than 3) of FIRST flux at the optical position. This is the case for 2440 SDSS quasars.
21) A “1” in column 21 identifies the 1596 sources with a FIRST match in either columns 17 or 20 that also have at least one FIRST counterpart located between 2.0′′ (the SDSS-FIRST matching radius) and 30′′ of the optical position. Based on the average FIRST source surface density of 90 deg-2, we expect 50–60 of these matches to be chance superpositions.
22) The logarithm of the vignetting-corrected count rate (photons s-1) in the broad energy band (0.1–2.4 keV) in the ROSAT All-Sky Survey Faint Source Catalog (Voges et al. 2000) and the ROSAT All-Sky Survey Bright Source Catalog (Voges et al. 1999). The matching radius was set to 30′′; an entry of “” in this column indicates no X-ray detection. There are 4133 RASS matches in the DR5 catalog.
23) The S/N of the ROSAT measurement.
24) Separation between the SDSS and ROSAT All-Sky Survey coordinates (in arc seconds).
25–30) The magnitudes and errors from the Two Micron All Sky Survey (2MASS; Skrutskie et al. 2006) All-Sky Data Release Point Source Catalog (Cutri et al. 2003) using a matching radius of 2.0′′. A non-detection by 2MASS is indicated by a “0.000” in these columns. Note that the 2MASS measurements are Vega-based, not AB, magnitudes. The catalog contains 9824 2MASS matches.
31) Separation between the SDSS and 2MASS coordinates (in arc seconds).
32) The absolute magnitude in the band calculated by correcting for Galactic extinction and assuming = 70 km s-1 Mpc-1, = 0.3, = 0.7, and a power-law (frequency) continuum index of .
33) The color, which is the difference in the Galactic extinction corrected for the quasar and that of the mean of the quasars at that redshift. If is not defined for the quasar, which occurs for objects at either or the column will contain “”. See Section 5.2 for a description of this quantity.
34) Morphological information. If the SDSS photometric pipeline classified the image of the quasar as a point source, the catalog entry is 0; if the quasar is extended, the catalog entry is 1.
35) The SDSS SCIENCEPRIMARY flag, which indicates whether the spectrum was taken as a normal science spectrum (SCIENCEPRIMARY = 1) or for another purpose (SCIENCEPRIMARY = 0). The latter category contains Quality Assurance and calibration spectra, or spectra of objects located outside of the nominal survey area. Over 90% of the DR5 entries (69,762 objects) are SCIENCEPRIMARY = 1.
36) This flag provides information on whether the photometric object is designated PRIMARY (1), SECONDARY (2), or FAMILY (3; these are blended objects that have not been deblended). During target selection, only PRIMARY objects are considered (except on occasion for objects located in fields that are not part of the nominal survey area); however, differences between TARGET and BEST photometric pipeline versions make it possible that the BEST photometric object belonging to a spectrum is either not detected at all, or is a non-primary object (see §3.1 above). Over 99% of the catalog entries are PRIMARY; 613 quasars are SECONDARY and 9 are FAMILY. There are 124 quasars with an entry of “0” in this column; each of these is an object that lacks BEST photometry. For statistical analysis, one should use only PRIMARY objects; SECONDARY and FAMILY objects are included in the catalog for the sake of completeness with respect to confirmed quasars.
37) The “uniform selection” flag, either 0 or 1; a “1” indicates that the object was identified as a primary quasar target (37,574 catalog entries) with the final target selection algorithm as given by Richards et al. (2002a). These objects constitute a statistical sample.
38) The 32-bit SDSS target-selection flag from BEST processing (PRIMTARGET; see Table 26 in Stoughton et al. 2002 for details); this is the flag produced by running the selection algorithm of Richards et al. (2002a) on the most recent processing of the image data. The target-selection flag from TARGET processing is found in column 55.
39–45) The spectroscopic target selection breakdown (BEST) for each object. The target selection flag in column 38 is decoded for seven groups: Low-redshift quasar, High-redshift quasar, FIRST, ROSAT, Serendipity, Star, and Galaxy An entry of “1” indicates that the object satisfied the given criterion (see Stoughton et al. 2002). Note that an object can be, and often is, targeted by more than one selection algorithm. The last two columns in Table 3 presents the number of quasars identified by the individual BEST target selection algorithm; the column labeled “Sole” indicates the number of objects that were detected by only one of the seven listed selection algorithms.
46–47) The SDSS Imaging Run number and the Modified Julian Date (MJD) of the photometric observation used in the catalog. The MJD is given as an integer; all observations on a given night have the same integer MJD (and, because of the observatory’s location, the same UT date). For example, imaging run 94 has an MJD of 51075; this observation was taken on 1998 September 19 (UT).
48–50) Information about the spectroscopic observation (Modified Julian Date, spectroscopic plate number, and spectroscopic fiber number) used to determine the redshift. These three numbers are unique for each spectrum, and can be used to retrieve the digital spectra from the public SDSS database.
51–54) Additional SDSS processing information: the photometric processing rerun number; the camera column (1–6) containing the image of the object, the field number of the run containing the object, and the object identification number (see Stoughton et al. 2002 for descriptions of these parameters).
55) The 32-bit SDSS target selection flag from the TARGET processing, i.e., the value that was used when the spectroscopic plate was drilled. This may not match the BEST target selection flag because a different versions of the selection algorithm were used, the selection was done with different image data (superior quality data of the field was obtained after the spectroscopic observations were completed), or different processings of the same data were used. Objects with no TARGET flag were either identified as quasars as a result of Quality Assurance observations and/or from special plates with somewhat different targeting criteria (see Adelman-McCarthy 2006).
56–62) The spectroscopic target-selection breakdown (TARGET) for each object; this is the same convention as followed in columns 39–45 for the BEST target-selection flag.
63–72) The DR5 PSF magnitudes and errors (not corrected for Galactic reddening) from TARGET photometry.
73) The 64-bit integer that uniquely describes the spectroscopic observation that is listed in the catalog (SpecObjID).
74) Name of object in the NASA/IPAC Extragalactic Database (NED). If there is a source in the NED quasar database within 5.0′′ of the quasar position, the NED object name is given in this column. The NED quasar database contains over 100,000 objects. Occasionally NED will list the SDSS name for objects that were not discovered by the SDSS.
5 Catalog Summary
The 77,429 objects in the catalog represent an increase of 31,009 quasars over the Paper III database; of the entries in the new catalog, 74,297 (96.0%) were discovered by the SDSS (with the caveat that NED is not complete). The catalog quasars span a wide range of properties: redshifts from 0.078 to 5.414, (506 objects have ; only 26 have ), and . The catalog contains 6226, 4133, and 9824 matches to the FIRST, RASS, and 2MASS catalogs, respectively. The RASS and 2MASS catalogs cover essentially all of the DR5 area, but 5729 (7%) of the entries in the DR5 catalog lie outside of the FIRST region.
Figure 2 displays the distribution of the DR5 quasars in the -redshift plane (the 26 objects with are not plotted). Objects which NED indicates were previously discovered by investigations other than the SDSS are indicated with open circles. The curved cutoff on the left hand side of the graph is produced by the minimum luminosity criterion (). The ridge in the contours at for redshifts below three reflects the flux limit of the low-redshift sample; essentially all of the large number of points with are quasars selected via criteria other than the primary multicolor sample.
A histogram of the catalog redshifts is shown in the upper curve in Figure 3. A clear majority of quasars have redshifts below two (the median redshift is 1.48, the mode is 1.85), but there is a significant tail of objects extending out to redshifts beyond five ( = 5.41). The dips in the curve at redshifts of 2.7 and 3.5 arise because the SDSS colors of quasars at these redshifts are similar to the colors of stars; we decided to accept significant incompleteness at these redshifts rather than be overwhelmed by a large number of stellar contaminants in the spectroscopic survey. Improvements in the quasar target selection algorithm since the initial editions of the SDSS Quasar Catalog have increased the efficiency of target selection at redshifts near 3.5 (compare Figure 3 with Paper II’s Figure 4; see Richards et al. 2002a for a discussion of the incompleteness of the SDSS Quasar Survey).
This structure in the catalog redshift histogram can be understood by careful modelling of the selection effects (e.g., accounting for emission line effects and using only objects selected in regions whose spectroscopic observations were chosen with the final version of the quasar target selection algorithm; also see Figure 8 in Richards et al. 2006). Repeating the analysis of Richards et al. (2006) for the DR5 sample reveals no structure in the redshift distribution after selection effects have been included (see lower histogram in Figure 3); this is in contrast to the reported redshift structure found in the SDSS quasar survey by Bell & McDiarmid (2006). To construct the lower histogram we have partially removed the effect of host galaxy contamination (by excluding extended objects), limited the sample to a uniform magnitude limit of (accounting for emission-line effects), and have corrected for the known incompleteness near and due to quasar colors lying close to or in the stellar locus. Accounting for selection effects significantly reduces the number of objects as compared with the raw, more heterogeneous catalog, but the smaller, more homogeneous sample is what should be used for statistical analyses.
The distribution of the observed magnitude (not corrected for Galactic extinction) of the quasars is given in Figure 4. The sharp drops in the histogram at and are due to the magnitude limits in the low and high-redshift samples, respectively.
Figures 5 and 6 display the distribution of the absolute magnitudes of the catalog quasars. There is a roughly symmetric peak centered at with a FWHM of approximately one magnitude. The histogram declines sharply at high luminosities (only 1.5% of the objects have ) and has a gradual decline toward lower luminosities, partially due to host-galaxy contribution.
A summary of the spectroscopic selection, for both the TARGET and the BEST algorithms, is given in Table 3. We report seven selection classes in the catalog (columns 39 to 45 for BEST, 56–62 for TARGET). Each selection version has two columns, the number of objects that satisfied a given selection criterion and the number of objects that were identified only by that selection class. About two-thirds of the catalog entries were selected based on the SDSS quasar selection criteria (either a low-redshift or high-redshift candidate, or both). Slightly more than half of the quasars in the catalog are serendipity-flagged candidates, which is also primarily an “unusual color” algorithm; about one-fifth of the catalog was selected by the serendipity criteria alone.
Of the 50,093 DR5 quasars that have Galactic-absorption corrected TARGET magnitudes brighter than 19.1, 48,593 (97.0%) were identified by the TARGET quasar multicolor selection; if one combines TARGET multicolor and FIRST selection (the primary quasar target selection criteria), all but 1015 of the objects were selected. (The spectra of many of the last category of objects were obtained in observations that were not part of the primary survey.) The numbers are similar if one uses the BEST photometry and selection, although the completeness is not quite as high as with TARGET values.
5.1 Discrepancies Between the DR5 and Other Quasar Catalogs
The DR3 database is entirely contained in that of DR5, but there are 66 quasars from Paper III (out of 46,420 objects) that do not have a counterpart within 1.0′′ of a DR5 quasar. Three of these “missing” quasars are in the DR5 list; changes in celestial position of 1.1′′, 1.8′′, and 5.3′′ between DR3 and DR5 caused these quasars to be missed with the 1.0′′ matching criterion. The other 63 cases (0.14% of the DR3 total) were individually investigated. Three DR3 objects were dropped because the latest photometry reduced their luminosities below the catalog limit. The remaining 60 objects were removed because 1) the visual examination of the spectrum either convinced us that the object was not a quasar or that the S/N was insufficient to assign a redshift with confidence or 2) The widest line in the latest fit to the spectrum had a FWHM of less than 1000 km s-1. It should be noted that there have been no changes to the DR3 spectra in the DR5 database; the missing objects reflect the inherent uncertainties involved with interpreting objects that either lie near survey cutoffs or have spectra of marginal S/N.
There are 40 and 136 DR5 quasars that have redshifts that differ by more than 0.1 from the DR3 and NED values, respectively (there is, of course, considerable overlap in these two groups). In all cases the DR5 measurements are considered more reliable than those presented in previous publications. The 40 objects with are listed in Table 4.
5.2 Quasar Colors
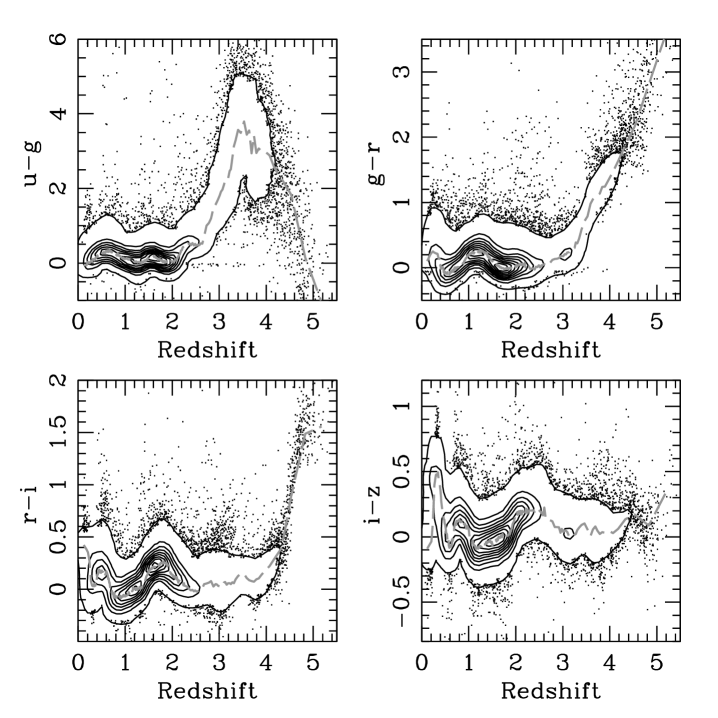
It has long been known that the majority of quasars inhabit a restricted range in photometric color, and the large sample size and accurate photometry of the SDSS revealed a relatively tight color-redshift correlation for quasars (Richards et al. 2001). This SDSS color relation, recently presented in Hopkins et al. (2004), has led to considerable success in assigning photometric redshifts to quasars (e.g., Weinstein et al. 2004 and references therein). All photometric measurements used in these analyses have been corrected for Galactic extinction.
The dependence of the four standard SDSS colors on redshift for the DR5 quasars is given in Figure 7. The dashed line in each panel is the modal relation for the DR5 quasars; the modal relations are tabulated in Table 5, along with the values for . The figures show an impressively tight correlation of color with redshift, although the scatter dramatically increases when the Lyman forest dominates the bluer of the passbands used to form the color. The distribution near the modal curve is roughly symmetric, but there is clearly a significant population of “red” quasars that has no “blue” counterpart.
This table is an improvement over previous work in that it is based on a larger sample size (a factor of four increase since this relation was last published) and provides higher redshift resolution (0.01, except near the extrema). As in Hopkins et al. (2004), we compute the mode, rather than the mean or median, as the most representative quantity. However, a formal computation of the mode requires binning the data both in redshift and by color within redshift bins; therefore we estimated the mode from the mean and the median. Typically, the mode is estimated as (3 median2 mean), but we found empirically that (2 medianmean) appeared to work better for this sample in terms of tracing the modal “ridgeline” with redshift.
For each of the DR5 quasars we provide the quantity , which is defined by
where is the entry in Table 5 for the redshift of the quasar. This “differential color” provides an estimate of the continuum properties of the quasar (values above zero indicate that the object has a redder continuum than the typical quasar at that redshift).
5.3 Bright Quasars
Although the spectroscopic survey is limited to objects fainter than , the SDSS continues to discover a number of “PG-class” (Schmidt & Green 1983) objects. The DR5 catalog contains 81 entries with ; 14 of the quasars are not in the NED database or attributed to the SDSS by NED. The spectrum of the brightest post-DR3 discovery, SDSS J165551.37+214601.8 (, ), is presented in Figure 1. Three of the SDSS-discovered objects in this catalog have been added since Paper III.
5.4 Luminous Quasars
There are 103 catalog quasars with (3C 273 has in our adopted cosmology); 61 were discovered by the SDSS, and 18 are published here for the first time. The redshifts of these quasars lie between 1.3 and 5.0. The most luminous quasar in the catalog is 2MASSI J0745217+473436 (= SDSS J074521.78+473436.2), at and . Spectra of the two most luminous post-DR3 discoveries, with absolute magnitudes of and , are displayed in the upper two panels of Figure 1. The spectra of both quasars possess a considerable number of absorption features redward of the Lyman emission line.
5.5 Broad Absorption Line Quasars
The SDSS quasar selection algorithm has proven to be effective at finding a wide variety of Broad Absorption Line (BAL) Quasars. An EDR sample of 118 BAL quasars was presented by Tolea, Krolik, & Tsvetanov (2002). There have been two editions of the SDSS BAL Quasar Catalog; the first, associated with Paper I, contained 224 BAL quasars (Reichard et al. 2003); the second was based on the Paper III catalog and presents 4787 BAL quasars (Trump et al. 2006). BAL quasars are usually recognized by the presence of C IV absorption features, which are only visible in SDSS spectra at , thus the frequency of the BAL quasar phenomenon cannot be found from simply taking the ratio of BAL quasars to total number of quasars in the SDSS catalog. The SDSS has discovered a wide variety of extreme BAL quasars (see Hall et al. 2002); the lower right panel in Figure 1 presents the spectrum of an unusual FeLoBAL quasar with strong Balmer absorption (see Hall 2007 for a discussion of this object).
5.6 Quasars with Redshifts Below 0.15
The catalog contains 109 quasars with redshifts below 0.15. All of these objects are of low luminosity (, only three have ) because of the limit for the spectroscopic sample. About three-quarters of these quasars (83) are extended in the SDSS image data. A total of 40 of the quasars were found by the SDSS; 21 have been added since Paper III.
5.7 High-Redshift () Quasars
At first light of the SDSS, the most distant known quasar was PC 1247+3406 at redshift of 4.897 (Schneider, Schmidt, and Gunn 1991), which had been discovered seven years earlier. Within a year of operation, the SDSS had discovered quasars with redshifts above five (Fan et al. 1999, 2000); the DR5 catalog contains 60 objects with redshifts greater than that of PC 1247+3406.
In recent years the SDSS has identified quasars out to a redshift of 6.4 (Fan et al. 2003, 2006b). Quasars with redshifts larger than 5.7, however, cannot be found by the SDSS spectroscopic survey because at these redshifts the observed wavelength of the Lyman emission line is redward of the band; at this point quasars become single-filter () detections. At the typical -band flux levels for redshift six quasars, there are simply too many “false-positives” to undertake automated targeting. The largest redshift in the DR5 catalog is SDSS J023137.65072854.5 at , which was originally described by Anderson et al. (2001).
The DR5 catalog contains 891 quasars with redshifts larger than four; 36 entries have redshifts above five (11 above ), which is more than a factor of two increase since Paper III. The spectra of the 20 highest redshift post-DR3 objects (all with redshifts greater than or equal to 4.99) are displayed in Figure 8. These redshift five spectra display a striking variety of emission line properties, and include an impressive BAL at .
We have used archival data from Chandra, ROSAT, and XMM-Newton to check for new X-ray detections of quasars with unusual emission-line or absorption-line properties; we do not report all X-ray detections here as there are now more than 110 already published.333See http://www.astro.psu.edu/users/niel/papers/highz-xray-detected.dat for a list of X-ray detections and references. We found three remarkable X-ray detections: the BAL quasar SDSS J133529.45+410125.9, the BAL quasar SDSS J142305.04+240507.8, and the quasar SDSS J150730.63+553710.8, which shows remarkably strong C iv emission. None of these objects has sufficient counts for detailed X-ray spectral analysis, but we have computed their point-to-point spectral slopes between rest-frame 2500 Å and 2 keV (), adopting the assumptions in §2 of Brandt et al. (2002). SDSS J133529.45+410125.9 and SDSS J142305.04+240507.8 were serendipitously detected in archival Chandra ACIS observations and have and , respectively. Comparing these values to the established relation between and 2500 Å luminosity (e.g., Steffen et al. 2006), we find that SDSS J133529.45+410125.9 is notably X-ray weak, indicating likely X-ray absorption as is often seen in BAL quasars (e.g., Gallagher et al. 2006) including those at (Vignali et al. 2005). In contrast, the level of X-ray emission from SDSS J142305.04+240507.8 is consistent with that from normal, non-BAL quasars; its relatively narrow UV absorption, for a BAL quasar, may indicate a relatively small column density of obscuring material. SDSS J150730.63+553710.8 is weakly detected in a ROSAT PSPC observation and has ; this level of X-ray emission is nominal for a quasar of its luminosity.
We have also checked all quasars with for new X-ray detections and found none; 21 quasars with have previously reported X-ray detections.
5.8 Close Pairs
The mechanical constraint that SDSS spectroscopic fibers must be separated by 55′′ on a given plate makes it difficult for the spectroscopic survey to confirm close pairs of quasars. In regions that are covered by more than one plate, however, it is possible to obtain spectra of both components of a close pair; there are 346 pairs of quasars in the catalog with angular separation less than an arcminute (34 pairs with separations less than 20′′). Most of the pairs are chance superpositions, but there are many sets whose components have similar redshifts, suggesting that the quasars may be physically associated. The typical uncertainty in the measured value of the redshift difference between two quasars is 0.02; the catalog contains 18 quasar pairs with separations of less than an arcminute and with . These pairs, which are excellent candidates for binary quasars, are listed in Table 6. Hennawi et al. (2006) identified over 200 quasar pairs in the SDSS, primarily through spectroscopic observations of SDSS quasar candidates (based on photometric measurements) near known SDSS quasars; statistical arguments based on a correlation-function analysis suggests that most of these pairs are indeed physically associated.
5.9 Morphology
The images of 3498 of the DR5 quasars are classified as extended by the SDSS photometric pipeline; 3291 (94%) have redshifts below one (there are nine resolved quasars). The majority of the large-redshift “resolved” quasars are probably measurement errors, but this sample may also contain a mix of chance superpositions of quasars and foreground objects or possibly some small angle separation gravitational lenses (indeed, several lenses are present in the resolved quasar sample; see Paper II and Oguri et al. 2006).
5.10 Matches with Non-optical Catalogs
A total of 6226 catalog objects are FIRST sources (defined by a SDSS-FIRST positional offset of less than 2.0′′). Note that 226 of the objects were selected (with TARGET) solely because they were FIRST matches (all unresolved SDSS sources brighter than that lie within 2.0′′ of a FIRST source are targeted by the quasar spectroscopic selection algorithm). Extended radio sources may be missed by this matching. The upper left panel in Figure 9 contains a histogram of the angular offsets between the SDSS and FIRST positions; the solid line is the expected distribution assuming a 0.21′′ Gaussian error in the relative SDSS/FIRST positions (found by fitting the points with a separation less than 1.0′′. The small-angle separations are well-fit to the Rayleigh distribution, but outside of about 0.5′′ there is an obvious excess of observed separations. The number of chance superpositions was estimated by shifting the quasar positions by in declination and matching the new coordinates to the FIRST catalog; only about 0.1% of the reported FIRST matches are false. The large “tail” of this distribution is not likely to be due to measurement errors but probably arises from extended radio emission that may not be precisely centered on the optical image. To recover radio quasars that have offsets of more than 2.0′′, we separately identify all objects with a greater than 3 detection of FIRST flux at the optical position (2440 sources). For these objects as well as those with a FIRST catalog match within 2′′, we perform a second FIRST catalog search with 30′′ matching radius to identify possible radio lobes associated with the quasar, finding such matches for 1596 sources.
Matches with the ROSAT All-Sky Survey Bright and Faint Source Catalogs were made with a maximum allowed positional offset of 30′′; this is the positional coincidence required for the SDSS ROSAT target selection code. The DR5 catalog contains 4133 RASS matches; approximately 1.3% are expected to be false identifications based on an analysis similar to that described in the previous paragraph. The SDSS-RASS offsets for the DR5 sample are presented in the upper right panel of Figure 9; the solid curve, which is the predicted distribution for a positional error of 11.1′′ (fit using all of the points), matches the data quite well.
photometric measurements for 9824 DR5 quasars were found by using a matching radius of 2.0′′ in the 2MASS All-Sky Data Release Point Source Catalog. No infrared information was used to select the SDSS spectroscopic targets. The positional offset histogram, given in the lower left panel of Figure 9, is considerably tighter than that for the FIRST matches, although the Rayleigh fit to the separations less than 1.0′′ is virtually identical to the FIRST distribution (1 of 0.21′′). There are very few 2MASS identifications with offsets between 1′′ and 2′′; virtually all of the infrared matches are correct.
6 Summary
The lower right panel in Figure 9 charts the progress of the SDSS Quasar Survey, denoted by the number of spectroscopically-confirmed quasars, over the duration of SDSS-I. Although SDSS-I has now been completed, the SDSS Quasar Survey is continuing under the SDSS-II project. By necessity the SDSS spectroscopy lags the SDSS imaging; at the conclusion of SDSS-I more than 2000 square degrees of SDSS image data in the Northern Galactic Cap lacked spectroscopic coverage (Adelman-McCarthy et al. 2007). A future edition of the SDSS Quasar Catalog will incorporate the observations from SDSS-II and should contain approximately 100,000 quasars.
References
- Abazajian et al. (2003) Abazajian, K., et al. 2003, AJ, 126, 2081 (DR1)
- Abazajian et al. (2005) Abazajian, K., et al. 2005, AJ, 129, 1755 (DR3)
- Adelman-McCarthy et al. (2006) Adelman-McCarthy, J., et al. 2006, ApJS, 162, 38 (DR4)
- Adelman-McCarthy et al. (2007) Adelman-McCarthy, J., et al. 2007, ApJS, in press (DR5)
- Anderson et al. (2001) Anderson, S.F., et al. 2001, AJ, 122, 503
- Anderson et al. (2003) Anderson, S.F., et al. 2003, AJ, 126, 2209
- Anderson et al. (2007) Anderson, S.F., et al. 2007, AJ, 133, 313
- Becker et al (1995) Becker, R.H., White, R.L., & Helfand, D.J. 1995, ApJ, 450, 559
- (9) Bell, M. B., & McDiarmid, D. 2006, ApJ, 648, 140
- Blanton et al. (2003) Blanton, M.R., Lupton, R.H., Maley, F.M., Young, N., Zehavi, I., & Loveday, J. 2003, AJ, 125, 2276
- Brandt et al. (2002) Brandt, W.N., et al. 2002, ApJ, 569, L5
- Castander et al. (2001) Castander, F.J., et al. 2001, AJ, 121, 2331
- Collinge et al. (2005) Collinge, M., et al. 2005, AJ, 129, 2542; Erratum AJ 131, 3135
- Cutri et al. (2003) Cutri, R.M., Skrutskie, M.F., van Dyk, S., Beichman, C.A., et al. 2003, VizieR On-line Data Catalog: II/246, University of Massachusetts and Infrared Processing and Analysis Center
- Eisenstein et al. (2002) Eisenstein, D.J., et al. 2001, AJ, 122, 2267
- Elvis et al. (1994) Elvis M., Lockman F.J., & Fassnacht C., 1994, ApJS, 95, 413
- Fan et al. (1999) Fan, X., et al. 1999, AJ, 118, 1
- Fan et al. (2000) Fan, X., et al. 2000, AJ, 119, 1
- Fan et al. (2003) Fan, X., et al. 2003, AJ, 125, 1649
- Fan et al. (2006) Fan, X., et al. 2006a, AJ, 131, 1203
- Fan et al. (2006) Fan, X., et al. 2006b, AJ, 132, 171
- Fukugita et al. (1996) Fukugita, M., Ichikawa, T., Gunn, J.E., Doi, M., Shimasaku, K., & Schneider, D.P. 1996, AJ, 111, 1748
- Gallagher et al. (2006) Gallagher, S.C., Brandt, W.N., Chartas, G., Priddey, R., Garmire, G.P., & Sambruna, R.M. 2006, ApJ, 644, 709
- Gaskell (1982) Gaskell, C.M. 1982, ApJ, 263, 79
- Gunn et al. (1998) Gunn, J.E., et al. 1998, AJ, 116, 3040
- Gunn et al. (2006) Gunn, J.E., et al. 2006, AJ, 131, 2332
- Hall (2007) Hall, P.B. 2007, AJ, 133, 1271
- Hall et al. (2002) Hall, P.B., et al. 2002, ApJS, 141, 267
- Hennawi et al. (2006) Hennawi, J., et al. 2006, 131, 1
- Hao et al. (2005) Hao, L., et al. 2005, AJ, 129, 1783
- Hogg et al. (2001) Hogg, D.W., Schlegel, D.J., Finkbeiner, D.P., & Gunn, J.E. 2001, AJ, 122, 2129
- Hopkins et al. (2004) Hopkins, P.F., et al. 2004, AJ, 128, 1112
- Ivezic et al. (2002) Ivezić, Ž., et al. 2002, AJ, 124, 2364
- Ivezic et al. (2004) Ivezić, Ž., et al. 2004, AN, 325, 583
- Kauffmann et al. (2003) Kauffmann, G., et al. 2003, MNRAS, 346, 1055
- Lupton et al. (2001) Lupton, R.H., Gunn, J.E., Ivezić, Ž., Knapp, G.R., Kent, S., & Yasuda, N. 2001, in ASP Conf. Ser. 238, Astronomical Data Analysis Software and Systems, ed. F.R. Harnden, F.A. Primini, & H.E. Payne (San Francisco:ASP), 269
- Lupton, Gunn, & Szalay (1999) Lupton, R.H., Gunn, J.E., & Szalay, A. 1999, AJ, 118, 1406
- Oke & Gunn (1983) Oke, J.B., & Gunn, J.E., 1983, ApJ., 266, 713 Oguri, M., et al. 2006, AJ, 132, 999
- Pier, J.R. et al. (2003) Pier, J.R., Munn, J.A., Hindsley, R.B., Hennessy, G.S., Kent, S.M., Lupton, R.H., & Ivezić, Ž., 2003, AJ, 125, 1559
- Reichard et al. (2003) Reichard, T.A., et al. 2003, AJ, 125, 1711
- Richards et al (2001) Richards, G.T., et al. 2001, AJ, 121, 2308
- (42) Richards, G.T., et al. 2002a, AJ, 123, 2945
- (43) Richards, G.T., et al. 2002b, AJ, 124,1
- Richards et al. (2006) Richards, G.T., et al. 2006, AJ, 131, 2766
- Schlegel et al. (1998) Schlegel, D.J., Finkbeiner, D.P., & Davis, M. 1998, ApJ, 500, 525
- Schmidt and Green (1983) Schmidt, M., & Green, R.F. 1983, ApJ, 269, 352
- Schneider et al. (1983) Schneider, D.P., Gunn, J.E., & Hoessel, J.G. 1983, ApJ, 264, 337
- Schneider, Schmidt, and Gunn (1991) Schneider, D.P., Schmidt, M., and Gunn, J.E., 1991, AJ, 102, 837
- Schneider et al. (2002) Schneider, D.P., et al. 2002, AJ, 123, 567 (Paper I)
- Schneider et al. (2003) Schneider, D.P., et al. 2003, AJ, 126, 2579 (Paper II)
- Schneider et al. (2005) Schneider, D.P., et al. 2005, AJ, 130, 367 (Paper III)
- Shen et al (2007) Shen, Y., et al. 2007, AJ, in press.
- Skrutskie et al (2006) Skrutskie, M.F., et al. 2006, AJ, 131, 1163
- Smith et al. (2002) Smith, J.A., et al. 2002, AJ, 123, 2121
- Spergel et al. (2006) Spergel, D.N., et al. 2006, ApJ, submitted (astro-ph/0603449)
- Stark et al. (2002) Stark A.A., Gammie C.F., Wilson R.W., Bally J., Linke R.A., Heiles, C., & Hurwitz, M. 1992, ApJS, 79, 77
- Steffen et al. (2006) Steffen, A.T., Strateva, I.V., Brandt, W.N., Alexander, D.M., Koekemoer, A.M., Lehmer, B.D., Schneider, D.P., & Vignali, C. 2006, AJ, 131, 2826
- Stoughton et al. (2002) Stoughton, C., et al. 2002, AJ, 123, 485 (EDR)
- Strauss et al. (2002) Strauss, M.A., et al. 2002, AJ, 124, 1810
- Tolea et al. (2002) Tolea, A., Krolik, J.H., & Tsvetanov, Z. 2002, ApJ, 578, 31
- Trump et al. (2006) Trump, J.R., et al. 2006, ApJS, 165, 1
- Tucker et al. (2006) Tucker, D., et al. 2006, AN, 327, 821
- Vanden Berk et al. (2001) Vanden Berk, D.E., et al. 2001, AJ, 122, 549
- Vanden Berk et al. (2005) Vanden Berk, D.E., et al. 2005, AJ, 129, 2047
- Vignali et al. (2005) Vignali, C., Brandt, W.N., Schneider, D.P., & Kaspi, S. 2005, AJ, 129, 2519
- Voges et al. (1999) Voges, W., et al. 1999, A & A, 349, 389
- Voges et al. (2000) Voges, W., et al. 2000, IAUC, 7432
- Weinstein et al. (2004) Weinstein, M.A., et al. 2004, ApJS, 155, 243
- Wilhite, B. et al. (2005) Wilhite, B.C., et al. 2005, AJ, 633, 638
- York et al. (2000) York, D.G., et al. 2000, AJ, 120, 1579
- Zacharias et al. (2000) Zacharias, N., et al. 2000, AJ, 120, 2131
- Zakamska et al. (2003) Zakamska, N.L., et al. 2003, AJ, 128, 1002


| Column | Format | Description |
|---|---|---|
| 1 | A18 | SDSS DR5 Designation hhmmss.ss+ddmmss.s (J2000) |
| 2 | F11.6 | Right Ascension in decimal degrees (J2000) |
| 3 | F11.6 | Declination in decimal degrees (J2000) |
| 4 | F7.4 | Redshift |
| 5 | F7.3 | BEST PSF magnitude (not corrected for Galactic extinction) |
| 6 | F6.3 | Error in BEST PSF magnitude |
| 7 | F7.3 | BEST PSF magnitude (not corrected for Galactic extinction) |
| 8 | F6.3 | Error in BEST PSF magnitude |
| 9 | F7.3 | BEST PSF magnitude (not corrected for Galactic extinction) |
| 10 | F6.3 | Error in BEST PSF magnitude |
| 11 | F7.3 | BEST PSF magnitude (not corrected for Galactic extinction) |
| 12 | F6.3 | Error in BEST PSF magnitude |
| 13 | F7.3 | BEST PSF magnitude (not corrected for Galactic extinction) |
| 14 | F6.3 | Error in BEST PSF magnitude |
| 15 | F7.3 | Galactic extinction in band |
| 16 | F7.3 | (logarithm of Galactic H I column density) |
| 17 | F7.3 | FIRST peak flux density at 20 cm expressed as AB magnitude; |
| 0.0 is no detection, source is not in FIRST area | ||
| 18 | F8.3 | S/N of FIRST flux density |
| 19 | F7.3 | SDSS-FIRST separation in arc seconds |
| 20 | I3 | FIRST flux at optical position but no FIRST counterpart within 2′′ (0 or 1) |
| 21 | I3 | FIRST source located 2′′-30′′ from optical position (0 or 1) |
| 22 | F8.3 | log RASS full band count rate; is no detection |
| 23 | F7.3 | S/N of RASS count rate |
| 24 | F7.3 | SDSS-RASS separation in arc seconds |
| 25 | F7.3 | magnitude (2MASS); 0.0 indicates no 2MASS detection |
| 26 | F6.3 | Error in magnitude (2MASS) |
| 27 | F7.3 | magnitude (2MASS); 0.0 indicates no 2MASS detection |
| 28 | F6.3 | Error in magnitude (2MASS) |
| 29 | F7.3 | magnitude (2MASS); 0.0 indicates no 2MASS detection |
| 30 | F6.3 | Error in magnitude (2MASS) |
| 31 | F7.3 | SDSS-2MASS separation in arc seconds |
| 32 | F8.3 | ( = 70 km s-1 Mpc-1, , , ) |
| 33 | F7.3 | (Galactic extinction corrected) |
| 34 | I3 | Morphology flag 0 = point source 1 = extended |
| 35 | I3 | SDSS SCIENCEPRIMARY flag (0 or 1) |
| 36 | I3 | SDSS MODE flag (blends, overlapping scans; 1, 2, or 3) |
| 37 | I3 | Selected with final quasar algorithm (0 or 1) |
| 38 | I12 | Target Selection Flag (BEST) |
| 39 | I3 | Low- Quasar selection flag (0 or 1) |
| 40 | I3 | High- Quasar selection flag (0 or 1) |
| 41 | I3 | FIRST selection flag (0 or 1) |
| 42 | I3 | ROSAT selection flag (0 or 1) |
| 43 | I3 | Serendipity selection flag (0 or 1) |
| 44 | I3 | Star selection flag (0 or 1) |
| 45 | I3 | Galaxy selection flag (0 or 1) |
| 46 | I6 | SDSS Imaging Run Number of photometric measurements |
| 47 | I6 | Modified Julian Date of imaging observation |
| 48 | I6 | Modified Julian Date of spectroscopic observation |
| 49 | I5 | Spectroscopic Plate Number |
| 50 | I5 | Spectroscopic Fiber Number |
| 51 | I4 | SDSS Photometric Processing Rerun Number |
| 52 | I3 | SDSS Camera Column Number |
| 53 | I5 | SDSS Field Number |
| 54 | I5 | SDSS Object Number |
| 55 | I12 | Target Selection Flag (TARGET) |
| 56 | I3 | Low- Quasar selection flag (0 or 1) |
| 57 | I3 | High- Quasar selection flag (0 or 1) |
| 58 | I3 | FIRST selection flag (0 or 1) |
| 59 | I3 | ROSAT selection flag (0 or 1) |
| 60 | I3 | Serendipity selection flag (0 or 1) |
| 61 | I3 | Star selection flag (0 or 1) |
| 62 | I3 | Galaxy selection flag (0 or 1) |
| 63 | F7.3 | TARGET PSF magnitude (not corrected for Galactic extinction) |
| 64 | F6.3 | TARGET Error in PSF magnitude |
| 65 | F7.3 | TARGET PSF magnitude (not corrected for Galactic extinction) |
| 66 | F6.3 | TARGET Error in PSF magnitude |
| 67 | F7.3 | TARGET PSF magnitude (not corrected for Galactic extinction) |
| 68 | F6.3 | TARGET Error in PSF magnitude |
| 69 | F7.3 | TARGET PSF magnitude (not corrected for Galactic extinction) |
| 70 | F6.3 | TARGET Error in PSF magnitude |
| 71 | F7.3 | TARGET PSF magnitude (not corrected for Galactic extinction) |
| 72 | F6.3 | TARGET Error in PSF magnitude |
| 73 | I21 | Spectroscopic Identification flag (64-bit integer) |
| 74 | 1X, A25 | Object Name for previously known quasars |
| “SDSS” designates previously published SDSS object |
| Object (SDSS J) | R.A. (deg) | Dec (deg) | Redshift | ||||||||||
|---|---|---|---|---|---|---|---|---|---|---|---|---|---|
| 000006.53+003055.2 | 0.027228 | 0.515349 | 1.8227 | 20.389 | 0.066 | 20.468 | 0.034 | 20.332 | 0.037 | 20.099 | 0.041 | 20.053 | 0.121 |
| 000008.13+001634.6 | 0.033898 | 0.276304 | 1.8365 | 20.233 | 0.054 | 20.200 | 0.024 | 19.945 | 0.032 | 19.491 | 0.032 | 19.191 | 0.068 |
| 000009.26+151754.5 | 0.038605 | 15.298476 | 1.1986 | 19.921 | 0.042 | 19.811 | 0.036 | 19.386 | 0.017 | 19.165 | 0.023 | 19.323 | 0.069 |
| 000009.38+135618.4 | 0.039088 | 13.938447 | 2.2400 | 19.218 | 0.026 | 18.893 | 0.022 | 18.445 | 0.018 | 18.331 | 0.024 | 18.110 | 0.033 |
| 000009.42102751.9 | 0.039269 | 10.464428 | 1.8442 | 19.249 | 0.036 | 19.029 | 0.027 | 18.980 | 0.021 | 18.791 | 0.018 | 18.751 | 0.047 |
| TARGET | TARGET | BEST | BEST | |
|---|---|---|---|---|
| Sole | Sole | |||
| Class | Selected | Selection | Selected | Selection |
| Low- | 49010 | 16422 | 46460 | 14444 |
| High- | 16383 | 5327 | 16757 | 4411 |
| FIRST | 3501 | 226 | 3619 | 209 |
| ROSAT | 4817 | 380 | 4918 | 492 |
| Serendipity | 42109 | 15729 | 41042 | 15950 |
| Star | 1970 | 187 | 820 | 162 |
| Galaxy | 536 | 99 | 601 | 80 |
| SDSS J | SDSS J | ||
|---|---|---|---|
| 005508.55105206.2 | 1.381 | 133028.12+600811.7 | 1.992 |
| 013413.55+142900.1 | 1.195 | 133951.94+481651.3 | 0.911 |
| 031712.23075850.3 | 2.696 | 134048.37+433359.8 | 2.069 |
| 075052.59+300334.1 | 3.990 | 135833.05+634122.6 | 3.180 |
| 075132.75+350535.0 | 2.077 | 140012.65+595823.3 | 2.061 |
| 083503.79+322242.0 | 0.728 | 140223.63+463604.9 | 0.925 |
| 085339.64+372203.6 | 1.950 | 140327.91+613654.2 | 2.023 |
| 090902.73+355334.8 | 1.638 | 141230.28+471103.7 | 2.078 |
| 091025.25+365921.3 | 2.004 | 142010.28+604722.3 | 1.345 |
| 092415.87+424632.2 | 0.559 | 143702.47+613437.0 | 2.064 |
| 093557.85+005528.1 | 1.301 | 144939.30+534212.1 | 1.805 |
| 093935.08000801.1 | 0.909 | 151307.26000559.3 | 2.030 |
| 094326.48+460226.8 | 2.093 | 151422.99+481936.3 | 2.071 |
| 100415.17+415802.6 | 1.977 | 153257.67+422047.1 | 1.950 |
| 102117.71+623010.1 | 1.949 | 160320.97+315248.3 | 0.727 |
| 103039.95+510923.3 | 1.649 | 165806.76+611858.9 | 2.631 |
| 103219.66+563456.8 | 2.017 | 170929.58+323826.9 | 1.902 |
| 115917.62+100921.5 | 2.028 | 205058.45+004709.9 | 0.932 |
| 124345.10+492645.3 | 1.982 | 212744.12+005720.3 | 4.386 |
| 131810.57+585416.9 | 1.900 | 225246.43+142525.8 | 4.904 |
| 0.18 | 0.181 | 183 | 0.567 | 0.065 | 0.197 | 0.379 | 0.037 |
| 0.21 | 0.210 | 290 | 0.580 | 0.032 | 0.223 | 0.355 | 0.034 |
| 0.24 | 0.240 | 394 | 0.513 | 0.000 | 0.236 | 0.267 | 0.115 |
| 0.27 | 0.270 | 406 | 0.289 | 0.055 | 0.231 | 0.077 | 0.397 |
| 0.30 | 0.301 | 484 | 0.236 | 0.067 | 0.219 | 0.033 | 0.472 |
| Quasar 1 | Quasar 2 | ′′ | ||
|---|---|---|---|---|
| 001201.87+005259.7 | 001202.35+005314.0 | 1.652 | 1.642 | 16.0 |
| 011757.99+002104.1 | 011758.83+002021.4 | 0.612 | 0.613 | 44.5 |
| 014110.40+003107.1 | 014111.62+003145.9 | 1.879 | 1.882 | 42.9 |
| 024511.93011317.5 | 024512.12011313.9 | 2.463 | 2.460 | 4.5 |
| 025813.65000326.4 | 025815.54000334.2 | 1.316 | 1.321 | 29.4 |
| 025959.68+004813.6 | 030000.57+004828.0 | 0.892 | 0.900 | 19.6 |
| 074336.85+205512.0 | 074337.28+205437.1 | 1.570 | 1.565 | 35.5 |
| 074759.02+431805.4 | 074759.66+431811.5 | 0.501 | 0.501 | 9.2 |
| 082439.83+235720.3 | 082440.61+235709.9 | 0.536 | 0.536 | 14.9 |
| 085625.63+511137.0 | 085626.71+511117.8 | 0.543 | 0.543 | 21.8 |
| 090923.12+000203.9 | 090924.01+000211.0 | 1.884 | 1.865 | 15.0 |
| 095556.37+061642.4 | 095559.02+061701.8 | 1.278 | 1.273 | 44.0 |
| 110357.71+031808.2 | 110401.48+031817.5 | 1.941 | 1.923 | 57.3 |
| 111610.68+411814.4 | 111611.73+411821.5 | 2.980 | 2.971 | 13.8 |
| 113457.73+084935.2 | 113459.37+084923.2 | 1.533 | 1.525 | 27.1 |
| 121840.47+501543.4 | 121841.00+501535.8 | 1.457 | 1.455 | 9.1 |
| 165501.31+260517.5 | 165502.02+260516.5 | 1.881 | 1.892 | 9.6 |
| 215727.26+001558.4 | 215728.35+001545.5 | 2.540 | 2.553 | 20.8 |