Observation of Spin-Orbit Berry’s Phase in Magnetoresistance of a Two-Dimensional Hole Anti-dot System
Abstract
We report observation of spin-orbit Berry’s phase in the Aharonov-Bohm (AB) type oscillation of weak field magnetoresistance in an anti-dot lattice (ADL) of a two-dimensional hole system. An AB-type oscillation is superposed on the commensurability peak, and the main peak in the Fourier transform is clearly split up due to variation in Berry’s phase originating from the spin-orbit interaction. A simulation considering Berry’s phase and the phase arising from the spin-orbit shift in the momentum space shows qualitative agreement with the experiment.
pacs:
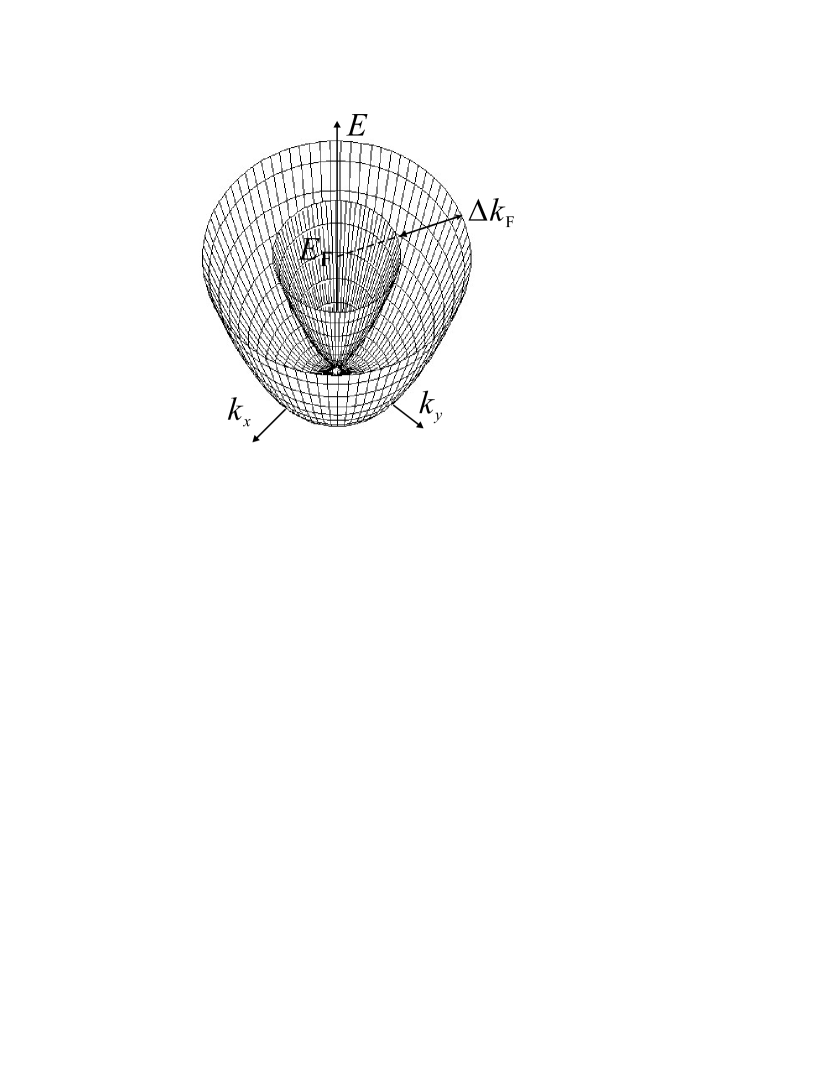
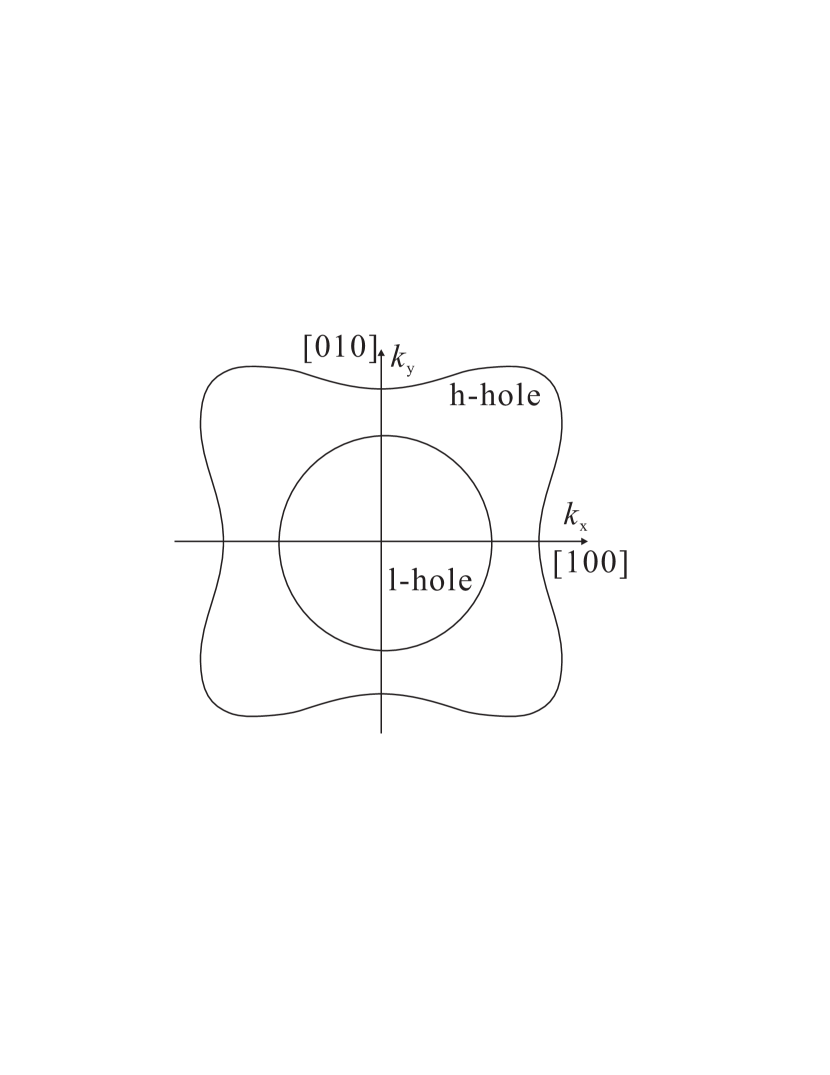
73.61.-r, 73.23.-b, 73.50.-hSpin-orbit interaction in two-dimensional system is predicted to introduce an additional geometric phase (Berry’s phase) Loss ; Aronov ; Stern ; Qian ; Meir . Here we consider the case of two-dimensional hole system (2DHS), in which the spin-orbit interaction is strong in III-V compound semiconductors due to the -orbital nature of the valence bands. In a 2DHS with the Rashba-type spin-orbit coupling, the additional phase shifts arise in two ways. The spin-orbit interaction causes split of the parabolic dispersion, producing two Fermi circles of opposite spins (Fig.1(a),(b)) Ando2 ; Ekenberg ; Eisenstein ; Lu ; Iye2 . This means, the hole system has two different Fermi wave vectors, of which the difference () gives a phase shift and modifies the interference through, e.g., a ring structure. Another shift in phase comes from the spin part of the wavefunction. When a hole moves along a closed contour in the real space, the same occurs in -space and it feels effective magnetic field due to the spin-orbit interaction. is in the 2D plane and orthogonal to the velocity. Hence when is strong enough, the spin placed in the 2D plane turns by 2 giving Berry’s phase of 0 or .
(a)
(b)
(c)
(d)
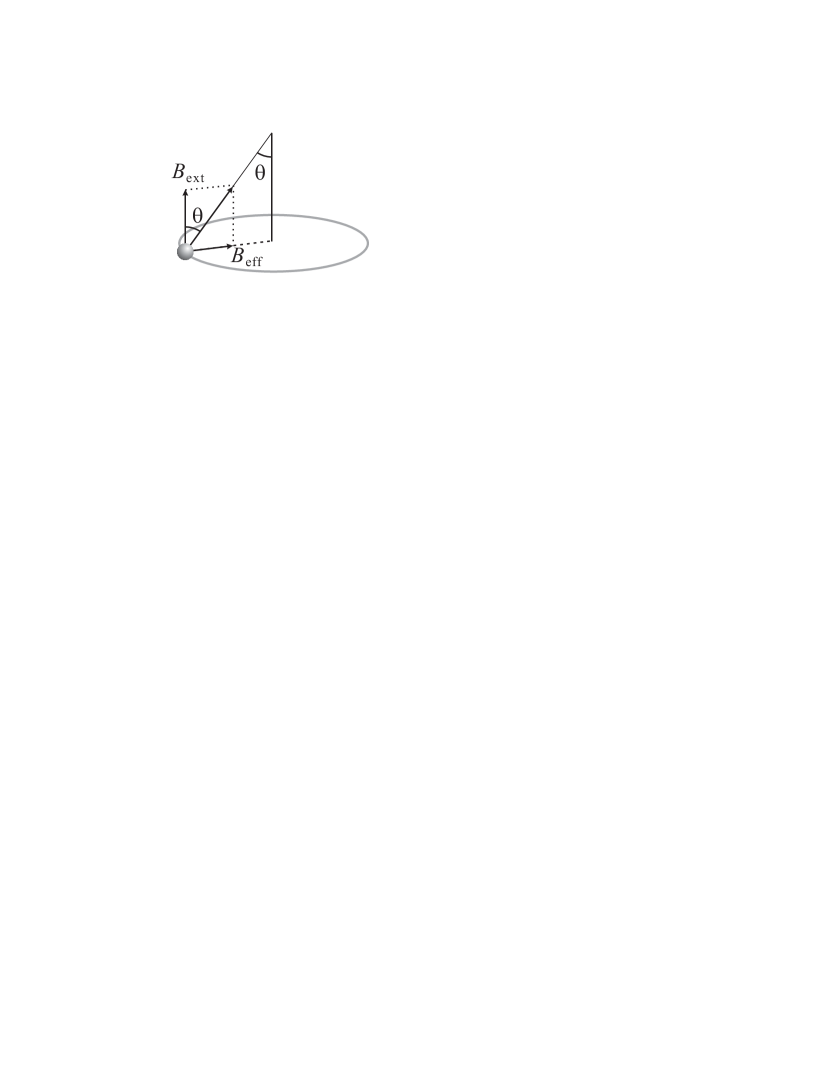
When an external magnetic field is applied perpendicular to the 2DHS plane, the hole moving along a loop acquires an Aharonov-Bohm (AB) phase. At the same time, the spin gets some component perpendicular to the plane, which means some diminishing in the in-plane component (Fig.1(c)). This hence affects the above two additional phases. The variation in Berry’s phase () and that in the phase due to () are given asLoss ; Aronov ; Stern ; Qian ; Meir ; Yau
| (1) |
| (2) |
where , and is the radius of the AB ring. Though significant warping of the outer Fermi contour is reportedAndo2 ; Ekenberg as shown in Fig.1(b), we can consider as an average over the perimeter in the present discussion. Hence the phase of an AB oscillation in a ring made of such a 2DHG should show continuous shift giving a nontrivial peak shape in its Fourier transform (FT) amplitude versus the frequency when the FT is performed in a finite field range. In experiments, such phases have been observed as splitting of AB magnetoresistance oscillation frequency in single AB ringsMopurgo ; Yau ; Yang . Especially the authors of Ref. 12 observed nontrivial variation of the main FT peak due to the phase shift represented in Eqs.1 and 2.
In an anti-dot structure, the carriers are excluded from a dot region and magnetoresistance oscillation similar to that in an AB ring is expected. In an anti-dot lattice (ADL), AB oscillations of paths around single anti-dots should be averaged out because of random phasing, whereas the effect of the AB phase remains in the density of states resulting in magnetoresistance oscillation called AB-type oscillationWeiss ; Ando ; Nihey ; Iye . It is, then, of strong interest whether the effect of spin-orbit Berry’s phase appears in the density of states responsible for the AB-type oscillation.
In this letter, we report observation of the predicted Berry’s phase through clear splitting of the main peak in FT of the AB-type oscillation in the magnetoresistance of an ADL. The shift in -space is independently estimated from the Shubnikov-de Haas (SdH) oscillation. Because the ADL automatically performs the disorder average, random specific effects in oscillation are suppressed and intrinsic information can be obtained.
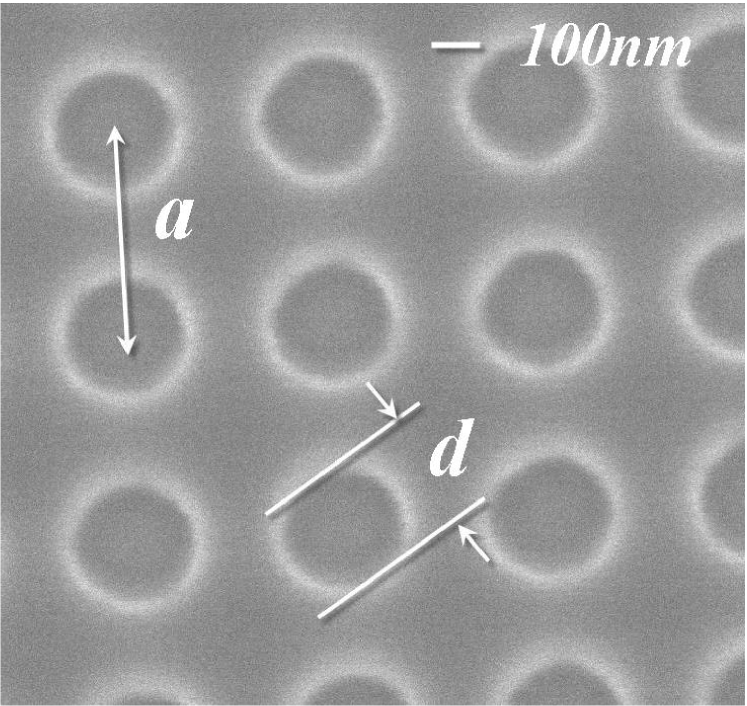
An (Al,Ga)As/GaAs heterostructure was grown by molecular beam epitaxy on a (001) GaAs substrate. Delta-doped Be layers produced a 2DHS with the hole concentration of 2.31011cm-2 and the mobility of 6.8104 cm2/Vs at 4.2K. SdH oscillation in the magnetoresistance of the 2DHS without ADL was measured at 60mK. From the plot of the peak index versus the inverse magnetic field, the concentrations of holes with smaller Fermi contour and larger one as 0.781011cm-2 and 1.561011cm-2 respectively. In this letter, we call the former and the latter as l-holes and h-holes, respectively. In the simple effective mass model, these two spin-split hole bands correspond to the two Fermi contours in Fig.1(a), though significant warping in h-hole band is reported in more realistic band calculationAndo2 ; Ekenberg . The grown film was wet-etched into Hall bars with [110] current direction. Circular anti-dot shape is adopted and ADLs were defined by electron beam lithography and wet-etching to a depth of 50nm. An ADL is characterized mainly by the dot diameter , the lattice structure, and the lattice period . In this study, we designed a square lattice aligned along [110] ([10]) with =250nm and =500nm (see Fig.1(d)).
The sample was directly immersed in 3He-4He mixture in a mixing chamber of a dilution refrigerator and cooled down to 60mK. up to 6T was applied by a superconducting solenoid. The resistance was measured in four-terminal configuration by standard lock-in technique with a frequency of 80Hz.
The solid line in Fig.2 shows the resistance of the sample as a function of up to 0.5T. In higher field region, formation of the edge states and alignment of hole spins perpendicular to the plane bring about different physics. Therefore, we deal mainly with this low-field region. The magnetoresistance shows a clear commensurability peak marked as A by an arrow in the Fig.2. Generally such peaks in resistance appear when the carrier cyclotron orbits are commensurate with an ADL and localized in the lattice. For a circular Fermi contour, the classical cyclotron radius is expressed as
| (3) |
where the Fermi wavevector is written as with the hole concentration (here we assume the spin degeneracy is lifted). at peak position A in Fig.2 can be well ascribed to localized orbits of l-hole encircling single anti-dot. For h-hole, as noted above, we should take into account the effect of warped Fermi contour in Fig.1(b). This effect will be discussed in a separate paper. For a small hump structure around 0.05T, we do not have any appropriate interpretation at present.
As shown in Fig.2, an oscillation with a short period superposed on the commensurability peak is visible. In order to extract the oscillating component, we subtract the background commensurability structure by fitting slowly-varying functions. An example of extracted resistance variation is shown with the broken line in Fig.2, which exhibits a clear fast oscillation. Here for the background subtraction, a 12th order polynomial for each set of 100 consecutive data points is adopted. Although the selection of fitting function affects the outlook of the oscillatory component, little is affected in the main and sub peak structures in the Fourier space.

The observed oscillations are nearly periodic in . The SdH oscillation is not visible in this field range due to the restriction of the space for free cyclotron motion. The FT amplitude of the extracted oscillation is displayed in Fig.3. The magnetic field range is taken from 0.5T to 0.5T. At the main peak around 50T-1, clear splitting into three sub-peaks, marked as A, A’ and B’, is observed. Sub-peak A has a shoulder structure at lower frequency marked as B. From these four splitting frequency positions, the position of the main peak structure is determined to be 52T-1, where a sharp dip marked as C is located. If we measure the oscillation frequency with the magnetic flux on the circle with radius , position C just corresponds to the flux quantum , confirming that the peak structure originates from the AB effect around single anti-dots through the modulation in the density of states.
As noted above, the selection of functional form for background subtraction does not affect the characteristics shown in Fig.3 as long as the fitting function is slowly varying versus . We have even performed direct FT without subtraction. Though the background variation results in enhancement of unphysical low frequency component, the splitting of the main peak structure still exists in the result, confirming the above result.
Another characteristic structure in Fig.3 is a dip-peak structure around 110T-1, which corresponds to about twice the frequency of the main peak, and originates from the orbits with the winding number =2. The signal-to-noise ratio is not high enough to resolve detailed peak structure, nevertheless we may view it as a dip and two side peaks as indicated by arrows. Though there is no remarkable structure at the positions at around 3, a surprisingly clear peak is observed at the position for 4 as shown in the inset of Fig.3.

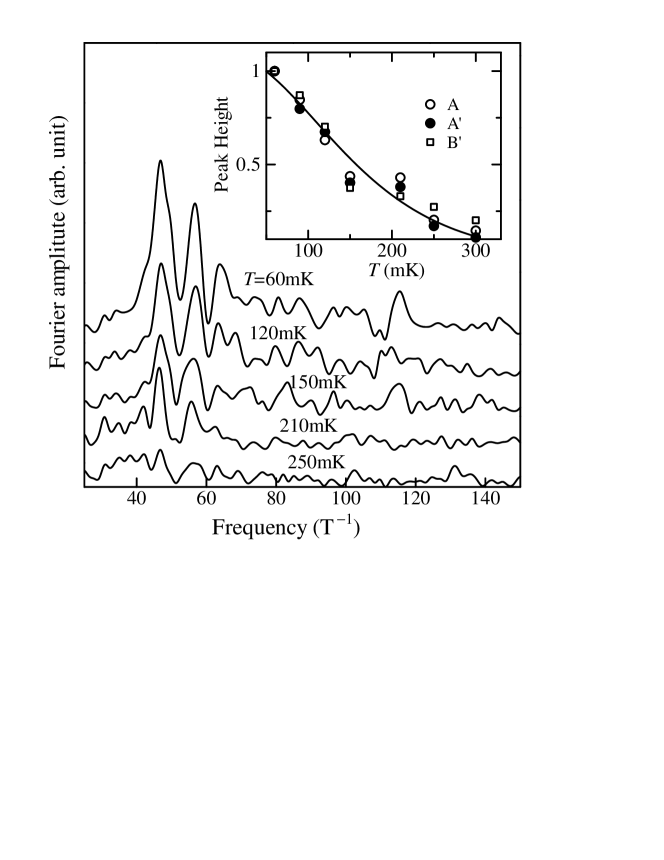
Figure 4 displays the temperature dependence of the FT spectrum. The three peaks (A, A’ and B’) show almost identical temperature dependence as seen in the inset of Fig.4, which can be fitted by the Dingle function,
| (4) |
where is the temperature and the energy difference between the peaks in the density of states modulation caused by the AB effect. The fitting gives the value of as 86eV. This is in similar order with other measurement in 2D electron systemsIye . The agreement in the temperature dependence manifests the three peaks have the same physical origin. There, we stressed the nature of the ensemble average in AB-type oscillations in ADLs, as opposed to the ordinary AB effect in single ring structure. The AB-type oscillation manifests the oscillatory fine structure of the density of state, and the temperature dependence of the oscillation amplitude can be explained by thermal broadening of the energy levels of the orbits.
We attribute the origin of the splitting to shifts in additional phases expressed in Eqs.1 and 2. In the simplest approximation the oscillatory resistance is written as the sum of four terms:
| (5) |
where is the AB phase given by . Because the phases in Eqs.1 and 2 are not linear in , each term in Eq.5 is not sinusoidal oscillation and hence the FT spectrum strongly depends on the region of transformation. By the same token, the FT lineshape for higher harmonics () is not simply -times enlargement in frequency axis of the main peak structure.

In order for a qualitative comparison with experiment, we calculate the FT spectra of Eq.5 in the magnetic field ranging from 0.5 to 0.5T with =4.1107m-1, which is the value measured from the SdH oscillation, and is taken to be . We adopt 0.55T for , which is reported for 2DHSs with conditions close to the present onesLu . The results are shown in Fig.5. Despite the crude approximation, the solid lines in Fig.5 bears striking resemblance to the experiment. For =1, clear splitting into 4 sub-peaks is observed. With increasing , the distribution of the peaks increases but the variation of the center peak structure is not monotonic. For =2, there is a sharp dip at the center while only a broad peak exists for . When is increased to 4, the peak distribution still broadens though the center peak resharpens. These changes in 3 and 4 explain the disappearance and reappearance of peak structure in the experiment.
As shown by the dotted lines in Fig.5, when there is no contribution of Berry’s phase, the characteristics of the center peak are completely different. No splitting appears even for =2; Rounding and sharpening for =3 and 4 do not appear either. These results hence support the interpretation that the splitting of FT peaks is due to the phases in Eqs.1 and 2 arising from the spin-orbit coupling, added to the AB phase. Equation 5 is too crude an approximation for further quantitative discussion. Especially, in ADLs, orbits encircling anti-dots may vary their sizes with , which is smaller effect than Berry’s phase and results in simple shift of peak positions. Shift of peak positions, e.g., for may be explained with this effect.
It should be remarked that the mean free path of the present 2DHG is about 600nm, which is much shorter than even the perimeter of a closed trace encircling a single anti-dot. This fact clearly emphasizes that the mean free path is essentially different from the phase coherence length, and also from the circumference of cyclotron orbit. The former difference has been repeatedly mentioned in literaturesImry while the latter manifests that the major origin of the scattering is impurity potential, which allows free space for ballistic cyclotron motions.
Another experimental fact that supports our interpretation is that the peak splitting in the FT spectra disappears in the AB-type oscillation in high fields, where the spin is fixed perpendicular to the plane and neither variation in Berry’s phase nor in occurs. This phenomenon will be reported in a separate paper.
In conclusion, we have observed spin-orbit Berry’s phase through splitting of Fourier transform peaks in the Aharonov-Bohm type oscillation of weak field magnetoresistance in an anti-dot lattice of a two-dimensional hole system. A simple simulation with adopting parameters obtained from independent measurements shows fair qualitative agreement with the experimental observations.
Acknowledgements.
The authors would like to thank K. Suzuki for help during this experiment. This work is supported by a Grant-in-Aid for Scientific Research from the Ministry of Education, Culture, Sports, Science, and Technology of Japan and also supported by Special Coordination Funds for Promoting Science and Technology.References
- (1) D. Loss, P. Goldbart and A. V. Balatsky, Phys. Rev. Lett. 65, 1655 (1990).
- (2) A. G. Aronov and Y. B. Lyanda-Geller, Phys. Rev. Lett. 70, 343 (1993).
- (3) A. Stern, Phys. Rev. Lett. 68, 1022 (1992).
- (4) T. Z. Qian and Z. B. Su, Phys. Rev. Lett. 72, 2311 (1994).
- (5) Y. Meir, Y. Gefen and O. Entin-Wohlman, Phys. Rev. Lett. 63, 798 (1989).
- (6) T. Ando, J. Phys. Soc. Jpn. 54, 1528 (1985).
- (7) U. Ekenberg, and M. Altarelli, Phys. Rev. B 30, 3569 (1984).
- (8) J. P. Eisenstein, H. L. Stormer, V. Narayanamurti, A. C. Gossard, and W. Wiegmann, Phys. Rev. Lett. 53, 2579 (1984).
- (9) J. P. Lu, J. B. Yau, S. P. Shukla, and M. Shayegan, Phys. Rev. Lett. 81, 1282 (1998).
- (10) Y. Iye, E. E. Mendez, W. I. Wang, and L. Esaki, Phys. Rev. B 33, 5854 (1986).
- (11) A. F. Mopurgo, J. P. Heida, T. M. Klapwijk, B. J. van Wees and G. Borghs, Phys. Rev. Lett. 80, 1050 (1998).
- (12) J.-B. Yau, E. P. De Poortere and M. Shayegan, Phys. Rev. Lett. 88, 146801 (2002).
- (13) M. J. Yang, C. H. Yang, and Y. B. Lyanda-Geller, Europhys. Lett. 66, 826 (1998).
- (14) D. Weiss, K. Richter, A. Menschig, R. Bergmann, H. Schweizer, K. von Klitzing, and G. Weimann, Phys. Rev. Lett. 70, 4118 (1993).
- (15) See for review e.g. T. Ando , S. Uryu , S. Ishizaka and T. Nakanishi, Chaos, Solitons & Fractals, 8, 1057 (1997).
- (16) F. Nihey and K. Nakamura, Physica B 184 (1993) 398.
- (17) Y. Iye, M. Ueki, A. Endo, and S. Katsumoto, J. Phys. Soc. Jpn. 73, 3370 (2004).
- (18) e.g. see Y. Imry, Introduction to Mesoscopic Physics 2nd ed. (Oxford, 2001).