The height dependence of temperature – velocity correlation in the solar photosphere
Abstract
We derive correlation coefficients between temperature and line-of-sight velocity as a function of optical depth throughout the solar photosphere for the non-magnetic photosphere and a small area of enhanced magnetic activity. The maximum anticorrelation of about between temperature and line-of-sight velocity in the non-magnetic photosphere occurs at . The magnetic field is another decorrelating factor along with 5-min oscillations and seeing.
1 Introduction
The correlative analysis proves to be an essential tool in disentangling of causal relations in the solar atmosphere. Recently, Rutten & Krijger (2003) and Rutten et al. (2004) quantified the correlation of the reversed granulation observed in the low chromosphere and mid-photosphere with surface granulation in quest for the nature of internetwork background brightness patterns in these layers. In agreement with these studies Puschmann et al. (2003) demonstrated that filtering out of the p-modes is inevitable for studying the convective structures in the solar photosphere because p-modes mostly reduce the correlation between various line parameters. Odert et al. (2005) showed that correlation coefficients can fluctuate strongly in time with amplitudes of over 0.4 due to 5-min oscillations and the amplitudes are larger for higher formed lines. In case of weak lines the situation worsens even more, because correlations derived from them are influenced stronger by seeing.
In this paper, we address the dissimilarity between non-magnetic and magnetic region seen in height variations of the correlation between temperature and line-of-sight velocity. We compare our results with a similar study by Rodríguez Hidalgo et al. (1999). Our analysis follows on the paper Koza et al. (2006, henceforth Paper I) and we invite the reader to have the paper at hand for further references.
2 Observational data and inversion procedure
We use a time sequence of spectrograms obtained at the German Vacuum Tower Telescope at the Observatorio del Teide on April 28, 2000. The inversion code SIR (Ruiz Cobo & del Toro Iniesta, 1992) was employed in the analysis of this observation. Thorough descriptions of the observational data, inversion procedure, and spectral lines are given in Paper I.
3 Results
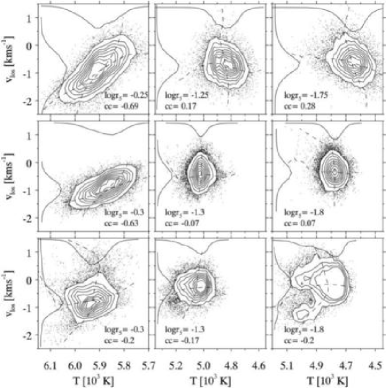
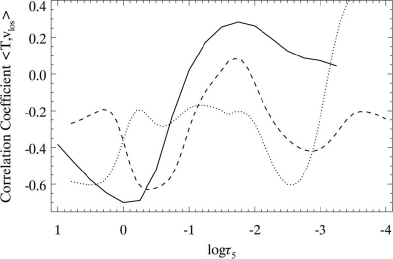
Figure 1 shows the height variations of the correlation between temperature and line-of-sight velocity for three different sets of data. The results of Rodríguez Hidalgo et al. (1999) indicate the significant anticorrelation between granules and intergranular lanes reaching the maximum of about at . The subsequent weakening of this anticorrelation over the range is followed by a rise of correlation up to 0.28 at the middle photosphere at . No significant correlation exists in the upper photosphere. In the lower layers of the non-magnetic region (Paper I) the anticorrelation decreases to at . However, in the middle photosphere temperature and line-of-sight velocity are almost uncorrelated with a local peak value of 0.08 at . Higher up at the anticorrelation of about is established again. In the sub-photospheric layers of the magnetic region the anticorrelation of was found at . An approximately constant value of anticorrelation was obtained in the low and middle photosphere. In the upper photosphere the anticorrelation reaches again .
Figure 2 compares temperatures and line-of-sight velocities in the form of scatter correlation plots. Each plotted sample represents temperature and line-of-sight velocity specified along the x and y axes at a given pixel along the slit at a time within the interval of 15 min. From the top down, the row panels show correlations of the results of Rodríguez Hidalgo et al. (1999) and our results in the non-magnetic and magnetic region in three selected optical depths and . Plot saturation is avoided by showing sample density contours rather than individual points, except for the extreme outliers. The total distributions of temperatures and line-of-sight velocities are shown at the top and the left side of each panel, respectively. The first-moment curves are aligned at large correlation and become perpendicular in the absence of any correlation (Rutten & Krijger, 2003). The first column in Fig. 2 shows good agreement of correlation coefficients and positions of maxima of velocity distributions in the non-magnetic region with the results of Rodríguez Hidalgo et al. (1999). However, the temperature distributions are dissimilar both in terms of asymmetry and also the positions of maxima. Our results indicate predominance of higher temperatures in the sample in contrast with lower temperatures prevailing in the results of Rodríguez Hidalgo et al. (1999). In the magnetic region, weak anticorrelation was found. The temperature distribution in this region is almost symmetric with maximum at higher temperatures than in the non-magnetic region. The second column of Fig. 2 corresponds to the layers where granulation is almost erased. While the temperature distributions in the non-magnetic region and in the results of Rodríguez Hidalgo et al. (1999) are symmetric, in the magnetic region the asymmetry indicates the abundant higher temperatures. The positive correlation in the results of Rodríguez Hidalgo et al. (1999) shown in the third column suggests reversed granulation. However, this is not seen in our results. In the magnetic region the asymmetries of temperature and velocity distributions indicate higher abundance of relatively hotter pixels with faster upflows.
4 Discussion
Figures 1 and 2 show dissimilarities both in height variations of correlation and distributions, although we and Rodríguez Hidalgo et al. (1999) used VTT observations and the SIR code. Because the maximum of anticorrelation found at sub-photospheric layers of the magnetic region is out of the range of sensitivity of the spectral lines (Paper I), we disregard this feature. Very low anticorrelation found over in the magnetic region (Fig. 1) suggests that magnetic field is another important decorrelating factor along with 5-min oscillations and seeing (Puschmann et al., 2003; Odert et al., 2005). In our results, the middle layers of the non-magnetic and magnetic region lack signatures of reversed granulations (Fig. 1). The sinusoidal shape of the correlation coefficient in the non-magnetic region over the range can be explained as a sum of positive correlation typical for reversed granulation and negative anticorrelation characteristic for 5-min oscillations.
5 Summary
Using a time sequence of high-resolution spectrograms and the SIR inversion code we have inferred height variation of correlation between the temperature and line-of-sight velocity throughout the quiet solar photosphere and a small magnetic region. The most important aspect is comparison of the results with the akin study by Rodríguez Hidalgo et al. (1999). We found in agreement with Rodríguez Hidalgo et al. (1999) that the maximum anticorrelation between the temperature and line-of-sight velocity in the non-magnetic region occurs at . The absence of signatures of reversed granulation in the middle layers of the non-magnetic region is likely to be due to 5-min oscillations, which negative anticorrelation prevails over weaker positive correlation typical for reversed granulation. Our results show that magnetic field is another decorrelating factor along with 5-min oscillations and seeing.
Acknowledgements.
The VTT is operated by the Kiepenheuer-Institut für Sonnenphysik, Freiburg, at the Observatorio del Teide of the Instituto de Astrofísica de Canarias. We are grateful to B. Ruiz Cobo (IAC) for kindly providing of the original data used in Figs. 1 and 2. This research is part of the European Solar Magnetism Network (EC/RTN contract HPRN-CT-2002-00313). This work was supported by the Slovak grant agency VEGA (2/6195/26) and by the Deutsche Forschungsgemeinschaft grant (DFG 436 SLK 113/7). J. Koza’s research is supported by a Marie Curie Intra-European Fellowships within the 6th European Community Framework Programme.References
- Koza et al. (2006) Koza, J., Kučera, A., Rybák, J., & Wöhl, H. 2006, A&A, 458, 941, (Paper I)
- Odert et al. (2005) Odert, P., Hanslmeier, A., Rybák, J., Kučera, A., & Wöhl, H. 2005, A&A, 444, 257
- Puschmann et al. (2003) Puschmann, K., Vázquez, M., Bonet, J. A., Ruiz Cobo, B., & Hanslmeier, A. 2003, A&A, 408, 363
- Rodríguez Hidalgo et al. (1999) Rodríguez Hidalgo, I., Ruiz Cobo, B., Collados, M., & del Toro Iniesta, J. C. 1999, in ASP Conf. Ser. 173: Stellar Structure: Theory and Test of Connective Energy Transport, ed. A. Giménez, E. F. Guinan, & B. Montesinos, 313
- Ruiz Cobo & del Toro Iniesta (1992) Ruiz Cobo, B. & del Toro Iniesta, J. C. 1992, ApJ, 398, 375
- Rutten et al. (2004) Rutten, R. J., de Wijn, A. G., & Sütterlin, P. 2004, A&A, 416, 333
- Rutten & Krijger (2003) Rutten, R. J. & Krijger, J. M. 2003, A&A, 407, 735