Fusion process studied with preequilibrium giant dipole resonance in time-dependent Hartree-Fock theory
Abstract
The equilibration of macroscopic degrees of freedom during the fusion of heavy nuclei, like the charge and the shape, are studied in the Time-Dependent Hartree-Fock theory. The preequilibrium Giant Dipole Resonance (GDR) is used to probe the fusion path. It is shown that such isovector collective state is excited in N/Z asymmetric fusion and to a less extent in mass asymmetric systems. The characteristics of this GDR are governed by the structure of the fused system in its preequilibrium phase, like its deformation, rotation and vibration. In particular, we show that a lowering of the preequilibrium GDR energy is expected as compared to the statistical one. Revisiting experimental data, we extract an evidence of this lowering for the first time. We also quantify the fusion-evaporation enhancement due to -ray emission from the preequilibrium GDR. This cooling mechanism along the fusion path may be suitable to synthesize in the future super heavy elements using radioactive beams with strong N/Z asymmetries in the entrance channel.
pacs:
24.30.Cz, 21.60.Jz, 25.70.Gh, 25.70.JjI Introduction
The fusion of two nuclei occurs at small impact parameters when the overlap between their wave functions is big enough to allow the strong interaction to overcome the Coulomb repulsion. Heavy-ion fusion reactions have numerous applications, like the study of high spin states in yrast and super-deformed bands jan91 or the formation of Heavy and Super Heavy Elements (SHE) hof98 . Induced by beams of unstable nuclei, this mechanism will also allow to produce very exotic species and allow for the study of isospin equilibration in the fused system.
The fusion process can be schematically divided in three steps: (i) an approach phase during which each nucleus feels only the Coulomb field of its partner and which ends up when the nuclear interaction starts to dominate, (ii) a rapid equilibration of the energy and the angular momentum transfered from the relative motion to the internal degrees of freedom, leading to the formation of a Compound Nucleus (CN) and (iii) a statistical decay of the CN. Lots of theoretical and experimental efforts das98 are made to understand step (i). These studies focus on an energy range located around the fusion barrier. At these energies the fusion is controlled by quantum tunneling which is strongly influenced by the couplings between the internal degrees of freedom and the relative motion of the two colliding partners. Although the cooling mechanisms involved in (iii) are well known and consist mainly in light particle and -ray emission in competition with fission for heavy systems, the initial conditions of the statistical decay depend on the equilibration process (ii) which is still subject to many debates nowadays. Indeed, step (ii) is characterized by an equilibration of several degrees of freedom like the shape bon80 or the charge bon81 which can be accompanied by the emission of preequilibrium particles. Such emission decreases the excitation energy and the angular momentum. The latter quantities are crucial and must be determined precisely because they have a major influence on the CN survival probability and therefore on the synthesis of very exotic systems such as the SHE.
In this paper we study the equilibration of the charges in fused systems, its interplay with other macroscopic degrees of freedom like the shape and the rotation, and its implications on the statistical decay. To probe theoretically and experimentally this way to fusion, we use the preequilibrium isovector Giant Dipole Resonance (GDR) cho1 ; bar1 ; bar2 ; bar3 ; sim1 . Giant Resonances are interpreted as the first quantum of collective vibrations involving protons and neutrons fluids. The Giant Monopole Resonance can be described as a breathing mode, an alternation of compression and dilatation of the whole nucleus. The GDR corresponds to a collective oscillation of the protons against the neutrons. The Giant Quadrupole Resonance consists in a nuclear shape oscillation between prolate and oblate deformations. Many other resonances have been discovered Wo87 ; Har01 . In particular Giant Resonances have been observed in hot nuclei formed by fusion New81 ; gaa . This demonstrates the survival of ordered vibrations in very excited systems, which are known to be chaotic, even if some Giant Resonance characteristics like the width are affected by the temperature bra89 ; cho95 . Moreover, the strong couplings between various collective modes which occur for Giant Resonances built on the ground state sim2 ; fal are still present in fusion reactions sim1 ; cho03 . It might therefore be possible to use the Giant Resonances properties to probe the nuclear structure of the composite system on its way to fusion.
The choice of the preequilibrium GDR, that is, a GDR excited in step (ii) before the formation of a fully equilibrated CN, is motivated by the fact that its properties strongly depend on the structure of the state on which it is built, for instance the deformation bon81 . The idea is to form a CN with two N/Z asymmetric reactants. Such a reaction may lead to the excitation of a dipole mode because of the presence of a net dipole moment in the entrance channel. This dipole oscillation should occur before the charges are fully equilibrated, that is, during the preequilibrium phase in which the system keeps a memory of the entrance channel bon81 ; cho1 ; sur89 ; bar1 ; bar2 ; bar3 ; das ; sim1 . In addition, for such N/Z asymmetric reactions, an enhancement of the fast GDR -ray emission is expected as compared to the ”slower” statistical -ray yield bar1 ; bar2 ; bar3 ; sim1 . This is of particular interest since the properties of these GDR -rays characterize the dinuclear system which precedes the hot equilibrated CN. The first experimental indications on the existence of such new phenomenon have been reported in fli ; cin ; pie03fus ; pie05 ; amo04 for fusion reactions and in cam95 ; san ; pap ; amo ; pie03deep ; pap03 ; amo04 ; pap05 in the case of deep inelastic collisions.
The paper is organized as follows: In Sec. II we study the properties of the preequilibrium GDR using the Time-Dependent Hartree-Fock (TDHF) formalism. In Sec. III we show how an N/Z asymmetric entrance channel may increase the fusion-evaporation cross-sections. Finally, we conclude in section IV.
II TDHF study of the preequilibrium Giant Dipole Resonance
At the early time of the fusion reaction, the system keeps the memory of the entrance channel. We call this stage of the collision the preequilibrium phase which ends when all the degrees of freedom are equilibrated in the compound system and when the statistical decay starts.
One of these degrees of freedom is the isospin, which measures the asymmetry between protons and neutrons. When the two nuclei have different N/Z ratios, the proton and neutron centers of mass of the total system do not coincide. As shown in cho1 ; das , there is a non zero force between the two kind of nucleons which tends to restore the initial isospin asymmetry. In such a case, an oscillation of protons against neutrons on the way to fusion might occur, that is, the so-called preequilibrium GDR bon81 ; sur89 ; cho1 ; bar1 ; bar2 ; bar3 ; sim1 .
In fusion reactions the shape of the system changes drastically during the preequilibrium phase. Studies of the dynamics in the fusion reaction mechanism requires sophisticated calculations to extract the preequilibrium GDR characteristics (energy, width…) and in turn, on the way to fusion. To achieve this goal, we choose to use, as in the pioneer work of Bonche and Ngô on charge equilibration bon81 , the TDHF approach because it is a fully microscopic theory which takes into account the quantal nature of the single particle dynamics. Moreover in the present study we will restrict ourself to the observation of one-body observables (e.g. the density ) which are supposed to be well described by such a mean field approach. However it is clear that an important challenge is to develop methods going beyond mean field which is beyond the scope of this paper.
In this section we present quantum calculations on preequilibrium giant collective vibrations using the TDHF theory. We shall start with a brief description of the TDHF theory in Sec. II.1. Then we examine the role of various relevant symmetries in the entrance channel, namely the N/Z and mass symmetries (Sec. II.2-II.4). Finally, in Sec. II.5 we shall compare our results with the experimental data obtained by Flibotte et al. fli .
II.1 TDHF approach
In the TDHF approach har ; foc ; dir30 ; vau ; eng75 ; bon ; neg , each single particle wave function is propagated in the mean field generated by the ensemble of particles. The mean field approximation does not take into account the dissipation due to two-body interactions gon ; won ; lac ; jui . However TDHF takes care of one-body mechanisms such as Landau spreading and evaporation damping cho2 . Quantum effects induced by the single particle dynamics like shell effects or modification of the moment of inertia sim04 are accounted for properly.
The main advantage of TDHF is its fully microscopic treatment of the N-body dynamics with the same effective interaction as the one used for the calculation of the Hartree-Fock (HF) ground sates of the collision partners. The consistency of the method for the structure of nuclei and the nuclear reactions increases its prediction power and its availability to study the interplay between exotic structures and reaction mechanisms.
Moreover the TDHF equation is strongly non linear which is of great importance for reactions around the barrier because it includes couplings between relative motion and internal degrees of freedom of the collision partners. Also TDHF provides a good description of collective motion and can even exhibit couplings between collective modes sim2 . In fact the TDHF theory is optimized for the prediction of expectation values of one-body observables and gives their exact evolution in the extreme case where the residual interaction vanishes. However, the TDHF prediction of multipole moments in nuclear collision, for instance, may differ from the correct evolution because of the omission of the residual interaction. An improvement of the description would be given by the inclusion of the effect of the residual interaction on the dynamics, which would increase considerably the computational time and is beyond the scope of this paper.
The TDHF theory describes the evolution of the one-body density matrix of matrix elements , where denotes the component with a spin and isospin of the occupied single particle wave-function . This evolution is determined by a non linear Liouville-von Neumann equation,
| (1) |
where is the matrix associated to the self consistent mean-field Hamiltonian. We have used the code built by P. Bonche and coworkers kim with an effective Skyrme interaction sky56 and SLy4 parameters kim . In its actual version, TDHF does not account for pairing interactions.
II.2 N/Z asymmetric reactions
As far as the dipole motion in the preequilibrium phase is concerned, it is obvious that the main relevant asymmetry responsible for such a motion is a difference in the charge-to-mass ratio between the collision partners cho1 . The associated experimental signature is an enhancement of the -ray emission in the GDR energy region of the compound system fli ; cin ; pie03fus ; pie05 ; amo04 which is attributed to a dipole oscillation. Several informations about the fusion path can be extracted from such a dipole oscillation and its corresponding -ray spectrum. For numerical tractability we start our study of the fusion process with a light system: 12Be+28SCa. We first deduce the -ray spectrum from the dipole motion. Then we study the effects of the deformation of the compound system, and of the impact parameter on this motion.
II.2.1 The preequilibrium GDR -ray spectrum
We first consider a central collision at an energy of MeV/nucleon in the center of mass. The expectation value of the dipole moment is defined by
| (2) |
where and are the positions of the proton and neutron centers of mass respectively. The expectation value of the conjugated dipole moment is then associated to the relative velocity between protons and neutrons, and is defined by the relation
| (3) |
where and are the total proton and neutron moments respectively. These definitions ensure the canonical commutation relation .
The time evolutions of and are plotted in Figs. 1-c and 1-b respectively. The trajectories in both the (,t) and (,t) planes exhibit oscillations which we attribute to the preequilibrium GDR. We also note that oscillates in phase quadrature with and that those oscillations are damped due to the one-body dissipation. Consequently, the plot of as a function of shown in Fig. 1-a is a spiral. The GDR period extracted from these plots is around fm/c, which corresponds to an energy of MeV.

During the collision and before the equilibrium is reached, a fast rearrangement of charges occurs within the composite system bon81 , generating the -ray emission. We extract the preequilibrium GDR -ray spectrum from the Fourier transform of the acceleration of the charges jac ; bar3
| (4) |
where is the fine structure constant and
The spectrum obtained from Eq. 4 is plotted in Fig. 2 (solid line). In order to have a spectrum without spurious peaks coming from the finite integration time, we multiply the quantity by a gaussian function mar05 . In addition, this function plays a role of a filter in the time domain. This filter prevents the signal to be affected by the interaction between the nucleus and the emitted nucleons which have been reflected on the box rei06 . We choose fm/c in our calculations. This ensures the fact that the spectra are free of spurious effects coming from the echo. However this procedure adds a width MeV. This is a drawback if one is concerned with detailed spectroscopy. However, in this paper, we are only interested by the gross properties of the preequilibrium GDR in order to study the fusion mechanisms. As we can see in Fig. 2, the preequilibrium GDR energy is MeV, which corresponds to the previous value deduced from the GDR oscillation period.

The energy of the preequilibrium GDR is much lower than the one of the GDR built on the spherical ground state of the 40Ca. This situation will be now explored into more details.
II.2.2 Deformation effect
To better characterize the preequilibrium GDR, it is necessary to compare it with the usual GDR built upon the CN ground state sur89 . This GDR is generated by applying an isovector dipole boost with a velocity on the 40Ca HF ground state yielding an oscillation of and in phase quadrature as we can see in Fig. 3. The period of the oscillation is around 80 fm/c which is lower than in the fusion case and corresponds to a higher energy ( MeV) as it is shown in the associated GDR -ray spectrum in Fig. 2 (dotted line). The lower energy obtained for the fusing system reveals a strong prolate deformation sim1 ; bon81 ; sur89 ; bar3 . The two mechanisms (fusion reaction and dipole boost) are expected to generate a GDR with quite different dynamical properties. This can be seen in the density plot projected in the reaction plane shown in Fig. 4, which shows that in the case of a fusion reaction, the CN relaxes its initial prolate elongation along the collision axis with a time which is larger than the typical dipole oscillation period of the GDR.


Deformation effects can be studied all along the fusion path bon80 ; sur89 . The quadrupole deformation parameter is defined by a scaling of the axis from a spherical to a deformed shape along the -axis
| (5) |
where is defined by the conservation of the volume of the nucleus , which leads to
| (6) |
If one neglects high order terms in , we get the usual value .
The deformation parameter is related to the expectation values of the monopole and quadrupole moments and which are expressed by
| (7) | |||||
| (8) |
We can write as a function of
| (9) |
| (10) |
Using Eqs. 6, 9, 10 and , we get
| (11) |
which, at first order in , becomes
| (12) |

In Ref. sim1 we used Eq. 12 to characterize the average deformation. In Fig. 5 we present the time evolution of the deformation, , obtained from the more general expression of given in Eq. 11. We consider a 40Ca formed in the 12Be+28S fusion reaction at an energy of 1 MeV/nucleon in the center of mass. The important point here is that the deformation does not relax and strongly affects the frequency of the oscillations. A lower energy is expected for the longitudinal collective motion in the fused system as compared to the one simulated in a spherical 40Ca bon81 ; sur89 ; bar1 ; bar2 ; bar3 ; sim1 . Following a macroscopic model for the dipole oscillation, we expect the energy of the GDR to evolve with the deformation along the -axis (collision axis) as
| (13) |
where is the average deformation during the preequilibrium stage. The frequency of the GDR along the deformation axis fulfills this relation with in excellent agreement with the observed deformation in Fig. 5.

We have also investigated the effect of the center of mass energy on the preequilibrium GDR energy and on the deformation parameter (see Fig. 6). The GDR energy exhibits small variations (less than 1 MeV) with the center of mass energy (Fig. 6-a). For MeV, the increase of with is attributed to the formation of a dinuclear system with a slow neck dynamics at low energy bar3 . The presence of the neck is in fact expected to slow down the charge equilibration process, and then to increase the GDR period.
For MeV, Fig. 6-a a decrease of when increases. As illustrated in Fig. 6-b, this is associated to a larger quadrupole deformation when the collision is more violent. Consequently, the higher the center of mass energy, the more prolately deformed the CN. In Fig. 6-b, the deformation is estimated from Eq. 13 (dashed line) and from Eq. 11 (solid line) at the first maximum after one oscillation of (e.g. at fm/c in the case of MeV/u as we can see in Fig. 5). We also observe in this energy domain a good agreement between the deformations calculated with both methods.
This lowering of the GDR energy due to deformation is not specific to nuclear physics. Indeed, an energy splitting of the isovector dipole mode has been observed in fissioning atomic clusters due to a strong prolate deformation of the fission phase cal . In such systems, the use of LASERs with the ”pulse and probe” technique is expected to give access to the deformation and also to the fission time din05 .
II.2.3 non central collisions
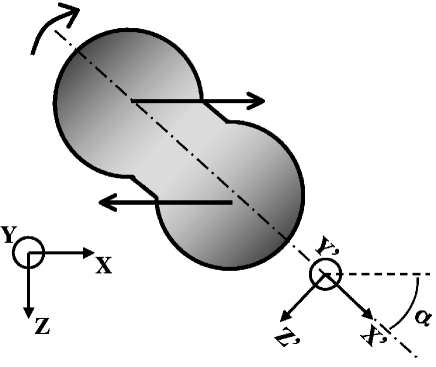
To better mimic the situation of a fusion reaction, we extended our calculations to non-zero impact parameters. In fact, a non central collision may excite collective rotational states in the deformed preequilibrated CN. This rotation may be coupled to the preequilibrium GDR sur89 . In particular, the interplay of dipole vibration and deformation can be affected by the rotation. In addition to the center of mass coordinates with along the beam axis and perpendicular to the reaction plane, we define a new coordinate system , , , where is the deformation axis, and is the rotation axis (see Fig. 7). In the head-on collision example studied previously, those two frames are the same. For symmetry reasons, the dipole oscillation cannot occur along the and axis.
For non-central collisions, the oscillation is only forbidden along the axis bon81 ; sur89 . In this case the amplitude of the oscillation along slightly decreases with the impact parameter. This decrease becomes significant at rather large impact parameters as we can see in Fig. 8 where we have plotted the amplitude of the first oscillation of the dipole moment along (solid line) as a function of the impact parameter. This decrease is accompanied by an oscillation of the dipole moment along the axis with a smaller amplitude which increases with the impact parameter . Both amplitudes are of the same order when fm.

The oscillation along the axis results from a weak symmetry breaking due to the rotation of the system sim1 . In order to demonstrate this, let us start with the time-dependent Schrödinger equation in the laboratory frame : In the rotating frame , the expression of the wave function is where is a rotation matrix, is the generator of the rotations around and is the angle between the two frames (see Fig. 7). We express the Schrödinger equation as and we get sim1
| (14) |
Eq. 14 is the Schrödinger equation expressed in the rotating frame of the CN and is the Hamiltonian expressed in this frame. The last term induces a motion along the axis from a dipole vibration along . It is quantified by the dipole moment along which is plotted as a dashed line in Fig. 8. This is a clear manifestation of couplings between rotational and vibrational motions in nuclei.
In this subsection we have shown that an N/Z asymmetry in the entrance channel generates a dipole oscillation during the preequilibrium phase of a fusion reaction. In the next one we will see that, due to polarization effects, such a motion also occurs in N/Z symmetric systems although with a smaller amplitude.
II.3 N/Z symmetric reactions

We now examine the situation of a central collision involving two nuclei using the example of 8Be+32S at MeV/nucleon (8Be is bound with a strong prolate deformation in Hartree-Fock calculations with the SLy4 force). As we can see in Fig. 9, the amplitude of the dipole oscillations is significantly reduced as compared to the N/Z asymmetric case (cf. Fig. 1-c). In this latter system (12Be+28S), the dipole oscillations are generated by the N/Z asymmetry, whereas in the 8Be+32S reaction, they are only due to the mass asymmetry of the two collision partners. Indeed, a mass asymmetry induces a difference in the isovector polarization in the collision partners. This polarization is due to Coulomb repulsion between protons of the colliding nuclei before the fusion starts bon81 .
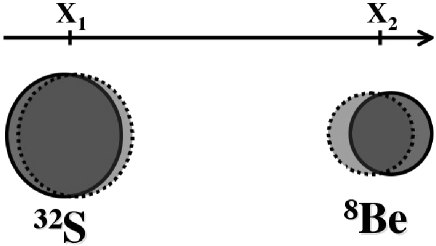
To show it, let us use an adiabatic approach in which we consider that the polarization of a nucleus at a distance between the centers of mass is generated by the Coulomb field of its collision partner. is the position of the center of mass of the nucleus . The distance between the proton and neutron centers of mass in nucleus is supposed to be small as compared to (see Fig. 10). The equality between the external Coulomb field and the restoring force between protons and neutrons leads to a dipole moment in the nucleus
where (for 32S) or 2 (for 8Be). The GDR energy is calculated in each collision partner from the dipole response frequency following a small amplitude dipole boost. We get MeV for 32S and MeV for 8Be along its deformation axis which is chosen to be aligned with the collision axis. The dipole moment in the total system becomes
| (15) |
The first term of the right hand side of Eq. 15 is usually dominant for a N/Z asymmetric reaction bar2 . However, it vanishes for a N/Z symmetric one. In this case, one is left with the sum of the dipole moments of the partners. This simple adiabatic model (dashed line in Fig. 9) gives the good trend of the total dipole moment up to the vicinity of the contact point.
After the fusion starts, the dipole moment increases and oscillates in the preequilibrium system. The adiabatic model is too simple to describe this phenomenon. In fact, due to the polarization, the nuclear interaction acts first on neutrons and then is expected to modify strongly the dipole moment at the initial stage of the fusion bon81 .
The consequence of this polarization in a mass asymmetric system is a dipole oscillation which can be interpreted, as previously, in term of an excitation of a preequilibrium GDR. However, the GDR excitation is very small as compared to the N/Z asymmetric case. Of course, for a mass and N/Z symmetric reaction no preequilibrium GDR are allowed for symmetry reason sim1 . As we will see in the next section, the special case of an N/Z asymmetric and mass symmetric system exhibits some interesting behaviors as far as the collective motions are concerned.
II.4 mass asymmetry and isoscalar vibrations
In this subsection we study the couplings between the isovector dipole motion and isoscalar vibrations in the preequilibrium phase and their dependence on the mass asymmetry in the entrance channel. The dipole motion can be coupled to isoscalar vibrations through the non linearity of the TDHF equation sim2 ; sim1 ; cho03 . The presence of such isoscalar vibrations in the preequilibrium system depends on the structure of the colliding partners and on their mass asymmetry. For instance a mass symmetric system has a stronger quadrupole deformation at the touching point than a mass asymmetric one. In such a system a quadrupole vibration might appear.
Let us start this study with the time evolution of the instantaneous dipole period sim1 which is very sensitive to couplings with isoscalar vibrations. We define this period as being twice the time to describe half a revolution in the spiral diagram representing the evolution of the system in the space. The resulting evolution is plotted in Fig. 11 for two N/Z asymmetric central collisions:
-
•
the mass asymmetric 12Be+28S reaction at MeV/nucleon.
-
•
the mass symmetric 20O + 20Mg reaction at MeV/nucleon.
The center of mass energy has been chosen to obtain the same ratio for both reactions ( is the Coulomb barrier).

The mean values of the GDR period obtained for the two reactions are different. For the mass symmetric reaction, this value is fm/c, whereas in the mass asymmetric case it is fm/c, in good agreement with the one obtained from Fig. 1 (107 fm/c). This difference is attributed to a larger deformation of the CN in the mass symmetric case which, in average, is (from Eq. 12), as compared to the mass asymmetric system (. Note that it is not appropriate to use Eq. 13, to calculate the deformation from the observed GDR energy frequency for 20O+20Mg since it is valid only for small deformations.
The dipole moment time evolution for those two reactions (Figs. 1 and 12), shows that unlike 20O+20Mg, the oscillations in the 12Be+28S system are dominated by a single energy. This is consistent with the evolution of the GDR period in Fig. 11 which is rather constant in the mass asymmetric case whereas it exhibits strong oscillations in the mass symmetric one. This anharmonicity can also be seen in the GDR -ray spectrum of the 20O+20Mg reaction plotted in Fig. 13. Indeed, one can clearly identify two peaks in this spectrum at 7.7 MeV and 10.8 MeV.


To better understand what is the origin of the differences between the two systems, we have calculated the evolutions of the monopole and quadrupole moments defined by Eqs. 7 and 8 respectively. Those evolutions are plotted in Fig. 14-a for 20O+20Mg. We first note that is always positive, that is, the compound system keeps a prolate deformation. In addition, and exhibit strong oscillations with the same period fm/c. Therefore, we conclude that they have the same origin which is interpreted as a vibration of the density around a prolate shape sim1 . This mode is only excited in the mass symmetric channel: the evolutions of and for the mass asymmetric reaction (12Be+28S) at 1 MeV/nucleon in the center of mass (thick lines in Fig. 14-b) do not show any significant oscillation of these moments. Evolutions of and at 1.6 MeV/nucleon in the center of mass are also plotted (thin lines in Fig. 14-b). They do not exhibit any significant oscillation neither. Therefore, the vibrations observed in Fig. 14-a are not attributed to a difference in the collision energy but to the mass asymmetry in the entrance channel.
The monopole and quadrupole oscillations modify the properties of the dipole mode in a time dependent way sur89 ; bar2 . Let us consider a harmonic oscillator for the dipole motion with a time dependent rigidity constant. This is a way to simulate the non linearities of TDHF. Indeed, the observed oscillation of the density modifies the restoring force between protons and neutrons. This is due to the fact that the density enters in the mean field potential of the TDHF equation (Eq. 1). This restoring force is lower along the deformation axis of a prolately deformed nucleus than in the perpendicular axis. Thus, variations of the density profile in the TDHF equation can be modeled by a corresponding variation of the rigidity constant . In such a model, the evolution of the dipole moment is given by the differential equation where is the reduced mass of the system. We note the average pulsation related to the rigidity constant given by , where is the pulsation of the density oscillation deduced from Fig. 14-a and is a dimensionless constant which quantifies the coupling between the GDR and the other collective mode associated to the density vibration. We thus have
| (16) |
This equation is the so called Mathieu’s equation sim1 .
It is interesting to show how we can get this equation from a more microscopic equation like the TDHF one (Eq. 1) in a one dimensional framework. Following the way of ref. sch , the Wigner transform of Eq. 1 for a local self consistent potential is
| (17) |
where is the Wigner transform of the density matrix . The upper indices on the derivative operators in Eq. 17 stand for the function on which the operator acts. We have of course where and are the Wigner transforms of the proton and neutron density matrices respectively.
We now apply the Wigner Function Moment (WFM) method to get a closed system of dynamical equations for the dipole and its conjugated moments. We calculate the integrals on the phase space of Eq. 17 with the weights on the one hand, and on the other hand ( for protons and for neutrons). The distance between proton and neutron centers of mass can be written as and we get
where the time dependence has been omitted for simplicity. The right hand side term is the integral of multiple -derivatives of so it vanishes because , and all their derivatives vanish for . With being the relative momentum between protons and neutrons we get
| (18) |
We now calculate the integral of Eq. 17 with the weight . Noting the matter density and the kinetic energy density we have
Using for we have
| (19) |
Eqs. 18 and 19 are the system of dynamical equations of motion we were looking for. It is important to stress that this system of equations is obtained without approximation for a local potential. To go further, we need an explicit form of the potential. If we consider for instance a harmonic oscillator , we obtain the dipole moment evolution equation: with the solution , where .
If a breathing mode occurs at a pulsation , then the density oscillates with the pulsation : . Since the potential is self consistent, it also presents oscillations which are a function of : . We assume for this potential the separable form , where is the potential when no breathing mode is excited. Using a harmonic picture for , that is, , we get from Eqs. 18 and 19 the equation for the dipole moment :
| (20) |
We finally see that the Mathieu’s equation (Eq. 16) appears to be an approximation of Eq. 20 where only the linear part of the function is conserved.

We have solved the Mathieu’s equation numerically with a set of parameters suitable for our problem. The pulsation of the density oscillation is extracted from Fig. 14-a and we get MeV. For the pulsation of the GDR we choose the main peak at MeV/ (see Fig. 12). It is related to the pulsation by the relation . The constants and are tuned to reproduce approximatively the TDHF results period. The parameter is expected to be close to but not exactly because of the presence of the oscillating term which may slightly change the mean value of the dipole pulsation. The solution of the Mathieu’s equation oscillates with a time-dependent period which reproduces the TDHF case quite well with and (see Fig. 15).

In a recent paper cho03 , following the formalism developed in a study of non linear vibrations sim2 , we related to a matrix element of the residual interaction coupling collective states.
As a consequence, the excitation of collective modes such as the quadrupole and monopole vibrations is coupled to the preequilibrium GDR. Such vibrations occur only in the mass symmetric reaction we studied. The effects of this coupling are a reduction of the GDR energy (estimated around 10 per cent in this case) and an additional spreading of the resonance line shape due to the modulation of the dipole frequency.
II.5 comparison with experiments
As a test case, we have performed TDHF calculations of the reactions studied by Flibotte et al. fli . In this paper, two systems have been investigated: an N/Z asymmetric one (40Ca+100Mo) and an N/Z quasi-symmetric one (36S+104Pd) at a center of mass energy of 0.83 MeV/nucleon. These systems have been chosen because they lead to the same composite system (140Sm). The corresponding dipole evolutions obtained from TDHF are plotted in Fig. 16 for the N/Z asymmetric reaction and in Fig. 17 for the N/Z quasi-symmetric one. A dipole oscillation is observed in both reactions but with a stronger amplitude in the N/Z asymmetric one.


The preequilibrium GDR -ray spectra for those reactions are calculated using Eq. 4 and plotted in Fig. 18-a. The area under the peak associated to the N/Z asymmetric reaction (solid line) is considerably larger than the one under the N/Z quasi-symmetric one (dashed line).
To estimate the importance of the preequilibrium -ray emission with respect to the statistical decay and its role on the fusion process, we have calculated the spectrum associated to the first chance statistical -ray decay. It is obtained from the -ray emission probability in all directions per energy unit assuming an equilibrated CN sno ; bar3 ; bri . Its expression is
| (21) |
where is the nucleon mass, and are the width and the energy of the statistical GDR respectively, and is the temperature of the equilibrated CN. At first order, the energy of the GDR does not depend on the temperature gaa . We use the values MeV and MeV. Following the same method as the one employed in Ref. bar3 , we approximate the CN width with the total neutron width
| (22) |
where MeV is the neutron binding energy and fm. The temperature is calculated from the equation
| (23) |
where MeV-1 is the level density parameter and MeV is the excitation energy. The resulting spectrum is plotted in Fig. 18-a (dotted line).
We note that the N/Z asymmetric preequilibrium spectrum is comparable in intensity to the first step statistical one. This fact has already been pointed out by Baran et al. bar3 who got a similar spectrum for the N/Z asymmetric reaction with a semiclassical approach.
Another important conclusion which can be drawn from Fig. 18-a is the lowering of the GDR -ray energy for the non statistical part as compared to the statistical one which is attributed to the deformation of the nucleus (see sec. II.2.2). This phenomenon is also reported by Baran et al. bar3 . In fact we get from Fig. 18-a a position of the peak of about 7.5 MeV for the preequilibrium GDR while Baran et al. obtained 9 MeV. On the experimental side, the -ray spectra are dominated by a statistical background decreasing exponentially. In addition to this background, the GDR creates a bump located around the GDR energy (Fig. 1 of Ref. fli ). To get rid of the statistical background, the authors of fli linearized the -ray spectra by dividing them by a theoretical statistical background. The resulting spectra are plotted in Fig. 2 of Ref. fli . This procedure is used by the authors to determine the preequilibrium to statistical ratio for the GDR component. However it cannot be used to determine the positions in energy of the peaks because the division by an exponential background induces a shift in energy which is different for both contributions (statistical and preequilibrium) if they are not centered around the same energy, as expected from Fig. 18-a.
We modified the procedure as follows. First, we assume that no preequilibrium -ray is emitted in the N/Z quasi-symmetric reaction 36S+104Pd. We then subtract the total -ray spectrum associated to the quasi-symmetric reaction from the N/Z asymmetric one. These two spectra are plotted in Fig. 1 of Ref. fli . The result of this subtraction is the preequilibrium component of the GDR in the reaction 40Ca+100Mo, and is plotted in Fig. 18-b. The error bars are both statistical and systematic due to the graphical extraction of the data. Below 5 MeV the systematic error is to high to get relevant data. Focusing on the energy position of the preequilibrium component, we note a good agreement between TDHF predictions and experimental data.
To conclude, we extracted from existing data, for the first time, an experimental observation of the lowering of the preequilibrium GDR predicted by our TDHF calculations. This analysis shows that the preequilibrium GDR is, indeed, a powerful experimental tool to study the fusion path. Another application of N/Z asymmetric fusion reactions is proposed in the next section.

III Fusion/Evaporation Cross Sections of heavy nuclei
As mentioned in bar3 , the emission of a preequilibrium GDR -ray decreases the excitation energy hence the initial temperature of the nucleus reaching the statistical phase. The emission of preequilibrium particles, which can be controlled in our example by the N/Z asymmetry, is thus a new interesting cooling mechanism for the formation of Heavy and Super Heavy Elements. For such nuclei, the statistical fission considerably dominates the neutron emission and the survival probability of the CN becomes very small.
SHE must be populated at low excitation energy. Firstly, because the smaller the excitation energy, the smaller the fission probability. Secondly, because the shell corrections decrease with excitation energy ign79 . These corrections are responsible for the stability of the transfermiums nuclei () in their ground state. The quantum stabilization decreases quite rapidly with excitation energy until the fission barrier vanishes. Those two reasons are strong motivations to study the cooling mechanisms involved in the preequilibrium phase of the CN formation.
In the following, we expose one cooling mechanism responsible for the predicted enhancement of the survival probability in the case of a N/Z asymmetric reaction. As an illustration, we treat only the -emission part of the preequilibrium GDR decay. Although it may play an important role, we do not treat the preequilibrium neutron emission for two reasons:
-
•
Only the direct neutron decay of giant resonances can be assessed in TDHF. Then, we would be able to describe only a small part of this neutron emission, the other parts being the sequential and statistical decays. Missing the sequential decay would be a strong limitation of the description.
-
•
We would need not only the number of emitted neutrons, but also their energy. Consequently, huge spatial grid would have to be used in order to perform a spatial Fourier transform of the single particle wave functions, which is out of range of three dimensional TDHF codes because of computational limitations.
Let us define the survival probability at an excitation energy of a CN which started its statistical decay at the energy . We also note and the final survival probabilities of the CN formed by N/Z symmetric and asymmetric reactions respectively.
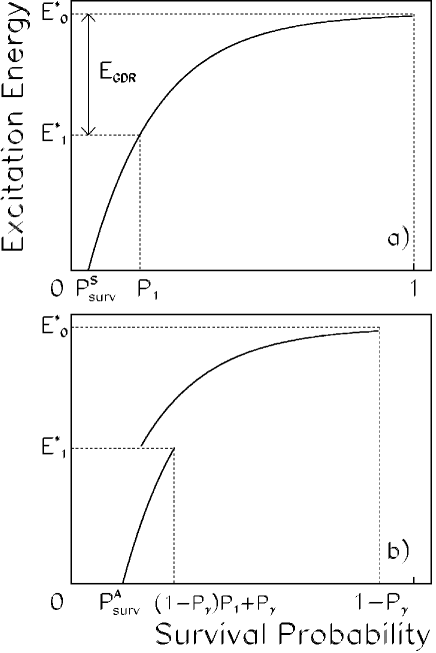
Fig. 19-a illustrates schematically the evolution of the survival probability (x-axis) when the excitation energy decreases (y-axis) in a case of an N/Z symmetry in the entrance channel. In this case, no -ray emission is expected in the preequilibrium phase and the initial excitation energy is always maximum , where is the excitation energy when no preequilibrium particles are emitted, is the center of mass energy and . During the statistical decay, the excitation energy decreases mainly through neutron emission, but at the same time the survival probability of the compound nucleus decreases too. For instance, when the excitation energy reaches , the survival probability at this energy might be small. At the end of the decay, when the excitation energy is zero, the survival probability becomes
Fig. 19-b shows the same for an N/Z asymmetric reaction. In this last case, the nucleus can emit a preequilibrium GDR -ray with a probability . The nuclei which emit such a -ray begin the statistical decay at a lower energy , whereas those which did not emit a -ray still starts their decay at . The probability for the latter case is . The survival probability at the end of the decay then reads . The ratio of the survival probabilities between the N/Z symmetric and asymmetric cases is
| (24) |
We now use a simple model to get an estimate of this quantity. It is clear that, to get a quantitative predictions of survival probabilities, the studied mechanism has to be included in more elaborated statistical models, which is beyond the scope of this paper. The probability can be calculated by integrating Eq. 4 over the energy range. This can be done for example with a TDHF calculation or using the classical electrodynamic formulae from Ref. jac . Following these formulae, we approximate the probability to emit a preequilibrium GDR -ray per interval of energy by
where is the “shifted” energy of the damped harmonic motion and is the damping width of the preequilibrium GDR. The initial value of the dipole moment, , can be estimated from Eq. 15 at the touching point and neglecting the polarization of the collision partners bar2 . We get
where is the radius of nucleus .
To determine , we need to solve a system of six equations: Eqs. 22, 23 and
| (25) |
| (26) |
| (27) |
| (28) |
Eq. 25 gives the evolution of the excitation energy, assuming as in bar3 that the CN width can be identified to the neutron width. This implies that we neglect the statistical gamma emission. This choice is justified by the fact that the statistical neutron emission is much more probable than the gamma emission in the excitation energy domain of interest where the fission dominates, which is above the neutron emission threshold . Eq. 26 gives the evolution of the survival probability against fission . Eq. 27 gives the evolution of the fission width. The parameters and are the oscillator frequencies of the two parabolas approximating the potential in the first minimum and at the saddle point respectively. The variable is related to the distance between the mass centers of the nascent fission fragments (see ari ) and s-1 is the reduced friction. Eq. 28 gives the evolution of the fission barrier . For SHE, this barrier has only a quantum nature and vanishes at high excitation energy. MeV is the shell damping energy ari . We consider that a CN with an excitation energy between and decays only by fission or neutron emission.
We take here the example of the reaction 124Xe+141XeHs∗ at the fusion barrier (), that is, an excitation energy MeV. With an energy and a width of the GDR of 13 MeV and 4 MeV respectively, the preequilibrium -ray emission probability is . For the statistical decay we take MeV, MeV and MeV/. We also get a survival probability which is small as compared to . Following Eq. 24, the enhancement of the total survival probability due solely to the N/Z asymmetry in the entrance channel becomes .
To conclude, we see that such an effect may be useful for the formation of Heavy and Super Heavy Elements. Indeed, based on our conclusions, very asymmetric N/Z collisions induced by radioactive ion beams that are coming online in several laboratories, should allow the synthesis SHE with a larger cross sections than are obtainable with beams of stable isotopes.
IV conclusion
In this paper we have performed TDHF calculations to study in some details the properties of the preequilibrium GDR that can be excited before the formation of a fully equilibrated CN. We have shown that this probe can be used to better understand the early stage of the fusion path, and more precisely the charge equilibration. We have clarified the role of the N/Z and/or mass asymmetries on the GDR excitation. The energy of the preequilibrium GDR is expected to decrease with excitation energy, an effect attributed to a strong prolate shape associated to the fused system. We presented the first experimental indication of this shift in energy. The calculations for an N/Z asymmetric collisions at non zero impact parameters have been performed and revealed couplings between the dipole oscillations and the CN rotation. Other couplings between vibrational modes for mass symmetric reactions have also been studied.
Finally we suggest that the use of N/Z asymmetric fusion reactions is a good choice to synthesize Heavy and Super Heavy Elements. In that case, the preequilibrium GDR -ray emission cooling mechanism might be well suited to reach the statistical phase with a low excitation energy yielding a larger survival probability against fission. The availability of radioactive beams with large N/Z asymmetry and sufficient intensities for these kind of studies will be extremely useful to check experimentally our predictions in the near future.
Acknowledgements.
This paper is dedicated to the memory of P. Bonche, the author of the TDHF code we used. We are grateful to M. Di Toro for a useful reading of the manuscript. We also thank V. Baran, M. Colonna, D. Lacroix, D. Boilley and J. P. Wieleczko for several fruitful discussions, and P. Schuck for providing a pertinent reference.References
- (1) R.V.F. Janssens and T.L. Khoo, Ann. Rev. Nucl. Part. Sci. 41, 321 (1991).
- (2) S. Hofmann, Rep. Prog. Phys. 61 , 639 (1998).
- (3) M. Dasgupta, D. J. Hinde, N. Rowley and A. M. Stefanini, Ann. Rev. Nucl. Part. Sci. 48, 401 (1998).
- (4) P. Bonche and B. Grammaticos, Phys. Lett. B 95, 198 (1980).
- (5) P. Bonche and N. Ngô, Phys. Lett. B 105, 17 (1981).
- (6) Ph. Chomaz, M. Di Toro and A. Smerzi, Nucl. Phys. A 563, 509 (1993).
- (7) V. Baran, M. Colonna, M. Di Toro, A. Guarnera and A. Smerzi, Nucl. Phys. A 600, 111 (1996).
- (8) V. Baran, M. Cabibbo, M. Colonna, M. Di Toro and N. Tsoneva, Nucl. Phys. A 679, 373 (2001).
- (9) V. Baran, D. M. Brink, M. Colonna and M. Di Toro, Phys. Rev. Lett. 87, 182501 (2001).
- (10) C. Simenel, Ph. Chomaz and G. de France, Phys. Rev. Lett. 86, 2971 (2001).
- (11) A. Van der Woude, Prog. in Part. and Nucl. Phys. 18, 217 (1987).
- (12) M. N. Harakeh and A. van der Woude, Giant Resonances: Fundamental High-Frequency Modes of Nuclear Excitation, Oxford Science publications (2001).
- (13) J. O. Newton et al., Phys. Rev. Lett. 46, 1383 (1981).
- (14) J.J. Gaardhoje, Ann. Rev. Nucl. Part. Sci. 42, 483 (1992).
- (15) A. Bracco et al., Phys. Rev. Lett. 62, 2080 (1989).
- (16) Ph. Chomaz, Phys. Lett. B 347, 1 (1995).
- (17) C. Simenel and Ph. Chomaz, Phys. Rev. C 68, 024302 (2003).
- (18) M. Fallot, Ph. Chomaz, M. V. Andrès, F. Catara, E. G. Lanza and J. A. Scarpaci, Nucl. Phys. A 729, 699 (2003).
- (19) Ph. Chomaz and C. Simenel, Nucl. Phys. A 731, 188c (2004).
- (20) E. Suraud, M. Pi and P. Schuck, Nucl. Phys. A 492, 294 (1989).
- (21) C. H. Dasso, H. Sofia and A. Vitturi, Eur. Phys. J. A 12, 279 (2001).
- (22) S. Flibotte et al., Phys. Rev. Lett. 77, 1448 (1996).
- (23) M. Cinausero et. al, Nuov. Cim. A 111, 613 (1998).
- (24) D. Pierroutsakou et al., Eur. Phys. J. A 17, 71 (2003).
- (25) D. Pierroutsakou et al., Phys. Rev. C 71, 054605 (2005).
- (26) F. Amorini et al., Phys. Rev. C 69, 014608 (2004).
- (27) L. Campajola et al., Z. Phys. A 352, 421 (1995).
- (28) F. Amorini et al., Phys. Rev. C 58, 987 (1998).
- (29) M. Sandoli et al., Eur. Phys. J. A 6, 275 (1999).
- (30) M. Papa et al., Eur. Phys. J. A 4, 69 (1999).
- (31) D. Pierroutsakou et al., Eur. Phys. J. A 16, 423 (2003).
- (32) M. Papa et al., Phys. Rev. C 68, 034606 (2003).
- (33) M. Papa et al., Phys. Rev. C 72, 064608 (2005).
- (34) D. R. Hartree, Proc. Cambridge Philos. Soc. 24, 89 (1928).
- (35) V. A. Fock, Z. Phys. 61, 126 (1930).
- (36) P.A.M. Dirac, Proc. Camb. Phil. Soc. 26, 376 (1930).
- (37) D. Vautherin and D. M. Brink, Phys. Rev. C 5, 626 (1972).
- (38) Y.M. Engel, D.M. Brink and K. Goeke, S.J. Krieger and D. Vautherin Nuc. Phys. A 249, 215 (1975).
- (39) P. Bonche, S. Koonin and J. W. Negele, Phys. Rev. C 13, 1226 (1976).
- (40) J. W. Negele, Rev. Mod. Phys. 54, 913 (1982).
- (41) M. Gong, M. Thoyama and J. Randrup, Z. Phys. A 335, 331 (1990).
- (42) C. Y. Wong and H. H. K. Tang, Phys. Rev. Lett. 40, 1070 (1978).
- (43) D. Lacroix, S. Ayik and Ph. Chomaz, Prog. Part. Nucl. Phys. 52, 497 (2004).
- (44) O. Juillet and Ph. Chomaz, Phys. Rev. Lett. 88, 142503 (2002).
- (45) Ph. Chomaz, N. V. Giai, and S. Ayik, Phys. Lett. B 189, 375 (1987).
- (46) C. Simenel, Ph. Chomaz and G. de France, Phys. Rev. Lett. 93, 102701 (2004).
- (47) K.-H. Kim, T. Otsuka and P. Bonche, J. Phys. G 23, 1267 (1997).
- (48) T. Skyrme, Phil. Mag. 1, 1043 (1956).
- (49) J. D. Jackson, Classical Electrodynamics (Wiley, New York, 1962), Eq. (15.1).
- (50) J. A. Maruhn, P. G. Reinhard, P. D. Stevenson, J. R. Stone and M. R. Strayer, Phys. Rev. C 71, 064328 (2005).
- (51) P.-G. Reinhard et al., Phys. Rev. E 73, 036709 (2006).
- (52) F. Calvayrac, S. El-Gammal, C. Kohl, P.-G. Reinhard and E. Suraud, Nuov. Cim. A 110, 1175 (1997).
- (53) P. M.Dinh, P. G. Reinhard and E. Suraud, J. Phys. B 38, 1637M (2005).
- (54) E. B. Balbutsev and P. Schuck, Nucl. Phys. A 652, 221 (1999).
- (55) D. M. Brink, Nucl. Phys. A 482, 3c (1988).
- (56) K.A. Snover, Annu. Rev. Nucl. Part. Sci. 36, 545 (1986).
- (57) A. V. Ignatyuk, K. K. Istekov et G. N. Smirenkin, Sov. J. Nucl. Phys. 30, 626 (1979).
- (58) Y. Aritomo, T. Wada, M. Ohta and Y. Abe, Phys. Rev. C 59, 796 (1999).