Conduction electron spin-lattice relaxation time in the MgB2 superconductor
Abstract
The spin-lattice relaxation time, , of conduction electrons is measured as a function of temperature and magnetic field in MgB2. The method is based on the detection of the component of the conduction electron magnetization under electron spin resonance conditions with amplitude modulated microwave excitation. Measurement of below at 0.32 T allows to disentangle contributions from the two Fermi surfaces of MgB2 as this field restores normal state on the Fermi surface part with symmetry only.
I Introduction
The conduction electron spin-lattice relaxation time in metals, , is the characteristic time for the return to thermal equilibrium of a spin system driven out of equilibrium by e.g. a microwave field at electron-spin resonance (ESR) or a spin-polarized current. The applicability of metals in “spintronics” devices in which information is processed using electron spins Žutić et al. (2004) depends on a sufficiently long spin life-time. In pure metals is limited by the Elliott mechanism Elliott (1954); Yafet (1983), i.e. the scattering of conduction electrons by the random spin-orbit potential of non-magnetic impurities or phonons. In superconductors, the Elliott mechanism becomes ineffective and a long is predicted well below Yafet (1983). Here we report the direct measurement of the spin-lattice relaxation time of conduction electrons in MgB2 in the superconducting state. The motivation to study the magnetic field and temperature dependence of is two-fold: i) to test the predicted lengthening of to temperatures well below , ii) to measure the contributions to from different Fermi surface sheets and to compare with the corresponding momentum life-times, .
The lengthening of has been observed in a restricted temperature range below in the fulleride superconductor, K3C60 by measuring the conduction electron-spin resonance (CESR) line-width, Nemes et al. (2000). This method assumes , where is the electron gyromagnetic ratio, and is the spin-spin or transversal relaxation rate. It is limited to cases where the homogeneous broadening of the CESR line due to a finite spin lifetime outweighs , the line broadening from inhomogeneities of the magnetic field. In a superconducting powder sample, the CESR line is inhomogeneously broadened below the irreversibility line due to the distribution of vorteces, which is temperature and magnetic field dependent. This prevents the measurement of from the line-width and calls for a method to directly measure . Electron spin echo techniques, which usually enable the measurement of , are not available for the required nanosecond time resolution range. The magnetic resonance technique, termed longitudinally detected (LOD) ESR Murányi et al. (2004); Simon and Murányi (2005) used in this work allows to measure ’s as short as a few ns. The method is based on the measurement of the electron spin magnetization along the magnetic field, , using modulated microwave excitation. recovers to its equilibrium value with the time-constant, thus the method allows the direct measurement of independent of magnetic field inhomogeneities.
MgB2 has a high superconducting transition temperature of K Nagamatsu et al. (2001) and its unusual physical properties Bouquet et al. (2001); Szabó et al. (2001); Bouquet et al. (2002); Tsuda et al. (2003) are attributed Kortus et al. (2001); Choi et al. (2002) to its disconnected, weakly interacting Fermi surface (FS) parts. The Fermi surface sheets derived from B-B bonds with and characters ( and FS) have smaller and higher electron-phonon couplings and superconductor gaps, respectively, and contribute roughly equally to the density of states (DOS). The strange band structure leads to unique thermodynamic properties: magnetic fields of about 0.3-0.4 T restore the FS well below for all field orientations in polycrystalline samples but the material remains superconducting to much higher fields. This is characterized by a small and nearly isotropic upper critical field, T Bouquet et al. (2002); Eskildsen et al. (2002) and a strongly anisotropic one, T, Simon et al. (2001); Bouquet et al. (2002); Angst et al. (2002) related to the and Fermi surface sheets, respectively. Our measurements at low fields and low temperatures determine from the FS alone, while high field and high temperature experiments measure averaged over the whole FS. We find that spin relaxation in high purity MgB2 is temperature independent in the high field normal state between 3 K and 50 K, indicating that it arises from non magnetic impurities. Spin relaxation times for electrons on the and Fermi surface sheets are widely different but are not proportional to the corresponding momentum relaxation times.
II Experimental
The same MgB2 samples were used as in a previous study Simon et al. (2005). Thorough grinding, particle size selection and mixing with SnO2, an ESR silent oxide, produced a fine powder with well separated small metallic particles. The nearly symmetric appearance of the CESR signal Dyson (1955) proves that penetration of microwaves is homogeneous and that the particles are smaller than the microwave penetration depth of . SQUID magnetometry showed that grinding and particle selection do not affect the superconducting properties. The particles are not single crystals but rather aggregates of small sized single crystals. Continuous wave (cw) and longitudinally detected ESR experiments were performed in a home-built apparatus Simon and Murányi (2005) at 9.1 and 35.4 GHz microwave frequencies, corresponding to 0.32 and 1.27 T resonance magnetic fields. The 9.1 GHz apparatus is based on a loop-gap resonator with a low quality factor () and the 35.4 GHz instrument does not employ a microwave cavity at all. The cw-ESR was detected using an audio frequency magnetic field modulation. Line-widths are determined by Lorentzian fits to the cw-ESR data. For the LOD-ESR, the microwaves are amplitude modulated with of typically 10 MHz and the resulting varying component of the sample magnetization is detected with a coil which is parallel to the external magnetic field and is part of a resonant circuit that is tuned to and is matched to 50 Ohms. cw-ESR at 420 GHz (centered at 15.0 T) was performed at EPFL using a quasi-optical microwave bridge with no resonant cavities.
III Results
III.1 Relaxation in the normal state
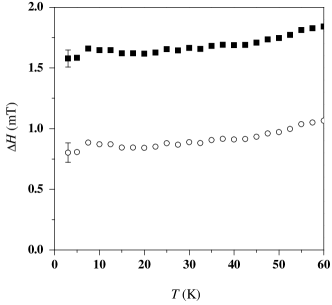
The low temperature behavior of the spin-lattice relaxation time in MgB2 in the normal state can be measured using cw-ESR from the homogeneous line-width, , using at high fields, that suppresses superconductivity. The maximum upper critical field is T for particles with field in the crystallographic plane in the polycrystalline sample at zero temperature Finnemore et al. (2001). We did not observe any effects of superconductivity on the CESR, at 15 T it is suppressed in the full sample above a temperature of a few K. Fig. 1 shows that the temperature dependence of the CESR line-width at 15 T is small below 40 K.

The CESR line-width is magnetic field dependent as shown in Fig. 2 at 40 K: it is linear as function of magnetic field with , where mT is the residual line-width and mT/T. The residual homogeneous line-width corresponds to ns at 40 K. The linear relation can be used to correct the 15 T CESR line-width data to obtain the homogeneous contribution, as the magnetic field dependence is expected to be temperature independent. We show the homogeneous line-width in Fig. 1. We find that it is temperature independent within experimental precision between 3 and 50 K. This means that the spin-lattice relaxation time flattens to a residual value that is given by non-magnetic impurities.
III.2 Relaxation in the superconducting state
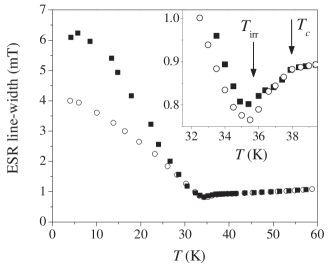
In type II superconductors, CESR arises from thermal excitations and from normal state vortex cores. The inhomogeneity of the magnetic field in the vortex lattice or glass states does not broaden the CESR line. The local magnetic field inhomogeneity is averaged since within the spin life-time itinerant electrons travel long distances compared to the inter-vortex distance Nemes et al. (2000). This is in contrast to the NMR case where the line-shape is affected: the nuclei are fixed to the crystal and nuclei inside and outside the vortex cores experience different local fields Pincus (1964). In other words, a superconducting a single crystal sample would display a narrow conduction electron ESR line if there were no irreversible effects. However, the CESR line is inhomogeneously broadened below the irreversibility line for a superconducting powder sample: the vortex distribution depends on a number of factors such as the thermal and magnetic field history, grain size and, for an anisotropic superconductor such as MgB2, on the crystal orientation with respect to the magnetic field also. The resulting inhomogeneous broadening of the CESR line gives , and cannot be measured from the line-width. In Fig. 3 we show this effect: above MgB2 has a relaxationally broadened line-width of mT. Between and the irreversibility temperature at the given field, , the CESR remains homogeneous and narrows with the lengthening of . However, below it broadens abruptly and the line-width depends on the direction of the magnetic field sweep: for up sweep it is broader than for down sweeps due to the irreversibility of vortex insertion and removal.
To enable a direct measurement of the spin lattice relaxation time, one has to resort to time resolved experiments. Conventional spin-echo ESR methods are limited to ’s larger than a few 100 ns. To measure ’s of a few nanoseconds, the so-called longitudinally detected ESR was invented in the 1960’s by Hervé and Pescia Hervé and Pescia (1960) and improved by several groups Atsarkin et al. (1995); Granwehr et al. (2001). The method is based on the deep amplitude modulation of the microwave excitation with an angular frequency, . When the sample is irradiated with the amplitude modulated microwaves at ESR resonance, the component of the magnetization along the static magnetic field, , decays from the equilibrium value, , with a time constant . relaxes back to with a relaxation time when the microwaves are turned off. The oscillating is detected using a coil which is part of a resonant rf circuit. The phase sensitive detection of the oscillating voltage using lock-in detection allows the measurement of using Hervé and Pescia (1960); Murányi et al. (2004), where and are the amplitudes of the in- and out-of-phase components of the oscillating magnetization after corrections for instrument related phase shifts. The principal limitation of the LOD-ESR technique is its 3-4 orders of magnitude lower sensitivity compared to conventional cw-ESR. The LOD-ESR method and the experimental apparatus are detailed in Refs. Murányi et al. (2004); Simon and Murányi (2005).
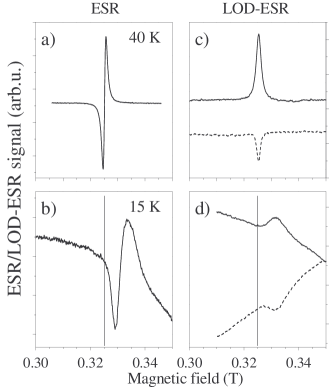
To prove that the LOD-ESR signal of the itinerant electrons is detected in the superconducting phase, we compare in Fig. 4 the LOD-ESR signal with that measured with conventional continuous-wave CESR (referred to as CESR in the following) of MgB2 in the normal and superconducting states. The CESR signal is the derivative of the absorption due to magnetic field modulation used for lock-in detection. This signal was previously identified as the ESR of conduction electrons in MgB2 in the superconducting and normal states Simon et al. (2001); Urbano et al. (2002); Simon et al. (2005) and its characteristics have been discussed in detail Simon et al. (2001, 2005). Above at 40 K, the CESR line is relaxationally broadened. Below , it is inhomogeneously broadened and is diamagnetically shifted, i.e. to higher resonance fields. The irreversible effects also contribute to a non-linear baseline known as the non-resonant microwave absorption Blazey et al. (1987). The intensity of the CESR signal decreases below as we discussed previously Simon et al. (2005), due to the vanishing of normal state electrons.
The LOD-ESR signal shows the same characteristics as the CESR below : it is broadened, shifted to higher fields and its intensity decreases. The values for the temperature dependent diamagnetic shifts and broadening and the relative intensity change agree for the two kinds of measurements within experimental precision (not shown). This unambiguously proves that the LOD-ESR signal originates from the conduction electrons.
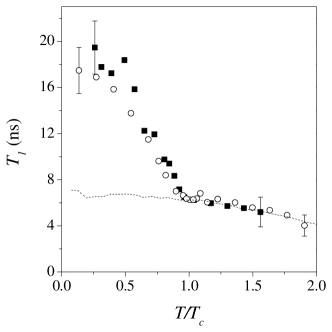
The change of the relaxation time is visible in the LOD-ESR spectra in Fig. 4 as a change in the relative intensities of the in- and out-of-phase signals. At 40 K and at 15 K , which together with gives 6.3 and 13.3 ns relaxation times, respectively. In Fig. 5, we show the data inferred from the LOD-ESR spectra at 0.32 and 1.27 T as a function of the reduced temperature .
IV Discussion
The observed lengthening of below ( Fig. 5) is expected from theory for non-magnetic scattering centers and low magnetic fields where the susceptibility is dominated by excitations over the superconducting gap. On the other hand, the field independence between 0.32 and 1.27 T of below is surprising. The lengthening of below in zero magnetic field for an isotropic, type I superconductor was calculated in the framework of weak-coupled BCS theory by Yafet Yafet (1983). He concluded that lengthens as a result of the freezing of normal state excitations. However, no theory exists for a type II superconductor in finite fields with anistotropy such as MgB2, thus here the data are analyzed phenomenologically in the framework of the two-band/gap model of MgB2.
In the following, we deduce the residual (low temperature), impurity related spin scattering contributions of the and Fermi surface sheets. The DOS is distributed almost equally on the FS sheets of MgB2: Choi et al. (2002), where and are the DOS of the two types of FS sheets. A magnetic field of T closes the gap on the FS sheets but leaves the gap on the sheet almost intact. Bouquet et al. (2002); Simon et al. (2005). This suggests that well below , our experiment at 0.32 T measures exclusively the relaxation of electrons on the fully closed FS sheets. Since at 0.32 T increases slowly with temperature between 10 and 20 K, we extrapolate ns for the FS.
In order to separate the contribution of the FS to the relaxation rate in the normal state, , we assume that inter-band relaxation is negligible and is equal to the average of the spin-lattice relaxation rates on the two FS’s weighted by the corresponding DOS:
| (1) |
Here is the spin-lattice relaxation time on the FS. The 15 T measurement shows that changes little with temperature between 3 K and 40 K. Thus we find ns for the contribution of the FS sheets using ns, ns and Eq. 1.
For normal metals with a simple Fermi surface, the so-called Elliott relation Elliott (1954); Yafet (1983, 1963); Beuneu and Monod (1977) holds, which states that for a given type of disorder (e.g. phonons or dislocations) is proportional to the momentum relaxation time, . The proportionality constant depends on the spin orbit splitting of the conduction electron bands and has been estimated in a number of metals from the shift of the CESR from the free electron value. Metals with complicated Fermi surfaces i.e. with great variations of the electron-phonon coupling on the different FS parts are known to deviate from the Elliott relation Monod and Beuneu (1979) and calculation of requires to take into account the details of the band-structure Silsbee and Beuneu (1983); Fabian and Das Sarma (1998, 1999). Examples include polyvalent elemental metals such as Mg or Al. Clearly, a calculation of is required for MgB2, which takes into account its band structure peculiarities. Comparison of spin scattering and momentum scattering times of the two types of Fermi surfaces is instructive. The relative values of for the two FS parts, and , and for interband scattering were estimated by Mazin et al. Mazin et al. (2002). A very small impurity interband scattering and , i.e. a larger intraband scattering relative to intraband scattering was required to explain the rather small depression of Tc in materials with widely different conductivities. De Haas-van Alphen Yelland et al. (2002) and magnetoresistance Pallecchi et al. (2005) measurements of high purity samples yield also. Such a behaviour could rise from Mg vacancies, which perturb more electrons of the band relative to the band. However, our spin scattering data do not support this. In contrast to momentum scattering, spin scattering is stronger on the FS: in high purity samples and low temperatures. The relative values of and for the two FS do not necessarily follow the same trend, spin relaxation times at low temperatures depend on spin orbit relaxation on impurities while momentum relaxation is due to potential scattering. However, a defect center such as a Mg vacancy with a strong modification of the electron-phonon coupling and an atomic number strongly differing from that of the regular atoms constituting the compound would greatly affect compared to . In the two gap model Mg defects are expected to shorten more than and thus are unlikely to be the dominant scatterers.
A final note concerns the validity of the above analysis of ’s in the framework of the two-band/gap model. The field independence of the lowest temperature for 0.32 and 1.27 T is unexpected within this model. The spin susceptibility increases strongly between these fields and more normal states are restored at 1.27 T than expected from the closing of the gap on the FS sheets alone Simon et al. (2005). Based on this, one would expect to observe additional spin scattering from the restored FS parts, which is clearly not the case. This also indicates that a theoretical study, which takes into account the peculiarities of MgB2 is required to explain the anomalous spin-lattice relaxation times.
In conclusion, we presented the measurement of the spin-lattice relaxation time, , of conduction electrons as a function of temperature and magnetic field in the MgB2 superconductor. We use a novel method based on the detection of the component of the conduction electron magnetization during electron spin resonance conditions with amplitude modulated microwave excitation. Lengthening of below is observed irrespective of the significant CESR line broadening due to irreversible diamagnetism in the polycrystalline sample. The field independence of for 0.32 T and 1.27 T allows to measure the separate contributions to from the two distinct types of the Fermi surface.
V Acknowledgements
The authors are grateful to Richárd Gaál for the development of the ESR instrument at the EPFL. F.S. and F.M. acknowledge the Zoltán Magyary postdoctoral programme, the Bolyai fellowship of the Hungarian Academy of Sciences and the Alexander von Humboldt Foundation for support, respectively. Work supported by the Hungarian State Grants (OTKA) No. TS049881, F61733, PF63954 and NK60984 and by the Swiss NSF and its NCCR ”MaNEP”. Ames Laboratory is operated for the U.S. Department of Energy by Iowa State University under Contract No. W-7405-Eng-82.
∗ Corresponding author: simon@esr.phy.bme.hu
† Present address: Leibniz Institute for Solid State and Materials Research Dresden, PF 270116 D-01171 Dresden, Germany
‡ Present address: Condensed Matter Physics and Materials Science Department, Brookhaven National Laboratory, Upton, New York 11973-5000, USA
References
- Žutić et al. (2004) I. Žutić, J. Fabian, and S. D. Sarma, Rev. Mod. Phys. 76, 323 (2004).
- Elliott (1954) R. J. Elliott, Physical Review 96, 266 279 (1954).
- Yafet (1983) Y. Yafet, Phys. Lett. A 98, 287 (1983).
- Nemes et al. (2000) N. M. Nemes, J. E. Fischer, G. Baumgartner, L. Forró, T. Fehér, G. Oszlányi, F. Simon, and A. Jánossy, Phys. Rev. B 61, 7118 (2000).
- Murányi et al. (2004) F. Murányi, F. Simon, F. Fülöp, and A. Jánossy, J. Magn. Res. 167, 221 (2004).
- Simon and Murányi (2005) F. Simon and F. Murányi, J. Magn. Res. 173, 288 (2005).
- Nagamatsu et al. (2001) J. Nagamatsu, N. Nakagawa, T. Muranaka, Y. Zenitani, and J. Akimitsu, Nature 410, 63 (2001).
- Bouquet et al. (2001) F. Bouquet, R. A. Fisher, N. E. Phillips, D. G. Hinks, and J. D. Jorgensen, Physical Review Letters 87, 047001 (2001).
- Szabó et al. (2001) P. Szabó, P. Samuely, J. Kacmarcík, T. Klein, J. Marcus, D. Fruchart, S. Miraglia, C. Marcenat, and A. G. M. Jansen, Phys. Rev. Lett. 87, 137005 (2001).
- Bouquet et al. (2002) F. Bouquet, Y. Wang, I. Sheikin, T. Plackowski, A. Junod, S. Lee, and S. Tajima, Physical Review Letters 89, 257001 (2002).
- Tsuda et al. (2003) S. Tsuda, T. Yokoya, Y. Takano, H. Kito, A. Matsushita, F. Yin, J. Itoh, H. Harima, and S. Shin, Physical Review Letters 91, 127001 (2003).
- Kortus et al. (2001) J. Kortus, I. I. Mazin, K. D. Belashchenko, V. P. Antropov, and L. L. Boyer, Phys. Rev. Lett. 86, 4656 (2001).
- Choi et al. (2002) H. J. Choi, D. Roundy, H. Sun, M. L. Cohen, and S. G. Louie, Nature 418, 758 (2002).
- Eskildsen et al. (2002) M. R. Eskildsen, M. Kugler, S. Tanaka, J. Jun, S. M. Kazakov, J. Karpinski, and R. Fischer, Phys. Rev. Lett. 89, 187003 (2002).
- Simon et al. (2001) F. Simon, A. Jánossy, T. Fehér, F. Murányi, S. Garaj, L. Forró, C. Petrovic, S. L. Bud’ko, G. Lapertot, V. Kogan, et al., Phys. Rev. Lett. 87, 047002 (2001).
- Angst et al. (2002) M. Angst, R. Puzniak, A. Wisniewski, J. Jun, S. M. Kazakov, J. Karpinski, J. Roos, and H. Keller, Phys. Rev. Lett. 88, 167004 (2002).
- Simon et al. (2005) F. Simon, A. Jánossy, T. Fehér, F. Murányi, S. Garaj, L. Forró, C. Petrovic, S. L. Bud’ko, R. A. Ribeiro, and P. C. Canfield, Phys. Rev. B 72, 012511 (2005).
- Dyson (1955) F. J. Dyson, Physical Review 98, 349 (1955).
- Finnemore et al. (2001) D. K. Finnemore, J. E. Ostenson, S. L. Bud’ko, G. Lapertot, and P. C. Canfield, Phys. Rev. Lett. 86, 2420 (2001).
- Pincus (1964) P. Pincus, Phys. Lett. 13, 21 (1964).
- Hervé and Pescia (1960) J. Hervé and J. Pescia, C. R. Acad. Sci.(Paris) 251, 665 (1960).
- Atsarkin et al. (1995) V. A. Atsarkin, V. V. Demidov, and G. A. Vasneva, Physical Review B 52, 1290 (1995).
- Granwehr et al. (2001) J. Granwehr, J. Forrer, and A. Schweiger, J. Magn. Res. 151, 78 (2001).
- Urbano et al. (2002) R. R. Urbano, P. G. Pagliuso, C. Rettori, Y. Kopelevich, N. O. Moreno, and J. L. Sarrao, Phys. Rev. Lett. 89, 087602 (2002).
- Blazey et al. (1987) K. W. Blazey, K. A. Muller, J. G. Bednorz, W. Berlinger, G. Amoretti, E. Buluggiu, A. Vera, and F. C. Matacotta, Phys. Rev. B 36, 7241 (1987).
- Yafet (1963) Y. Yafet, in Solid State Physics, edited by F. Seitz and D. Turnbull (1963), vol. 14, p. 1.
- Beuneu and Monod (1977) F. Beuneu and P. Monod, Phys. Rev. B 18, 2422 (1977).
- Monod and Beuneu (1979) P. Monod and F. Beuneu, Phys. Rev. B 19, 911 (1979).
- Silsbee and Beuneu (1983) R. H. Silsbee and F. Beuneu, Phys. Rev. B 27, 2682 (1983).
- Fabian and Das Sarma (1998) J. Fabian and S. Das Sarma, Phys. Rev. Lett. 81, 5624 (1998).
- Fabian and Das Sarma (1999) J. Fabian and S. Das Sarma, Phys. Rev. Lett. 83, 1211 (1999).
- Mazin et al. (2002) I. I. Mazin, O. K. Andersen, O. Jepsen, O. V. Dolgov, J. Kortus, A. A. Golubov, A. B. Kuz menko, and D. van der Marel, Phys. Rev. Lett. 89, 107002 (2002).
- Yelland et al. (2002) E. A. Yelland, J. C. Cooper, A. Carrington, N. E. Hussey, P. J. Meeson, S. Lee, A. Yamammoto, and S. Tajima, Phys. Rev. Lett. 88, 217002 (2002).
- Pallecchi et al. (2005) I. Pallecchi, V. Ferrando, E. G. D’Agliano, D. Marre, M. Monni, M. Putti, C. Tarantini, F. Gatti, H. U. Aebersold, E. Lehmann, et al., Phys. Rev. B 72, 184512 (2005).