USco1606-1935: An Unusually Wide Low-Mass Triple System?
Abstract
We present photometric, astrometric, and spectroscopic observations of USco160611.9-193532 AB, a candidate ultrawide (1600 AU), low-mass (0.4 ) multiple system in the nearby OB association Upper Scorpius. We conclude that both components are young, comoving members of the association; we also present high-resolution observations which show that the primary is itself a close binary system. If the Aab and B components are gravitationally bound, the system would fall into the small class of young multiple systems which have unusually wide separations as compared to field systems of similar mass. However, we demonstrate that physical association can not be assumed purely on probabilistic grounds for any individual candidate system in this separation range. Analysis of the association’s two-point correlation function shows that there is a significant probability (25%) that at least one pair of low-mass association members will be separated in projection by 15″, so analysis of the wide binary population in Upper Sco will require a systematic search for all wide systems; the detection of another such pair would represent an excess at the 98% confidence level.
Subject headings:
stars:binaries:general; stars:low-mass,brown dwarfs;stars:pre-main sequence;stars:individual([PBB2002] USco160611.9-193532)1. Introduction
The frequency and properties of multiple star systems are important diagnostics for placing constraints on star formation processes. This has prompted numerous attempts to characterize the properties of nearby binary systems in the field. These surveys (e.g. Duquennoy & Mayor 1991; Fischer & Marcy 1992; Close et al. 2003; Bouy et al. 2003; Burgasser et al. 2003) have found that binary frequencies and properties are very strongly dependent on mass. Solar-mass stars have high binary frequencies (60%) and maximum separations of up to 104 AU. By contrast, M dwarfs have moderately high binary frequencies (30-40%) and few binary companions with separations of more than 500 AU, while brown dwarfs have low binary frequencies (15%) and few companions with separations 20 AU.
The mass-dependent decline in the maximum observed binary separation has been described by Reid et al. (2001) and Burgasser et al. (2003) with an empirical function which is exponential at high masses () and quadratic at low masses (). The mechanism that produces the mass dependence is currently unknown; N-body simulations show that the empirical limit is not a result of dynamical evolution in the field (e.g. Burgasser et al. 2003; Weinberg et al. 1987) since the rate of disruptive stellar encounters is far too low. This suggests that the limit must be set early in stellar lifetimes, either as a result of the binary formation process or during early dynamical evolution in relatively crowded natal environments. Surveys of nearby young stellar associations have identified several unusually wide systems (Chauvin et al. 2004; Caballero et al. 2006; ; Jayawardhana & Ivanov 2006; Luhman et al. 2006, 2007; Close et al. 2007), but not in sufficient numbers to study their properties in a statistically meaningful manner.
We have addressed this problem by using archival 2MASS data to systematically search for candidate wide binary systems among all of the known members of three nearby young associations (Upper Sco, Taurus-Auriga, and Chamaeleon-I; Kraus & Hillenbrand 2007). Our results broadly agree with the standard paradigm; there is a significant deficit of wide systems among very low-mass stars and brown dwarfs as compared to their more massive brethren. However, we did identify a small number of candidate wide systems. One of these candidates is [PBB2002] USco160611.9-193532 (hereafter USco1606-1935), a wide (10.87″; 1600 AU) pair of stars with similar fluxes and colors. The brighter member of the pair was spectroscopically confirmed by Preibisch et al. (2002) to be a young M5 star. The fainter member fell just below the flux limit of their survey.
In this paper, we describe our photometric, astrometric, and spectroscopic followup observations for USco1606-1935 and evaluate the probability that the system is an unusually wide, low-mass binary. In Section 2, we describe our observations and data analysis methods. In Section 3, we use these results to establish that both members of the pair are young and co-moving, and that the primary is itself a close binary. Finally, in Section 4 we address the possibility that the pair is not bound, but a chance alignment of young stars, by analyzing the clustering of pre-main-sequence stars in Upper Sco.
2. Observations and Data Analysis
Most binary surveys, including our discovery survey, identify companions based on their proximity to the primary star and argue for physical association based on the (usually very low) probability that an unbound star would have been observed in chance alignment. However, the probability of contamination is much higher for very wide systems like USco1606-1935, so we decided to pursue additional information in order to confirm its multiplicity and further characterize its system components. In this section, we describe our followup efforts: a search of publicly available databases to obtain additional photometry and astrometry, acquisition of intermediate-resolution spectra to measure the secondary spectral type and test for signatures of youth, and acquisition of high-resolution images to determine if either component is itself a tighter binary and to test for common proper motion.
2.1. Archival Data
We identified USco1606-1935 AB as a candidate binary system using archival data from 2MASS (Skrutskie et al. 2006). The binary components are bright and clearly resolved, so we were able to retrieve additional photometry and astrometry from several other wide-field imaging surveys. We collated results for the binary components themselves and for nearby field stars from 2MASS, the Deep Near Infrared Survey (DENIS; Epchtein et al. 1999), United States Naval Observatory B1.0 survey (USNO-B; Monet et al. 2003), and the SuperCOSMOS Sky Survey (SSS; Hambly et al. 2001). The DENIS and 2MASS source catalogues are based on wide-field imaging surveys conducted in the optical/NIR ( and , respectively) using infrared array detectors, while the USNO-B and SSS source catalogues are based on independent digitizations of photographic plates from the First Palomar Observatory Sky Survey and the ESO Southern-Sky Survey.
2.1.1 Photometry
After evaluating the data, we decided to base our analysis on the magnitudes measured by 2MASS and the photographic magnitude of USNO-B (hereafter denoted , following the nomenclature of the USNO-B catalog, to distinguish it from Cousins ). We chose these observations because their accuracy can be directly tested using the independent magnitudes measured by DENIS; this comparison shows that the fluxes are consistent within the uncertainties. We do not directly use the DENIS observations because they are not as deep as the other surveys. We adopted the photometric uncertainties suggested in each survey’s technical reference.
2.1.2 Astrometry
As we describe in Section 3.3, there appear to be large systematic differences in the astrometry reported by the USNO-B and SSS source catalogs. These surveys represent digitizations of the same photographic plates, so these systematic discrepancies suggest that at least one survey introduces systematic biases in the digitization and calibration process. Given the uncertainty in which measurements to trust, we have chosen to disregard all available photographic astrometry and only use results from 2MASS and DENIS.
Our discovery survey already measured 2MASS relative astrometry for each filter directly from the processed atlas images, so we have adopted those values. We extracted DENIS astrometry from the source catalog, which contains the average positions for all three filters. Both surveys quote astrometric uncertainties of 70-100 mas for stars in the brightness range of our targets, but that value includes a significant systematic term resulting from the transformation to an all-sky reference frame. We have conducted tests with standard binary systems of known separation which suggest that relative astrometry on angular scales of 1′ is accurate to 40 mas, so we adopt this value as the astrometric uncertainty for each survey.
2.2. Optical Spectroscopy
We obtained an intermediate-resolution spectrum of USco1606-1935 B with the Double Spectrograph (Oke & Gunn 1982) on the Hale 5m telescope at Palomar Observatory. The spectrum presented here was obtained with the red channel using a 316 l/mm grating and a 2.0″ slit, yielding a spectral resolution of 1250 over a wavelength range of 6400-8800 angstroms. Wavelength calibration was achieved by observing a standard lamp after the science target, and flux normalization was achieved by observation of the spectrophotometric standard star Feige 34 (Massey et al. 1988). The spectrum was processed using standard IRAF111IRAF is distributed by the National Optical Astronomy Observatories, which are operated by the Association of Universities for Research in Astronomy, Inc., under cooperative agreement with the National Science Foundation. tasks.
Our field and young spectral type standards were drawn from membership surveys of Upper Sco and Taurus by Slesnick et al. (2006a, 2006b) which used identical instrument settings for the spectroscopic confirmation of photometrically selected candidate members.
2.3. High-Resolution Imaging
We observed USco1606-1935 A and B on February 7, 2006 (JD=2453773) using laser guide star adaptive optics (LGSAO; Wizinowich et al. 2006) on the Keck-II telescope with NIRC2 (K. Matthews, in prep), a high spatial resolution near-infrared camera. The seeing was average to poor (1″) for most of the observing run, but the system delivered nearly diffraction-limited correction in (60 mas FWHM) during the period of these observations. The system performance was above average given the low elevation (34 degrees; 1.8 airmasses), most likely due to the proximity and brightness of the tip-tilt reference star (, ).
Images were obtained using the filter in both the narrow and wide camera modes. The pixel scales in these modes are 9.942 mas pix-1 (FOV=10.18″) and 39.686 mas pix-1 (FOV=40.64″). All wide-camera observations were centered on the close Aab binary. The A and B components were too wide to fit reasonably into a single narrow-camera exposure, so we took separate exposure sequences centered on each. We obtained four wide-camera exposures of the AB system, seven narrow-camera exposures of A, and four narrow-camera exposures of B; the total integration times for each image set are 80s, 175s, and 100s, respectively. Each set was produced with a 3-point box dither pattern that omitted the bottom-left position due to higher read-noise for the detector in that quadrant. Single exposures were also taken at the central position.
Our science targets are relatively bright, so all observations were taken in correlated double-sampling mode, for which the array read noise is 38 electrons/read. The read noise is the dominant noise term for identifying faint sources, yielding detection limits of for the wide camera observations, for the narrow-camera observations centered on component A, and for the narrow-camera observations centered on component B; the detection limits for B are slightly shallower due to the shorter total integration time. The data were flat-fielded and dark- and bias-subtracted using standard IRAF procedures. The images were distortion-corrected using new high-order distortion solutions (P. Cameron, in prep) that deliver a significant performance increase as compared to the solutions presented in the NIRC2 pre-ship manual222http://www2.keck.hawaii.edu/realpublic/inst/nirc2/; the typical residuals are 4 mas in wide camera mode and 0.6 mas in narrow camera mode. We adopt these systematic limits as the uncertainty in astrometry for bright objects; all faint objects (16-18) have larger uncertainties (10 mas) due to photon statistics.
We measured PSF-fitting photometry and astrometry for our sources using the IRAF package DAOPHOT (Stetson 1987), and specifically with the ALLSTAR routine. We analyzed each frame separately in order to estimate the uncertainty in individual measurements and to allow for the potential rejection of frames with inferior AO correction; our final results represent the mean value for all observations in a filter.
In the wide-camera observations, we produced a template PSF based on the B component and the field star F1 (see Section 3.1 and Figure 1), both of which appear to be single sources. In the narrow-camera observations centered on A or B, the science target was the only bright object detected in our observations, so there was not a separate source from which to adopt a template PSF. We could have adopted a template PSF from another set of observations, but the AO correction usually varies significantly between targets since it is very sensitive to the seeing, elevation, laser return, and tip-tilt separation and brightness. We found that no other target in our survey provided a good PSF match.
We addressed this issue for the Aab binary pair by developing a procedure to reconstruct the single-source PSF directly from the observations of the binary system. Our algorithm begins with a preliminary estimate of the single-source PSF, then iteratively fits both components of the binary system with the estimated PSF and uses the synthetic PSF to subtract the best-fit estimate of the secondary flux. This residual image (which is dominated by the primary flux distribution) is then used to fit an improved estimate of the single-source PSF.
DAOPHOT characterizes an empirical PSF in terms of an analytical function and a lookup table of residuals, so we first iterated the procedure using a purely analytical function until it converged, then added a lookup table to the estimated PSF and iterated until its contents also converged. Observations of single stars suggested that the penny2 function (a gaussian core with lorentzian wings) would provide the best analytic fit, so we chose it as our analytic function. Four iterations of the fitting process were required for the analytic function to converge and 3 iterations were required for the lookup table to converge. Our algorithm does not work for the B component because it appears to be single, so we adopted the average synthetic single-source PSF from analysis of the Aab system to perform PSF fitting and verify that it is single.
We calibrated our photometry using 2MASS magnitudes for the A and B components and the nearby field star F1 (Section 3). The 2MASS observations were conducted using the filter rather than , but the theoretical isochrones computed by Kim et al. (2005) for the and systems differ by 0.01 magnitudes for objects in this color range; this is much smaller than other uncertainties in the calibration. Carpenter (2001) found typical zero point shifts of 0.03 magnitudes between 2MASS and several standard bandpasses, all of which are more distinctly different from than , which also demonstrates that the zero point shift between and should be negligible.
The calibration process could introduce systematic uncertainties if any of the three calibration sources are variable, but based on the small deviation in the individual calibration offsets for each source (0.03 mag), variability does not appear to be a significant factor. We tested the calibration using DENIS magnitudes and found that the two methods agree to within 0.01 mag, albeit with a higher standard deviation (0.12 mag) for DENIS.
3. Results

| Name | RAaaCoordinates are derived from the 2MASS position for USco1606-1935 A and the relative separations we measure using LGSAO. The absolute uncertainty in the 2MASS position with respect to the International Coordinate Reference System (ICRS) is 0.1″. | DECaaCoordinates are derived from the 2MASS position for USco1606-1935 A and the relative separations we measure using LGSAO. The absolute uncertainty in the 2MASS position with respect to the International Coordinate Reference System (ICRS) is 0.1″. | bbPhotometric uncertainties are 0.03 mag for LGSAO and 2MASS photometry and 0.25 mag for USNO-B1.0 photometry. | bbPhotometric uncertainties are 0.03 mag for LGSAO and 2MASS photometry and 0.25 mag for USNO-B1.0 photometry. | bbPhotometric uncertainties are 0.03 mag for LGSAO and 2MASS photometry and 0.25 mag for USNO-B1.0 photometry. | bbPhotometric uncertainties are 0.03 mag for LGSAO and 2MASS photometry and 0.25 mag for USNO-B1.0 photometry. | bbPhotometric uncertainties are 0.03 mag for LGSAO and 2MASS photometry and 0.25 mag for USNO-B1.0 photometry. |
|---|---|---|---|---|---|---|---|
| A | 16 06 11.99 | -19 35 33.1 | 11.04 | 11.02 | 11.35 | 12.01 | 14.1 |
| Aa | - | - | 11.71 | - | - | - | - |
| Ab | - | - | 11.88 | - | - | - | - |
| B | 16 06 11.44 | -19 35 40.5 | 11.74 | 11.78 | 12.32 | 13.00 | 14.9 |
| F1 | 16 06 12.09 | -19 35 18.3 | 11.51 | 11.50 | 11.62 | 12.27 | 13.5 |
| F2 | 16 06 12.90 | -19 35 36.1 | 16.32 | - | - | - | 17.8 |
| F3 | 16 06 13.23 | -19 35 23.7 | 16.66 | - | - | - | 18.7 |
| F4 | 16 06 11.75 | -19 35 32.0 | 17.43 | - | - | - | - |
| F5 | 16 06 12.40 | -19 35 40.3 | 17.28 | - | - | - | - |
| F6 | 16 06 12.94 | -19 35 44.6 | 16.97 | - | - | - | - |
Note. — Photometry is drawn from our observations (), 2MASS (), and the USNO-B1.0 catalogue ().
| LGSAO | 2MASS | 2MASS | 2MASS | DENIS | ||||||
|---|---|---|---|---|---|---|---|---|---|---|
| (JD=2453773) | (JD=2451297) | (JD=2451297) | (JD=2451297) | (JD=2451332) | ||||||
| Aa | -0.0132 | -0.0149 | - | - | - | - | - | - | - | - |
| Ab | +0.0201 | +0.0266 | - | - | - | - | - | - | - | - |
| B | -7.825 | -7.460 | -7.757 | -7.455 | -7.749 | -7.395 | -7.834 | -7.382 | -7.865 | -7.448 |
| F1 | +1.453 | +14.844 | +1.401 | +14.762 | +1.446 | +14.732 | +1.479 | +14.735 | +1.418 | +14.728 |
| F2 | +12.839 | -3.017 | - | - | - | - | - | - | -aaF2 was marginally detected in by DENIS, but the astrometry is not sufficiently precise to be useful in calculating its proper motion. | -aaF2 was marginally detected in by DENIS, but the astrometry is not sufficiently precise to be useful in calculating its proper motion. |
| F3 | +17.571 | +9.370 | - | - | - | - | - | - | - | - |
| F4 | -3.438 | +1.056 | - | - | - | - | - | - | - | - |
| F5 | +5.805 | -7.224 | - | - | - | - | - | - | - | - |
| F6 | +13.385 | -11.540 | - | - | - | - | - | - | - | - |
Note. — The zero-point for all coordinate offsets is the photocenter of the unresolved Aab system. The relative astrometric uncertainties for 2MASS and DENIS results are 40 mas; uncertainties for the LGSAO results are 5 mas for bright objects and 10 mas for faint objects.
3.1. Images
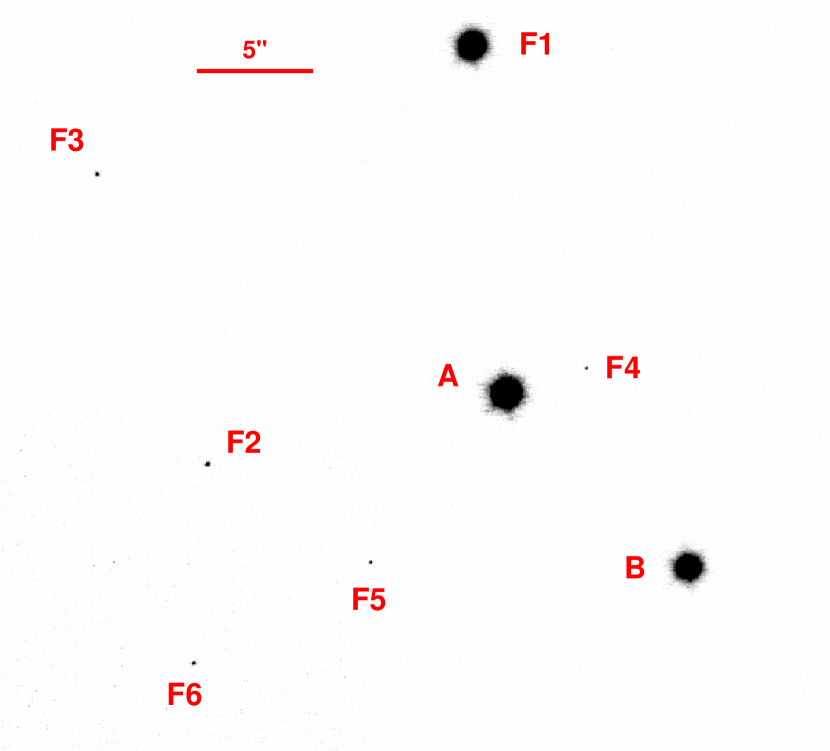
In Figure 1, we show a NIRC2 wide-camera image of the field surrounding USco1606-1935. The A and B components are labeled, as are 6 apparent field stars (named F1 through F6) which we use as astrometric comparison stars. We found counterparts for the first three field stars in existing survey catalogues: F1 was detected by all four sky surveys, F2 was detected by DENIS, USNO-B, and SSS, and F3 was detected only by USNO-B and SSS.
In Figure 2, we show individual contour plots drawn from NIRC2 narrow-camera images of the A and B components. These high-resolution images show that USco1606-1935 A is itself composed of two sources; we designate these two components Aa and Ab. We do not possess any direct diagnostic information to determine if Aa and Ab are physically associated, but there are only two other bright sources in the field of view. If the source count is representative of the surface density of bright () sources along the line of sight, the probability of finding an unbound bright source within 100 mas of the A component is only . Thus, we consider Aa and Ab to comprise a physically bound binary system.
3.2. Photometry
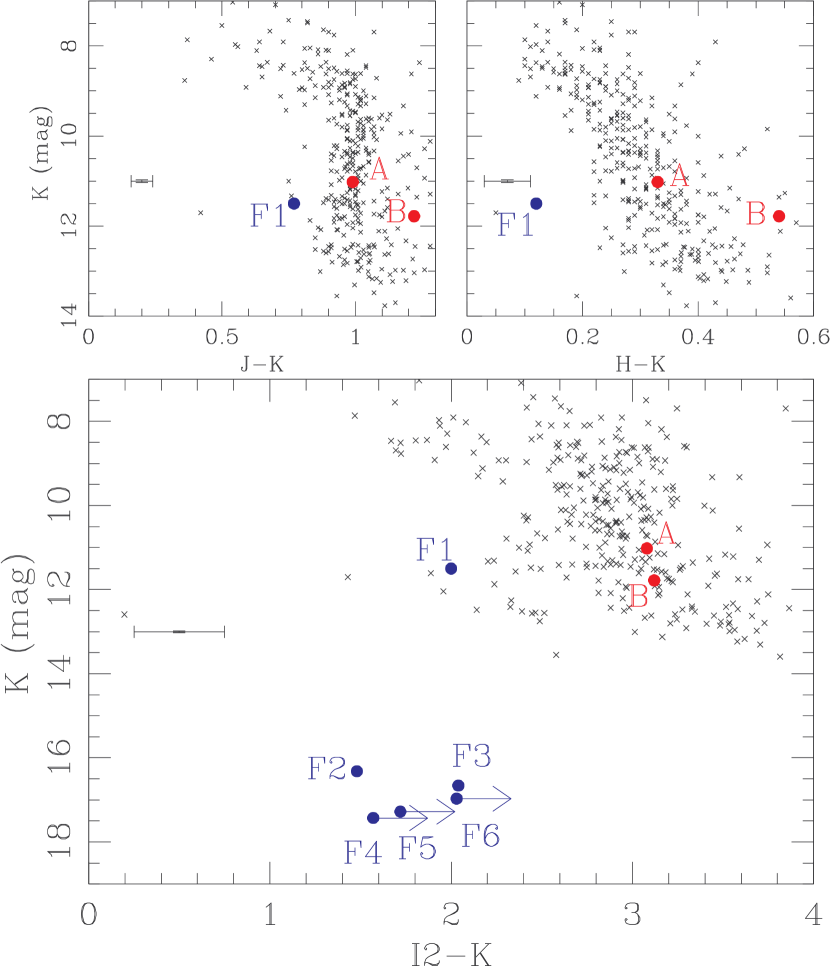
Photometric data are generally sufficient to reject most nonmember interlopers because association members follow a bright, well-defined cluster sequence in color-magnitude diagrams and most field stars will fall below or bluer than the association sequence. In Table 2, we summarize the observed and archival photometry for each source in the NIRC2 wide-camera images. In Figure 3, we show three color-magnitude diagrams ( versus , , and ) for our observed sources and for all spectroscopically-confirmed members of Upper Sco (as summarized in Kraus & Hillenbrand 2007).
The colors and magnitudes for USco1606-1935 B are consistent with the known members of Upper Sco, which supports the assertion that it is an association member. B is located marginally above and redward of the mean cluster sequence in the (,) and (,) diagrams; if this result is genuine and not a consequence of the photometric uncertainties, it could be a consequence of differential reddening, a band excess associated with a hot disk, or the presence of an unresolved tight binary companion. However, B does not appear to be as red in DENIS data (), which suggests that the 2MASS result may not be genuine.
The three sources for which we have colors (F1, F2, and F3) all sit below the Upper Sco member sequence in the (,) color-magnitude diagram. Some USco members also fall marginally blueward of the association sequence in (,); we can find no correlation with location, multiplicity, or other systematic factors, so this feature may be a result of intrinsic variability between the epochs of and . This result suggests that the (,) CMD is not sufficient for ruling out the membership of F1. However, F1 also sits at the extreme blueward edge of the association sequence in (,) and is clearly distinct from the association sequence in (,). We therefore judge that all three sources are unassociated field star interlopers.
We do not possess sufficient information to determine whether these three stars are field dwarfs in the Milky Way disk or background giants in the Milky Way bulge; the unknown nature of these sources could complicate future efforts to calculate absolute proper motions because comparison to nonmoving background giants is the best way to establish a nonmoving astrometric frame of reference. As we will show in Section 3.3, F1 possesses a small total proper motion (10 mas yr-1), so it may be a distant background star. Its 2MASS colors (, ) place it on the giant sequence in a color-color diagram, but reddened early-type stars with spectral type M0 can also reproduce these colors.
We are unable to measure colors for the stars F4, F5, and F6 because they were detected only in our LGSAO observations. However, visual inspection of the digitized POSS plates via Aladdin (Bonnarel et al. 2000) found possible band counterparts to F4 and F6 that were not identified by USNO-B. If these detections are genuine and these two sources fall near the USNO-B survey limit (), their colors ( or ) are too blue to be consistent with association membership.
3.3. Astrometry
The standard method for confirming physical association of candidate binary companions is to test for common proper motion. This test is not as useful for young stars in associations because other (gravitationally unbound) association members have similar proper motions to within 2-3 mas yr-1. However, proper motion analysis can still be used to eliminate nearby late-type field stars and background giants that coincidentally fall along the association color-magnitude sequence but possess distinct kinematics.
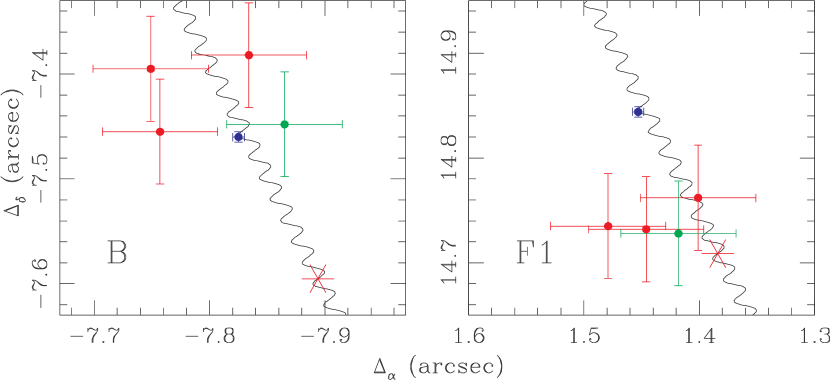
In Table 2, we summarize the relative astrometry for the three system components and for the field stars F1-F6 as measured with our LGSAO observations and archival data from 2MASS and DENIS. All offsets are given with respect to the photocenter of the unresolved Aab system; Aa and Ab have similar fluxes and do not appear to be variable in any of these measurements (Section 2.3), so this zero point should be consistent between different epochs. We evaluated the possibility of including astrometric data from older photographic surveys like USNO-B and SSS, but rejected this idea after finding that the two surveys reported very large (up to 1″) differences in the separation of the A-B system from digitization of the same photographic plates. We calculated relative proper motions in each dimension by averaging the four first-epoch values (2MASS and DENIS; Table 2), then comparing the result to our second-epoch observation obtained with LGSAO. We did not attempt a least-squares fit because the 2MASS values are coeval and the DENIS results were measured only 35 days after the 2MASS results.
In Figure 4, we plot the relative astrometry between A and B and between A and F1 as measured by 2MASS, DENIS, and our LGSAO survey. We also show the expected relative motion curve if B or F1 are nonmoving background stars and A moves with the mean proper motion and parallax of Upper Sco, (,)=(-9.3,-20.2) mas yr-1 and =7 mas (de Zeeuw et al. 1999; Kraus & Hillenbrand 2007). The total relative motion of B over the 6.8 year observation interval is (+2425,-4025) mas; the corresponding relative proper motion is (+3.53.7,-5.93.7) mas yr-1, which is consistent with comovement to within 2. This result is inconsistent with the hypothesis that B is a nonmoving background star at the level.
The relative motion of F1 is (+1725,+10525) mas or (+2.53.7,+15.43.7) mas yr-1, which is inconsistent with comovement at the 4 level. The absolute proper motion of F1, assuming A moves with the mean proper motion of Upper Sco, is (-74,-54) mas yr-1, which is consistent with nonmovement to within 2. The implication is that F1 is probably a distant background star, either a giant or a reddened early-type star.
3.4. Spectroscopy
The least ambiguous method for identifying young stars is to observe spectroscopic signatures of youth like lithium or various gravity-sensitive features. Spectroscopic confirmation is not strictly necessary in the case of USco1606-1935 since we confirmed common proper motion for the A-B system, but a spectral type is also useful in constraining the physical properties of the secondary, so we decided to obtain an optical spectrum.
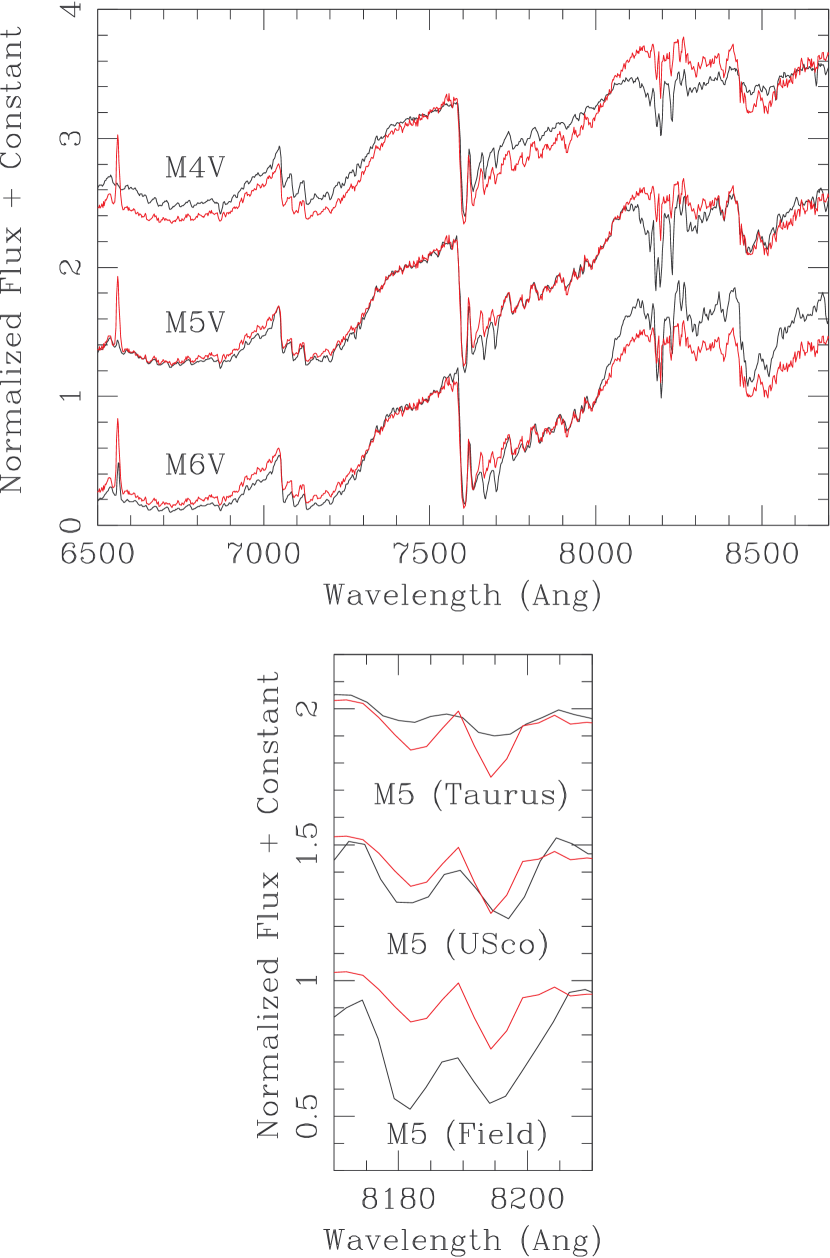
In the top panel of Figure 5, we plot our spectrum for B in comparison to three standard field dwarfs with spectral types of M4V-M6V. We qualitatively find that the standard star which produces the best fit is GJ 866 (M5V). The M4V and M6V standards do not adequately fit either the overall continuum shape or the depths of the TiO features at 8000 and 8500 angstroms, so the corresponding uncertainty in the spectral type is 0.5 subclasses.
In the bottom panel of Figure 5, we plot a restricted range of the spectrum (8170-8210 angstroms) centered on the Na-8189 absorption doublet. The depth of the doublet is sensitive to surface gravity (e.g. Slesnick et al. 2006a, 2006b); high-gravity dwarfs possess very deep absorption lines, while low-gravity giants show almost no absorption. We also plot standard stars of identical spectral type (M5) spanning a range of ages. The depth of the B component’s Na 8189 doublet appears to be consistent with the depth for a member of USco (5 Myr), deeper than that of a Taurus member (1-2 Myr), and shallower than that of a field star, which confirms that the B component is a pre-main sequence member of Upper Sco.
We have quantified our analysis by calculating the spectral indices TiO-7140, TiO-8465, and Na-8189, which measure the depth of key temperature- and gravity-sensitive features (Slesnick et al. 2006a). We find that , , and ; all three indices are consistent with our assessment that B is a young M5 star which has not yet contracted to the zero-age main sequence.
3.5. Stellar and Binary Properties
| Property | Aa-Ab | A-B |
|---|---|---|
| Measured | ||
| Sep (mas) | 53.21.0 | 108745 |
| PA (deg) | 38.71.0 | 226.450.03 |
| (mag) | 0.170.05 | 0.700.05 |
| (AU) | 7.71.2 | 1600200 |
| Inferred | ||
| 0.880.05 | 0.530.08 | |
| M50.5 | M5+M5.2(0.5) | |
| M5.20.5 | M50.5 | |
| 0.140.02 | 0.260.04 | |
| 0.120.02 | 0.140.02 |
Note. — The center of mass for the Aa-Ab pair is unknown, so we calculate all A-B separations with respect to the band photocenter.
In Table 3, we list the inferred stellar and binary properties for the Aa-Ab and A-B systems, which we estimate using the methods described in Kraus & Hillenbrand (2007). This procedure calculates component masses by combining the 5 Myr isochrone of Baraffe et al. (1998) and the M dwarf temperature scale of Luhman et al. (2003) to directly convert observed spectral types to masses. Relative properties (mass ratios and relative spectral types) are calculated by combining the Baraffe isochrones and Luhman temperature scale with the empirical NIR colors of Bessell & Brett (1998) and the K-band bolometric corrections of Leggett et al. (1998) to estimate and from the observed flux ratio .
We have adopted the previously-measured spectral type for A (M5; Preibisch et al. 2002) as the type for component Aa, but the inferred spectral type for Ab is only 0.2 subclasses later, so this assumption should be robust to within the uncertainties (0.5 subclasses). The projected spatial separations are calculated for the mean distance of Upper Sco, 1452 pc (de Zeeuw et al. 1999). If the total radial depth of Upper Sco is equal to its angular extent (15o or 40 pc), then the unknown depth of USco1606-1935 within Upper Sco implies an uncertainty in the projected spatial separation of 15%. The systematic uncertainty due to the uncertainty in the mean distance of Upper Sco is negligible (2%).
4. Is USco1606-1935 AB a Binary System?
The unambiguous identification of pre-main sequence binaries is complicated by the difficulty of distinguishing gravitationally bound binary pairs from coeval, comoving association members which are aligned in projection. Most traditional methods used to confirm field binary companions do not work in the case of young binaries in clusters and associations because all association members share common distances and kinematics (to within current observational uncertainties), so the only remaining option is to assess the probability of chance alignment. We address this challenge by quantifying the clustering of PMS stars via calculation of the two-point correlation function (TPCF) across a wide range of angular scales (1″ to 1 degree). This type of analysis has been attempted in the past (e.g. Gomez et al. 1993 for Taurus; Simon 1997 for Ophiuchus, Taurus, and the Trapezium), but these studies were conducted using samples that were significantly incomplete relative to today.
The TPCF, , is defined as the number of excess pairs of objects with a given separation over the expected number for a random distribution (Peebles 1980). The TPCF is linearly proportional to the surface density of companions per star, , where is the survey area and is the total number of stars. However, it is often easier to evaluate the TPCF via a Monte Carlo-based definition, , where is the number of pairs in the survey area with separations in a bin centered on and is the expected number of pairs for a random distribution of objects over the same area (Hewett 1982). The advantage of this method is that it does not require edge corrections, unlike direct measurement of . We adopted this method due to its ease of implementation, but we report our subsequent results in terms of since it is a more intuitive quantity.
The current census of Upper Sco members across the full association is very incomplete, so we implemented our analysis for intermediate and large separations () using only members located in two heavily-studied fields originally observed by Preibisch et al. (2001, 2002; the 2df-East and 2df-West fields). The census of members in these fields may not be complete, but we expect that it is the least incomplete. The census of companions at smaller separations (1.5-6.4″) has been uniformly studied for all spectroscopically-confirmed members (Kraus & Hillenbrand 2007), so we have maximized the sample size in this separation range by considering the immediate area around all known members, not just those within the Preibisch fields. Our survey was only complete for mass ratios 0.25, so we do not include companions with mass ratios .
These choices might lead to systematic biases if the Preibisch fields are still significantly incomplete or if the frequency and properties of binary systems show intra-association variations, but any such incompleteness would probably change the result by no more than a factor of 2-3. As we will subsequently show, varies by 4 orders of magnitude across the full range of . The well-established mass dependence of multiplicity should not affect our results since the mass function for the Preibisch fields is similar to that seen for the rest of the association.
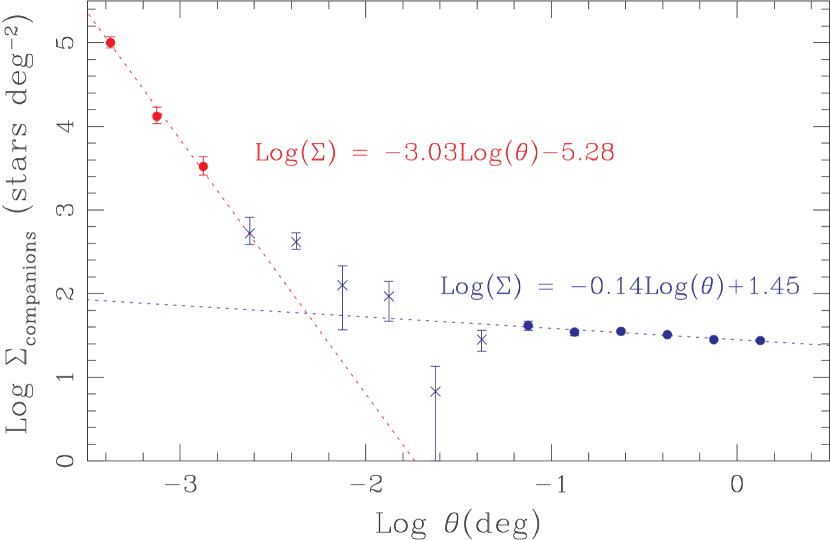
In Figure 6, we plot for Upper Sco, spanning the separation range (1.14″ to 1.78 deg ). We have fit this relation with two power laws, one which dominates at small separations (15-30″) and one at larger separations. We interpret the two segments, following Simon (1997), to be the result of gravitationally-bound binarity and gravitationally unbound intra-association clustering, respectively. We fit the binary power law to the three lowest-separation bins () because this is the separation range over which we possess uniform multiplicity data. The cluster power law was fit to the six highest-separation bins () because those bins have the smallest uncertainties. Bins corresponding to intermediate separations seem to follow the two power laws.
We found that the slope of the cluster power law (-0.140.02) is very close to zero, which implies that there is very little clustering on scales of 1 deg. This result is not unexpected for intermediate-age associations like Upper Sco; given the typical intra-association velocity dispersion (1 km s-1) and the age (5 Myr), most association members have dispersed 5 pc (2 deg) relative to their formation point, averaging out structure on smaller spatial scales. Simon (1997) found that the slopes for Taurus, Ophiuchus, and the ONC are steeper, suggesting that more structure is present on these small scales at young ages (1-2 Myr). The slope of the binary power law (-3.030.24) is much steeper than the cluster regime. The separation range represented is much larger than the peak of the binary separation distribution (30 AU for field solar-mass stars; Duquennoy & Mayor 1991), so the steep negative slope corresponds to the large-separation tail of the separation distribution function. The two power laws seem to cross at separations of 15-30″ ( AU), though this result depends on the sample completeness in the binary and cluster regimes. We interpret this to be the maximum separation range at which binaries can be identified.
If we extrapolate the cluster power law into the separation regime of the binary power law, we find that the expected surface density of unbound coincidentally-aligned companions is 60 deg-2. Given this surface density, there should be 1 chance alignment within 15″ among the 366 spectroscopically confirmed members of Upper Sco. Among the 173 known late-type stars and brown dwarfs (SpTM4) for which this separation range is unusually wide, the expected number of chance alignments with any other member is 0.5. If the mass function of known members is similar to the total mass function, approximately half (0.25 chance alignments) are expected to occur with another low-mass member. Therefore, we expect 0.25 chance alignments which might be mistaken for a low-mass binary pair.
The probability that one or more such chance alignments actually exists for a known low-mass USco member is 25% (based on Poisson statistics), which suggests that the nature of a single candidate wide pair like USco1606-1935 AB can not be unambiguously determined. If any more pairs can be confirmed, then they would represent a statistically significant excess. The corresponding probability of finding 2 chance alignments of low-mass members is only 2%. As we have described in our survey of wide multiplicity with 2MASS (Kraus & Hillenbrand 2007), we have identified at least three additional candidate ultrawide systems in Upper Sco, so spectroscopic and astrometric followup of these candidate systems is a high priority.
5. Summary
We have presented photometric, astrometric, and spectroscopic observations of USco1606-1935, a candidate ultrawide (1600 AU), low-mass (0.4 ) hierarchical triple system in the nearby OB association Upper Scorpius. We conclude that the ultrawide B component is a young, comoving member of the association, and show that the primary is itself a close binary system.
If the Aab and B components are gravitationally bound, the system would join the growing class of young multiple systems which have unusually wide separations as compared to field systems of similar mass. However, we demonstrate that binarity can not be assumed purely on probabilistic grounds. Analysis of the association’s two-point correlation function shows that there is a significant probability (25%) that at least one pair of low-mass association members will be separated by 15″, so analysis of the wide binary population requires a systematic search for all wide binaries. The detection of another pair of low-mass members within 15″ would represent an excess at the 98% confidence level. In principle, binarity could also be demonstrated by measuring common proper motion with precision higher than the internal velocity scatter of the association; given the astrometric precision currently attainable with LGSAO data (1 mas), the test could be feasible within 5 years.
References
- Baraffe et al. (1998) Baraffe, I., Chabrier, G., Allard, F., & Hauschildt, P. 1998, A&A, 337, 403
- Bessell & Brett (1988) Bessell, M. & Brett, J. 1988, PASP, 100, 1134
- Bonnarel et al. (2000) Bonnarel, F. et al. 2000, A&AS, 143, 33
- Bouy et al. (2003) Bouy, H., Brandner, W., Martin, E., Delfosse, X., Allard, F., & Basri, G. 2003, AJ, 126, 1526
- Burgasser et al. (2003) Burgasser, A. et al. 2003, ApJ, 125, 850
- Caballero et al. (2006) Caballero, J., Martin, E., Dobbie, P., & Barrado y Navascues, D. 2006, A&A, 460, 635
- Carpenter (2001) Carpenter, J. 2001, AJ, 121, 2851
- Chauvin et al. (2004) Chauvin, G., Lagrange, A., Dumas, C., Zuckerman, B., Mouillet, D., Song, I., Beuzit, J., & Lowrance, P. 2004, A&A, 425, 29
- Close et al. (2003) Close, L., Siegler, N., Freed, M., & Biller, B. 2003, ApJ, 587, 407
- Close et al. (2007) Close, L. et al. 2007, ApJ, in press
- de Zeeuw et al. (1999) de Zeeuw, P., Hoogerwerf, R., de Bruijne, J., Brown, A., & Blaauw, A. 1999, AJ, 117, 354
- Duquennoy & Mayor (1991) Duquennoy, A. & Mayor, M. 1991, A&A, 248, 485
- Epchtein et al. (1999) Epchtein, N. et al. 1999, A&A, 349, 236
- Fischer & Marcy (1992) Fischer, D. & Marcy, G. 1993, ApJ, 396, 178
- Gomez et al. (1993) Gomez, M., Hartmann, L., Kenyon, S., & Hewett, R. 1993, AJ, 105, 1927
- Hambly et al. (2001) Hambly, N. et al. 2001, MNRAS, 326, 1279
- Hewett (1981) Hewett, P. 1982, MNRAS, 201, 867
- Jayawardhana & Ivanov (2006) Jayawardhana, R. & Ivanov, V. 2006, Science, 313, 1279
- Kim et al. (2005) Kim, S., Figer, D., Lee, M., & Oh, S. 2005, PASP, 117, 445
- Kraus & Hillenbrand (2007) Kraus, A. & Hillenbrand, L. 2007, ApJ, in press (astro-ph/0702545)
- Leggett et al. (1998) Leggett, S., Allard, F., & Hauschildt, P. 1998, ApJ, 509, 836
- Luhman et al. (2003) Luhman, K., Stauffer, J., Muench, Al, Rieke, G., Lada, E., Bouvier, J., & Lada, C. 2003, ApJ, 593, 1093
- Luhman et al. (2006) Luhman, K., Whitney, B., Meade, M., Babler, B., Indebetouw, R., Bracker, S., & Churchwell, E. 2006, ApJ, 649, 1180
- Luhman et al. (2007) Luhman, K., Allers, K., Jaffe, D., Cushing, M., Williams, K., Slesnick, C., & Vacca, W. 2007, ApJ, in press
- Massey et al. (1988) Massey, P., Strobel, K., Barnes, J., & Anderson, E. 1988, ApJ, 328, 315
- Monet et al. (2003) Monet, D. et al. 2003, AJ, 125, 984
- Oke & Gunn (1982) Oke, B. & Gunn, J. 1982, PASP, 94, 586
- Peebles (1980) Peebles, J. 1980, The Large Scale Structure of the Universe (Princeton: Princeton Univ. Press)
- Preibisch et al. (2001) Preibisch, T., Guenther, E., & Zinnecker, H. 2001, AJ, 121, 1040
- Preibisch et al. (2002) Preibisch, T., Brown, A., Bridges, T., Guenther, E., & Zinnecker, H. 2002, AJ, 124, 404
- Reid & Gizis (1997) Reid, I. & Gizis, J. 1997, AJ, 113, 2246
- Reid et al. (2001) Reid, I., Gizis, J., Kirkpatrick, J., & Koerner, D. 2001, AJ, 121, 489
- Simon (1997) Simon, M. 1997, ApJ, 482, 81
- Skrutskie et al. (2006) Skrutskie, M. et al. 2006, AJ, 131, 1163
- Slesnick et al. (2006a) Slesnick, C., Carpenter, J., & Hillenbrand, L. 2006a, AJ, 131, 3016
- Slesnick et al. (2006b) Slesnick, C., Carpenter, J., Hillenbrand, L., & Mamajek, E. 2006b, AJ, 132, 2665
- Stetson (1987) Stetson, P. 1987, PASP, 99, 191
- Weinberg et al. (1987) Weinberg, M., Shapiro, S., & Wasserman, I. 1987, ApJ, 312, 367
- Wizinowich et al. (2006) Wizinowich, P. et al. 2006, PASP, 118, 297