Measurement of the Aerosol Phase Function at the Pierre Auger Observatory
Abstract
Air fluorescence detectors measure the energy of ultra-high energy cosmic rays by collecting fluorescence light emitted from nitrogen molecules along the extensive air shower cascade. To ensure a reliable energy determination, the light signal needs to be corrected for atmospheric effects, which not only attenuate the signal, but also produce a non-negligible background component due to scattered Cherenkov light and multiple-scattered light. The correction requires regular measurements of the aerosol attenuation length and the aerosol phase function, defined as the probability of light scattered in a given direction. At the Pierre Auger Observatory in Malargüe, Argentina, the phase function is measured on an hourly basis using two Aerosol Phase Function (APF) light sources. These sources direct a UV light beam across the field of view of the fluorescence detectors; the phase function can be extracted from the image of the shots in the fluorescence detector cameras. This paper describes the design, current status, standard operation procedure, and performance of the APF system at the Pierre Auger Observatory.
keywords:
Ultra-high energy cosmic rays; air fluorescence detectors; atmospheric monitoring; aerosol phase functionPACS:
42.68.-w , 42.68.Jg , 92.60.Mt , 92.60.Sz , 96.50.sd, , , , , and
1 Introduction
The Pierre Auger Observatory in Malargüe, Argentina, is designed to study the origin of ultra-high energy cosmic rays with energies above eV. While still under construction, scientific data taking began in 2004, and first results have been published [1, 2, 3].
The Pierre Auger Observatory is a hybrid detector that combines two techniques traditionally used to measure cosmic ray air showers: surface particle detection and air fluorescence detection. Both detector types measure the cosmic ray primary indirectly, using the Earth’s atmosphere as part of the detector medium. When the primary particle enters the atmosphere, it interacts with air molecules, initiating a cascade of secondary particles, the so-called extensive air shower. Surface detectors in the form of ground arrays sample the shower front as it impacts the ground, whereas air fluorescence detectors make use of the fact that the particles in the air shower excite nitrogen molecules in the air, causing UV fluorescence. Using photomultiplier cameras to record air shower UV emission, we can observe showers as they develop through the atmosphere and obtain a nearly calorimetric estimate of the shower energy.
Upon completion, the surface detector (SD) array of the Pierre Auger Observatory will comprise 1600 water Cherenkov detector tanks, deployed in a hexagonal grid over an area of , and four fluorescence detector (FD) stations overlooking the SD from the periphery. An advantage of combining both detector types at the same site is the possibility to cross-calibrate. Based on the subset of events seen with both detectors, the nearly calorimetric information of the FD provides the energy calibration of the SD.
For the calibration to be meaningful, the properties of the calorimeter, i.e. the atmosphere, must be well-known. At the Pierre Auger Observatory, this is achieved by an extensive program to monitor the atmosphere within the overall FD aperture and measure atmospheric attenuation and scattering properties in the 300 to 400 nm wavelength band recorded by the FDs [4, 5, 6].
Two primary forms of atmospheric light scattering need to be considered: molecular, or Rayleigh, scattering, mainly due to nitrogen and oxygen molecules; and aerosol scattering due to airborne particulates. The angular distribution of scattered light in both types of scattering may be described by a phase function , defined as the probability per unit solid angle of scattering through an angle .
Rayleigh scattering allows for an analytical treatment, and assuming isotropic scattering, the Rayleigh phase function has the well known angular dependence. Matters are more complicated for aerosols, because the scattering cross section depends on the size distribution and shape of the scatterers. Forward scattering typically dominates in this case, but the fraction of forward-scattered light varies strongly with aerosol type. Moreover, a rigorous analytical treatment is not possible, though the literature gives various approximations. For example, if one assumes spherical particles with a known or estimated size distribution, then aerosol scattering can be described analytically using Mie theory [7]. In practice, however, aerosols vary a great deal in size and shape, and the aerosol content of the atmosphere changes on short time scales as wind lifts up dust, weather fronts pass through, or rain removes dust from the atmosphere.
The FD reconstruction of the primary cosmic ray particle energy must account not only for light that is “lost” between the shower and the camera due to scattering, but also for direct and indirect Cherenkov light contributing to the FD signal. The amount of Cherenkov light seen by the FDs depends on the viewing angle, i.e. the angle between the shower axis and the FD line of sight, and can be calculated once the geometry of the air shower is determined. At small viewing angles, direct Cherenkov light dominates, while at viewing angles greater than , the FDs detect mainly “indirect” Cherenkov light scattered into the FD field of view. To calculate this scattered component, the aerosol phase function needs to be known. Finally, a small multiple scattering component also adds to the contamination of the fluorescence light and must be removed [8].
The Aerosol Phase Function (APF) light sources [9, 10], in conjunction with the fluorescence detectors at the Pierre Auger Observatory, are designed to measure the aerosol phase function on an hourly basis during FD data taking. The APF light sources direct a near-horizontal pulsed light beam across the field of view of a nearby FD. The aerosol phase function can then be reconstructed from the intensity of the light observed by the FD cameras as a function of scattering angle. Since the FD telescopes cover about in azimuth, the aerosol phase function is measured over a wide range of scattering angles.
Currently, APF light sources are installed and operating at two of the FDs. With their ability to measure the angular distribution of the scattered light, the APF light sources are meant to complement other atmospheric monitoring tools at the Auger site which measure the optical depth, and therefore the amount of attenuation due to aerosols.
This paper describes the design and performance of the APF light sources. It is structured as follows. Section 2 gives a description of the APF facilities. Section 3 describes how the aerosol phase function is determined from the APF data. In Section 4, we show first results for data taken between June and December 2006. Section 5 summarizes the paper.
2 APF Light Sources
2.1 Detector Buildings, Optics, and Electronics
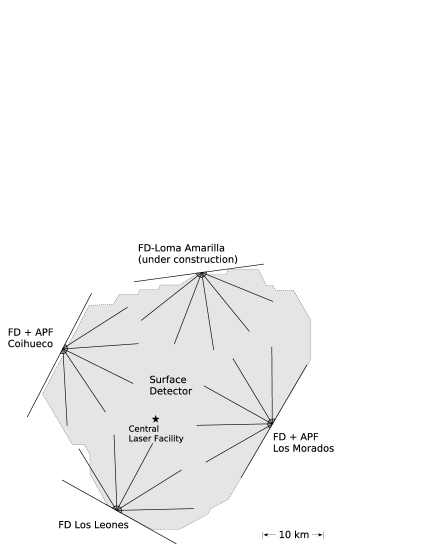
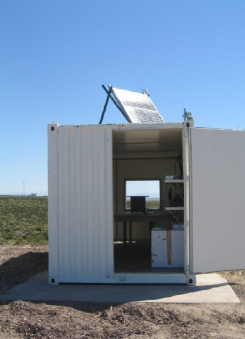
The Auger FD comprises four detector stations (see Fig. 1). At present, the sites at Los Leones, Coihueco, and Los Morados are completed and fully operational, while the fourth site at Loma Amarilla is under construction. APF light sources are operating at the Coihueco and Los Morados FD sites. Both were built by the University of New Mexico group [10]. Fig. 2 shows a photograph of the APF container building at Los Morados.
Each APF building contains sources which operate at different wavelengths in the region of interest between 300 nm and 400 nm. During the initial studies described in this paper, only one light source with a Johnson U-band filter of central wavelength 350 nm was used. However, in the near future, we plan to operate the light sources at several wavelengths to study the wavelength dependence of the phase function over the full range of the FD sensitivity.
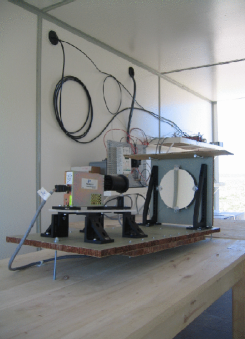
The light beam is provided by a broad-band Xenon flash lamp source from Perkin Elmer Optoelectronics (model LS-1130-4 FlashPac with FX-1160 flash lamp). The Xenon flash lamps were chosen because of their excellent stability in intensity and pulse shape. A Johnson/Cousins (Bessel) U-band filter from Omega Optical Inc. (part number XBSSL/U/50R) selects a central wavelength of nm, FWHM 60 nm) from the broad flash lamp spectrum. The beam is focused using a 20.3 cm diameter UV enhanced aluminum spherical mirror (speed f/3) from Edmund Scientific Co. (part number R43-589). All optical components are assembled on a commercial optical plate. We use Thor optical table parts, assembled from Nomex Epoxy/Fiberglass 1.91 cm panels from TEKLAM (part number N507EC).
The Xenon lamps rest inside refurbished 6.1 m shipping containers, and the light is sent through a 0.749 cm thick acrylite UV transmitting window (Cyro Industries acrylite OP-4 UVT acrylic). Each light source provides a nearly horizontal beam of divergence pulsed across the field of view of the nearby fluorescence detector. Computer control occurs from the corresponding FD building. A serial radio link (YDI Wireless, model 651-900001-001 (TranzPoint ESC-II Kit)) connects the computer to a commercial ADC/relay system (model ADC-16F 16 channel 8 bit ADC and RH-8L 8-relay card from Electronic Energy Control Inc.) at the light source.
Once during each hour of FD data taking, the ADC/relay system enables a 1 Hz GPS pulser (CNS Systems Inc., model CNSC01 with TAC32 software) and a 12 V to 24 V inverter to power the Xenon flash lamps. Each lamp fires a set of 5 shots, pulsed at 2 second intervals. The APF events are flagged by the FD data acquisition system and the corresponding FD data are stored on disk in especially designated APF data files.
When the light sources are not operating, only the radio link and the ADC board are powered. The total current draw is therefore only at 12 V, and the whole system can be powered by batteries recharged during the day with 12 V solar panels (two Siemens SP75 75 W solar modules with Trace C35 controller).
2.2 APF Signals in the Fluorescence Detectors
The light beam produced by the APF sources is observed by the cameras of the corresponding FD site. The FD detectors of the Pierre Auger Observatory are described in detail elsewhere [11]. Here, we only give a short summary of the main characteristics relevant for the analysis of APF shots.
Each Auger FD site contains six bays, and each bay encloses a UV telescope composed of a spherical light-collecting mirror, a photomultiplier camera at the focal surface, and a UV transmitting filter in the aperture. The mirrors have a radius of curvature of 3.4 m and an area of about . The camera consists of 440 photomultipliers with a hexagonal bialkaline photocathode, arranged in a array. Each camera has a field of view of in azimuth and in elevation, covering an elevation angle range from to above horizon. To reduce optical aberrations, including coma, the FD telescopes use Schmidt optics with a circular diaphragm of diameter 2.2 m placed at the center of curvature of the mirror, and a refractive corrector ring at the telescope aperture.
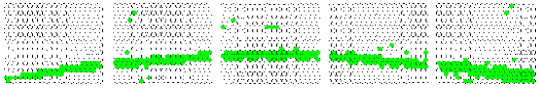
Fig. 4 shows an APF shot as seen by the Coihueco FD. Five out of the 6 bays of the Coihueco FD site observe light from the Coihueco APF facility. In this figure, the light travels from right to left. Fig. 4 shows the relative positions of the APF source and the FD at the Coihueco site. The geometry is in part dictated by the local topography, and consequently is slightly different for the Los Morados site.

3 Determination of the Aerosol Phase Function
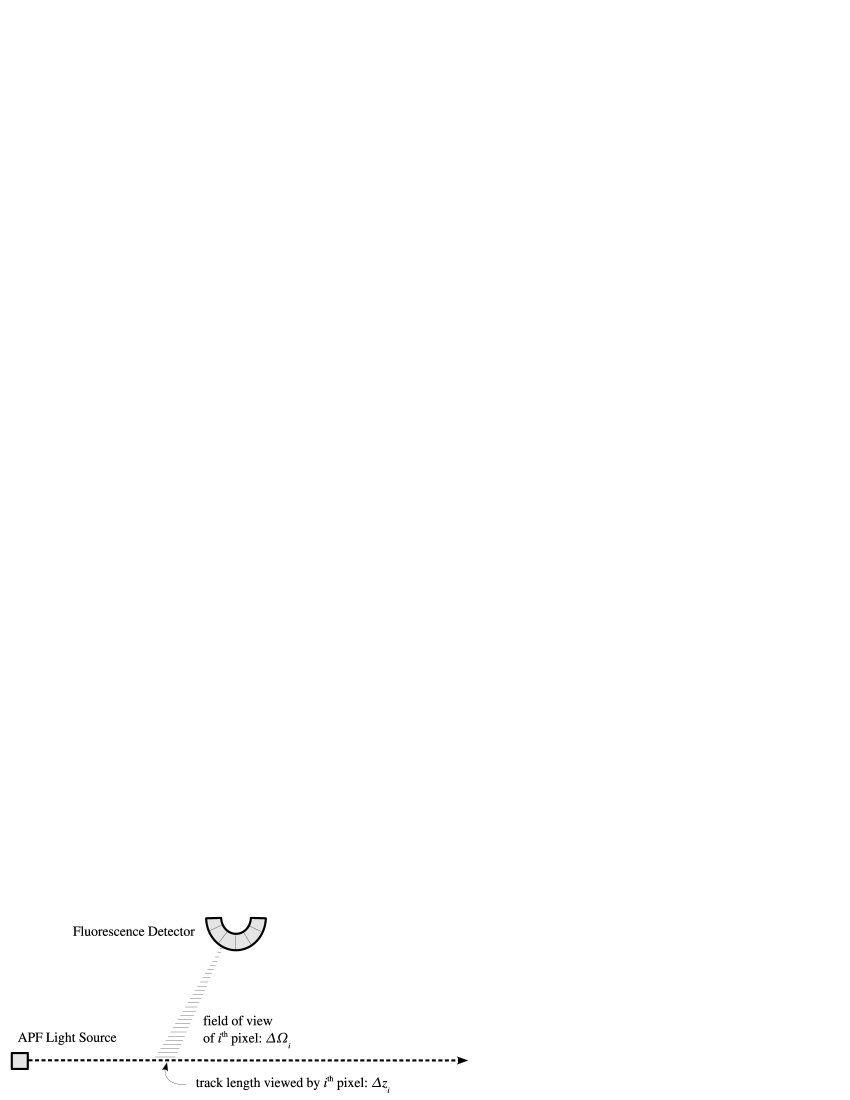
The signal from the APF light source observed by the pixel of a fluorescence detector can be expressed as
| (1) |
In this equation, is the light source intensity; is the transmission factor which accounts for light attenuation from the beam to the pixel; is the distance from the beam to the detector; , , and are the total, molecular, and aerosol extinction length, respectively; and and are the normalized differential molecular and aerosol scattering cross sections, respectively, which are identical to the phase functions and . The integral of and over all solid angles is equal to 1. Finally, , , and are the track length, detector solid angle, and the efficiency for the pixel of the detector.
The data come in the form of total PMT signal per pixel from a particular shot. Those data are binned as a function of azimuth and averaged between the five shots taken within 10 seconds. In this analysis, bins are used, although the fit is relatively insensitive to the number of bins. Each FD pixel is hexagonally shaped, so for those lying at the boundary of two azimuth bins, the fractional area of the hexagon in each bin is used to properly distribute the signal. The signal in each pixel is divided by , and to correct for the geometry of the beam and pixel calibration. Note that in the roughly cylindrical geometry of the FD-APF beam, the and corrections almost completely cancel out.
Typical values for the aerosol extinction length in dry atmospheres are between 10 km and 20 km, reaching 40 km for very clear conditions. Since the perpendicular distance from the beam to the FD is only on the order of a few hundred meters, it is reasonable to assume full atmospheric transmission over the length of the beam. In reality, this assumption does not hold well for the most distant beam points, so these points are not used in the present study. In the near future, measurements of the extinction length from the Auger lidar stations [5] will be used to improve the APF analysis. In another approximation, we assume that the extinction lengths are identical for each pixel for single measurements and do not require an index . In principle, the extinction length depends on the number density of scatterers and is therefore a function of the density (temperature, pressure) of the air.
Given corrections for geometry, attenuation, and pixel efficiency, Eq. 1 reduces to
| (2) |
where is a constant whose value is unimportant because arbitrary units are sufficient in determining the phase function.
From the theory of Rayleigh scattering it is known that the Rayleigh phase function is
| (3) |
where accounts for the effect of molecular anisotropy on Rayleigh scattering. For isotropic scattering, , this reduces to the familiar
| (4) |
The effect of the anisotropy is small and wavelength-dependent. Bucholtz [12] estimates at 360 nm and concludes that the correction leads to a systematic increase in the Rayleigh scattering cross section, and a fractional change from the approximate . In our analysis, only the shape of the function is relevant, and we use Eq. 4 as an approximation of Eq. 3.
The aerosol phase function is often parameterized by the Henyey-Greenstein function [13]:
| (5) |
where and is an asymmetry parameter equal to the mean cosine of the scattering angle: . The parameter is a measure of how much light is scattered in the forward direction; a greater means more light is forward-scattered. Values for range from (total forward scattering) to (total backward scattering), with indicating isotropic scattering.
The Henyey-Greenstein function works well for pure forward scattering, but it cannot describe realistic aerosol conditions, which typically give rise to non-negligible backscattering. Following [14, 15], we modify Eq. 5 so that
| (6) |
The new term in this expression is proportional to the second Legendre polynomial, and it is introduced to describe the extra backscattering component. The value is a fit parameter used to tune the relative strength of forward to backward scattering.
The binned APF signal observed in the FD is therefore subjected to a 4-parameter fit:
| (7) |
where , , and are the fit parameters.
In principle, the parameters and , which describe the relative amount of Rayleigh and Mie scattering, can be determined from measurements of the extinction lengths and and assumptions about the particle albedo, i.e. the ratio of light scattered by the aerosol particle in all directions to the amount of incoming light. The albedo is close to one if the particle is mostly reflective. Since local information on the extinction lengths was not available for this analysis, we use and as additional fit parameters. We find that the distinct shapes of the two phase functions does allow a determination of and from the data themselves.
At Coihueco, the APF signal is seen in 5 out of the 6 mirrors, so the track is visible over in azimuth. At the boundary between each mirror there is some overlap in the fields of view of pixels. This overlap produces a double counting of signal resulting in the value of bins at boundaries being too large. These bins are simply ignored in the fit. The values of the other bins and their errors are obtained from the mean and standard deviation of the five APF shots in each shot sequence.
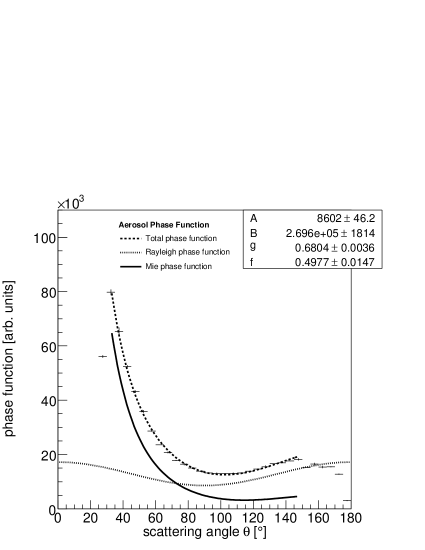
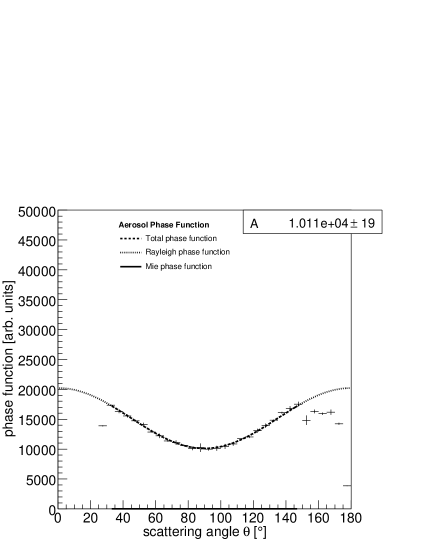
On clear nights with few or no aerosols, the fit to Eq. 7 returns unphysical values for the parameters , , and . In those cases, we re-fit the data to a pure Rayleigh function by setting , , and equal to zero. Two examples of fits, one for a night with aerosol content, and one for a night with pure Rayleigh scattering, are shown in Fig. 6. The aerosol, molecular, and total phase functions are shown. The aerosol phase function is obtained by subtracting the molecular component determined by the fit.
We fit the data only over a subrange of the available scattering angles, from to . As Fig. 6 indicates, the data deviates from the theoretical prediction for scattering angles below and above . At smaller and larger angles, several effects corrupt the signal and make it unusable for the fit to the phase function. Due to the local geometry at the Coihueco site (see Fig. 4), the APF shot is not visible for , and below , the signal is incomplete because the beam is still partially beneath the detector field of view. At large scattering angles, the beam is at a rapidly increasing distance to the corresponding FD bay, and attenuation of light from the beam to the detector becomes important. As mentioned earlier, because local measurements of the optical depth are not yet available, we simply assume . As measurements of become available, the attenuation of light scattered at large angles can be used to correct the data.
In order to apply geometrical corrections when binning the data, the angle at which the APF light source shoots ( in Fig. 4) with respect to the FD and the elevation angle of the shot direction needs to be known. We determined these values from the data themselves. The elevation angle was determined from a reconstruction of APF shots with the FD offline reconstruction [16], and was determined from the analysis of APF shots on nights where aerosol scattering was negligible. The data from these nights were fit to the Rayleigh component of the phase function, with the position of the minimum (nominally at scattering angle) as a free parameter. The fit value of this angle was then used to deduce the direction which the APF light source shoots relative to the FD ( at Coihueco).
4 First Results
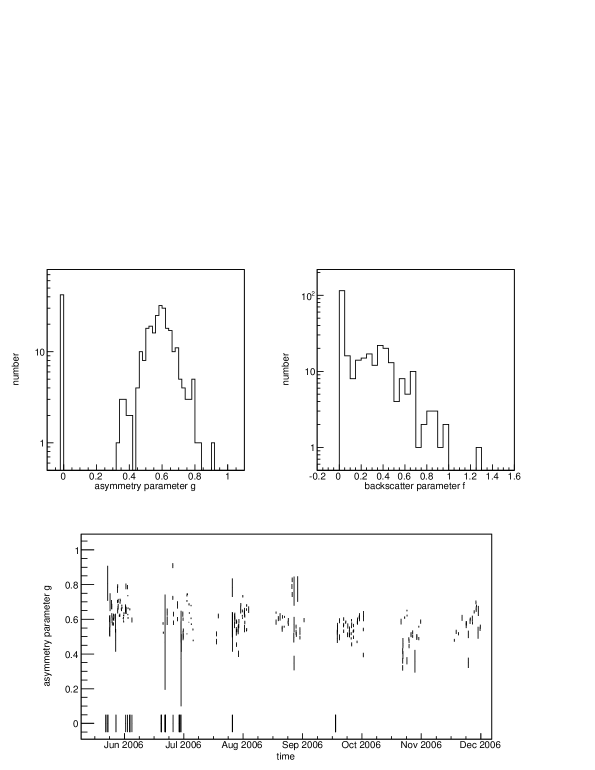
We have applied the analysis described in Section 3 to data recorded between June and December 2006 at the Coihueco site. Since the APF light sources operate during all nights of FD operation, this data set includes all moonless nights, with the exception of nights with rain or strong winds when the FDs remain closed. Fig. 7 shows the distribution of the asymmetry parameter (left) and the backscatter parameters (right). For most nights with aerosol contamination, the value of at the experiment site in Malargüe is , with an average of 0.59 and a standard deviation of 0.07 for the data period analyzed here. Values of indicate hours where the measured phase function can be described by pure Rayleigh scattering, so the aerosol phase function is effectively negligible. Fig. 7 also shows the asymmetry parameter as a function of time for the analyzed period. With the limited amount of data taken so far, no conclusions concerning seasonal variations can be drawn. The asymmetry parameter appears to be stable during the observed time period. With more data becoming available over the next few years, we plan to monitor the month-to-month variation in and analyze possible correlations with other weather measurements.
One of the main tasks of the APF, in addition to providing the in situ aerosol phase function for every hour of FD data taking, is the identification of “clear” nights with small aerosol contamination. These nights play an important role in the calibration of other atmospheric monitoring devices such as the Central Laser Facility (CLF) [6]. On clear nights, the measured phase function can be described by pure Rayleigh scattering (measurements where this is the case appear as in Fig. 7).
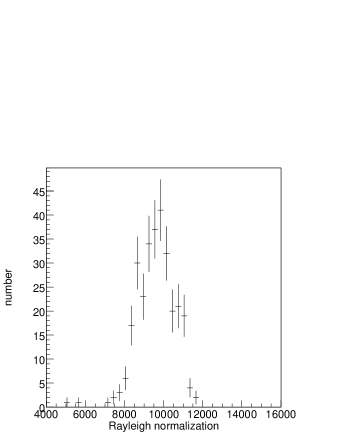
To confirm the reliability of the fit where both the normalization of the Mie and the Rayleigh contribution are fit parameters, Fig. 8 shows the Rayleigh normalization factor for the same data set. One might expect the molecular contribution to be rather stable, and in fact this parameter does not change much with time.
It is instructive to compare the average asymmetry parameter obtained from the APF with model expectations and measurements at comparable locations. Typically, measurements are performed at optical wavelengths and cannot be directly compared to measurements at UV wavelengths. However, a compilation at different wavelengths from 450 nm to 700 nm [17] shows that the wavelength dependence of is small; values at 450 nm are a few percent larger than at 550 nm.
To first order, is often used as a generic value for in radiative transfer models. A smaller value for is expected at dry locations. A parameterization of aerosol optical properties by d’Almeida et al. [18] suggests values for between 0.64 and 0.83 at 550 nm depending on aerosol type and season, with higher averages for high relative humidity.
The Pierre Auger Observatory is located east of the Andes in the Pampa Amarilla, an arid high plateau at 1420 m a.s.l., so values around 0.6 are within expectations. For comparison, recent measurements carried out in the Southern Great Planes of the US [19] yield values for at 550 nm of for dry conditions and for ambient conditions.
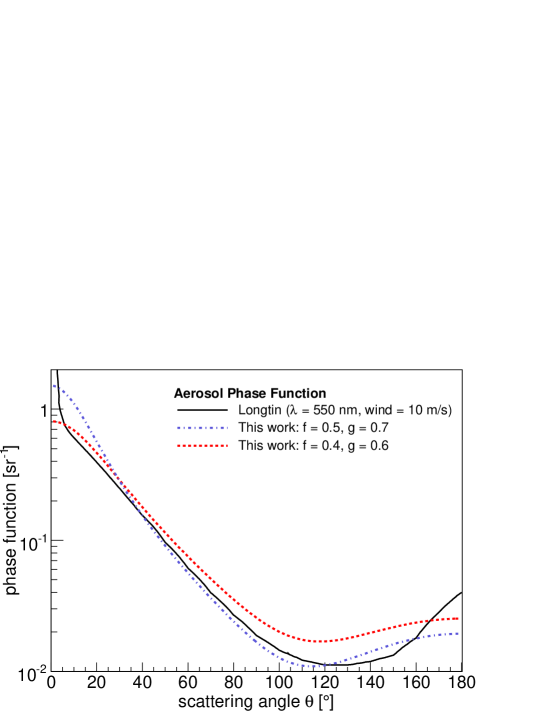
The aerosol phase function most commonly used in fluorescence detector data analysis, both for the High Resolution Fly’s Eye (HiRes) Experiment [20], which operated in Utah between 1997 and 2006, and the Pierre Auger FD detectors, is the function obtained from a desert aerosol simulation by Longtin [21]. Longtin’s desert model is based on Mie scattering theory and assumes that the desert atmosphere has three major components: carbonaceous particles, water-soluble particles, and sand. For each aerosol component, the model assumes a characteristic log normal size distribution and refractive index. Longtin performed his calculations for several wavelengths and wind speeds; those made at 550 nm with a wind speed of 10 m/s most closely match the 300 nm to 400 nm nitrogen fluorescence band observed by the FDs and have therefore been traditionally used in air fluorescence data analysis.
Fig. 9 compares the Longtin aerosol phase function at 550 nm to the modified Henyey-Greenstein function of Eq. 6 with two sets of and : and , the default values used by the Auger atmospheric database; and and , the values determined in this study to be more typical of the detector location. The comparison shows that, on average, the difference between the Longtin function and the measured phase function is small for those scattering angles relevant in fluorescence measurements — to . Only at the largest scattering angles above do the phase functions differ notably. This region is outside the current range of validity of our measurement.
Our primary interest in aerosol scattering is its effect on the air shower reconstruction, most notably the determination of the shower energy. However, it is not straightforward to estimate the extent to which the use of measured rather than averaged values of and changes the energy reconstruction, as this depends strongly on other atmospheric parameters, for example the aerosol optical depth. Rather than singling out the phase function measurement, we need to study the effect of the combined measurement of all atmospheric parameters, a task which is beyond the scope of this paper.
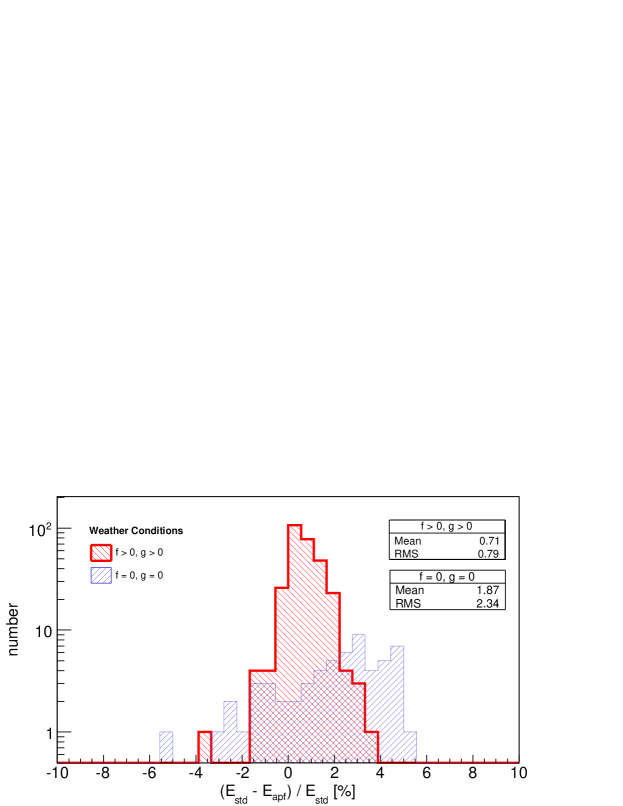
We can, however, get an estimate of the relevance of the phase function measurement by studying its effect on the energies of events that are of particular importance for the energy calibration of the detector, the “golden hybrid events.” These are events observed by one or more fluorescence detectors and three or more surface array tanks. For “golden hybrid events” observed by the Coihueco FD site between June and December 2006, we performed the reconstruction twice: first, using the default parameters and to estimate aerosol scattering; and second, using the fit parameters determined from APF measurements. In both cases atmospheric extinction was simulated using an average aerosol profile model representative of the Malargüe site [22, 23].
Fig. 10 depicts the relative differences in energies caused by reconstructing showers with the default phase function and the measured phase function. The red (bold) histogram represents data taken during nights with aerosol contamination (, ) while the blue (light) histogram represents data taken during nights where according to the APF analysis scattering is purely molecular. The correction is typically of order one percent. However, on those nights when aerosol loading is extremely low, so that atmospheric scattering may be characterized as purely molecular, the use of the default scattering parameters causes larger errors in the shower reconstruction. Under such conditions, the total phase function lacks the strong forward-scattering component typical of aerosols. During these periods, incorrectly accounting for aerosol scattering starts to impact the energy calibration of the detector. A correct determination of the phase function on a regular basis is therefore an important part of the atmospheric monitoring efforts at the site.
5 Conclusions and Outlook
As part of the atmospheric monitoring program at the Pierre Auger Observatory, the aerosol phase function at 350 nm is routinely measured at two of the four FD sites. A first analysis of data taken from June to December 2006 shows that values of for the mean cosine of the scattering angle are typical for aerosols at the site of the experiment. Over the next several years, the APF light sources will produce a data set of unprecedented size of the scattering properties of aerosols. This data set will enable us to carefully study any seasonal change in the aerosol content. The APF light sources and the other atmospheric monitoring instruments at the Auger site will accumulate one of the largest sets of continuous measurements in the 300 nm to 400 nm range ever recorded for a single location.
The APF light sources are currently operating at a wavelength of 350 nm only. In the near future, we will add regular measurements at 330 nm and 390 nm to study the dependence of the phase function on the wavelength of the scattered light.
References
- [1] P. Mantsch (for the Pierre Auger Collaboration), The Pierre Auger Observatory Status and Progress, in Proc. Int. Cosmic Ray Conference, Pune, India (2005) (astro-ph/0604114); www.auger.org.
- [2] J. Abraham et al. (Pierre Auger Collaboration), Astroparticle Phys. 27 (2007) 155.
- [3] J. Abraham et al. (Pierre Auger Collaboration), Astroparticle Phys., in press (2007) (astro-ph/0607382).
- [4] M. Mostafá (for the Pierre Auger Collaboration), Atmospheric Monitoring for the Pierre Auger Fluorescence Detector, in Proc. Int. Cosmic Ray Conference, Tsukuba, Japan (2003), 2 (HE 1.3), 465.
- [5] S.Y. BenZvi et al., Nucl. Instr. Meth. A, in press (2007) (astro-ph/0609063).
- [6] B. Fick et al., Journal of Instrumentation 1 (2006) P11003.
- [7] G. Mie, Ann. Phys. 25 (1908) 377.
- [8] M.D. Roberts, J. Phys. G: Nucl. Part. Phys 31 (2005) 1291.
- [9] J.A.J. Matthews, R. Clay, for the Pierre Auger Collaboration, Atmospheric Monitoring for the Auger Fluorescence Detector, in Proc. Int. Cosmic Ray Conference, Hamburg, Germany (2001), 2 (HE 1.8), 745.
- [10] J.A.J. Matthews et al., APF Light Sources for the Auger Southern Observatory, in Proc. Int. Cosmic Ray Conference, Tsukuba, Japan (2003), 2 (HE 1.5), 873.
- [11] The Pierre Auger Collaboration, Performance of the Fluorescence Detectors of the Pierre Auger Observatory, in Proc. Int. Cosmic Ray Conference, Pune, India (2005) (astro-ph/0508389).
- [12] A. Bucholtz, Appl. Opt. 34 (1995) 2765.
- [13] L. Henyey and J. Greenstein, Astrophys. Journal 93 (1941) 70.
- [14] E.S. Fishburne, M.E. Neer, and G. Sandri, Voice Communication via Scattered Ultraviolet Radiation, Report 274, Vol. 1, Aeronautical Research Associates of Princeton, Princeton, NJ (1976).
- [15] F. Riewe and A.E.S. Green, Applied Optics 17 (1978) 1923.
- [16] S. Argirò et al., submitted to Computer Physics Communications (2007).
- [17] M. Fiebig and J.A. Ogren, J. Geophys. Res. 111 (2006) D21204.
- [18] G.A. d’Almeida, P. Koepke, and E.P. Shettle, Atmospheric Aerosols: Global Climatology and Radiative Characteristics, A. Deepak Publishing, Hampton, Virginia (1991).
- [19] E. Andrews et al., J. Geophys. Res. 111 (2006) D05S04.
- [20] G.B. Thomson et al. (for the HiRes Collaboration), Nucl. Phys. Proc. Suppl. 136 (2004) 28; www.cosmic-ray.org.
- [21] D.R. Longtin, A Wind Dependent Desert Aerosol Model: Radiative Properties, Air Force Geophysics Laboratories, AFL-TR-88-0112, 1988.
- [22] S.Y. BenZvi et al. (for the Pierre Auger Collaboration), Measurement of Aerosols at the Pierre Auger Observatory, in Proc. Int. Cosmic Ray Conference, Mérida, México (2007).
- [23] M. Prouza (for the Pierre Auger Collaboration), Systematic Study of Atmosphere-Induced Influences and Uncertainties on Shower Reconstruction at the Pierre Auger Observatory, in Proc. Int. Cosmic Ray Conference, Mérida, México (2007).