Chandra Observations of Supernova 1987A
Abstract
We have been monitoring Supernova (SN) 1987A with Chandra X-Ray Observatory since 1999. We present a review of previous results from our Chandra observations, and some preliminary results from new Chandra data obtained in 2006 and 2007. High resolution imaging and spectroscopic studies of SN 1987A with Chandra reveal that X-ray emission of SN 1987A originates from the hot gas heated by interaction of the blast wave with the ring-like dense circumstellar medium (CSM) that was produced by the massive progenitor’s equatorial stellar winds before the SN explosion. The blast wave is now sweeping through dense CSM all around the inner ring, and thus SN 1987A is rapidly brightening in soft X-rays. At the age of 20 yr (as of 2007 January), X-ray luminosity of SN 1987A is 2.4 1036 ergs s-1 in the 0.510 keV band. X-ray emission is described by two-component plane shock model with electron temperatures of 0.3 and 2 keV. As the shock front interacts with dense CSM all around the inner ring, the X-ray remnant is now expanding at a much slower rate of 1400 km s-1 than it was until 2004 ( 6000 km s-1).
Keywords:
supernova remnants; supernovae; SN 1987A; X-rays:
98.38.Mz1 Introduction
Supernova (SN) 1987A, the nearest SN in four centuries, occurred in the Large Margellanic Cloud (LMC). The identification of a Type II SN from a blue supergiant progenitor and the detection of neutrino bursts associated with the SN indicate a core-collapse explosion of a massive star arnett89 . SN 1987A, providing these fundamental parameters and being located at a near distance ( = 50 kpc), is a unique opportunity for the study of a massive star’s death and the subsequent birth of a supernova remnant (SNR) in unprecedented detail.
About 10 yr after the SN explosion, the blast wave started to interact with the “inner ring” of dense circumstellar medium (CSM) michael00 , which is believed to be produced by the equatorial stellar winds of the massive progenitor star. This shock-CSM interaction resulted in a dramatic brightening of SN 1987A in soft X-rays, which provides an excellent laboratory for the X-ray study of the evolution of an optically thin thermal plasma in nonequilibrium ionization (NEI) as the shock propagates through a complex density gradient of the dense CSM. As the rapidly brightening X-rays begin to illuminate the interior of the SN, metal-rich ejecta expelled from the massive star’s core will begin to glow optically, allowing us to study SN nucleosynthesis yields. Then, a few decades from now, when these newly-formed elements begin to cross the reverse shock surface, we will be able to measure the distribution of these elements in more detail through their X-ray emission. Neutrino bursts were a strong support for a core-collapse explosion, and thus for the creation of a neutron star which should become bright in X-rays.
High resolution imaging and spectroscopic studies of SN 1987A with Chandra X-Ray Observatory are an ideal tool for the X-ray study of SN 1987A. We have thus been observing SN 1987A with Chandra since its launch in 1999, roughly twice a year, in order to monitor the earliest stages of the evolution of the X-ray remnant of SN 1987A. We here review previous results from our Chandra observations of SNR 1987A burrows00 ; michael02 ; park02 ; park04 ; park05 ; park06 ; zhekov05 ; zhekov06 , and present some preliminary results from the latest Chandra observations.
2 Observations
Our Chandra observations of SNR 1987A are listed in Table 1. As of 2007 January, we have performed a total of sixteen Chandra observations of SNR 1987A, including two deep gratings observations. Data reduction and analysis process have been described in the literatures burrows00 ; michael02 ; park04 ; zhekov05 .
| Observation ID | Date (Age)111 | Instrument (Subarray) | Exp. (ks) | Counts |
|---|---|---|---|---|
| 124+1387222 | 1999-10-6 (4609) | ACIS-S+HETG | 116.1 | 690333 |
| 122 | 2000-1-17 (4711) | ACIS-S3 (None) | 8.6 | 607 |
| 1967 | 2000-12-07 (5038) | ACIS-S3 (None) | 98.8 | 9030 |
| 1044 | 2001-4-25 (5176) | ACIS-S3 (None) | 17.8 | 1800 |
| 2831 | 2001-12-12 (5407) | ACIS-S3 (None) | 49.4 | 6226 |
| 2832 | 2002-5-15 (5561) | ACIS-S3 (None) | 44.3 | 6427 |
| 3829 | 2002-12-31 (5791) | ACIS-S3 (None) | 49.0 | 9277 |
| 3830 | 2003-7-8 (5980) | ACIS-S3 (None) | 45.3 | 9668 |
| 4614 | 2004-1-2 (6157) | ACIS-S3 (None) | 46.5 | 11856 |
| 4615 | 2004-7-22 (6359) | ACIS-S3 (1/2) | 48.8 | 17979 |
| 4640+4641+5362+5363+6099† | 2004-8-269-5 (6400) | ACIS-S+LETG | 289.0 | 16557∗∗ |
| 5579+6178† | 2005-1-12 (6533) | ACIS-S3 (1/8) | 48.3 | 24939 |
| 5580+6345† | 2005-7-14 (6716) | ACIS-S3 (1/8) | 44.1 | 27048 |
| 6668 | 2006-1-28 (6914) | ACIS-S3 (1/8) | 42.3 | 30940 |
| 6669 | 2006-7-28 (7095) | ACIS-S3 (1/8) | 36.4 | 30870 |
| 7636 | 2007-1-19 (7271) | ACIS-S3 (1/8) | 33.5 | 32798 |
3 X-Ray Images
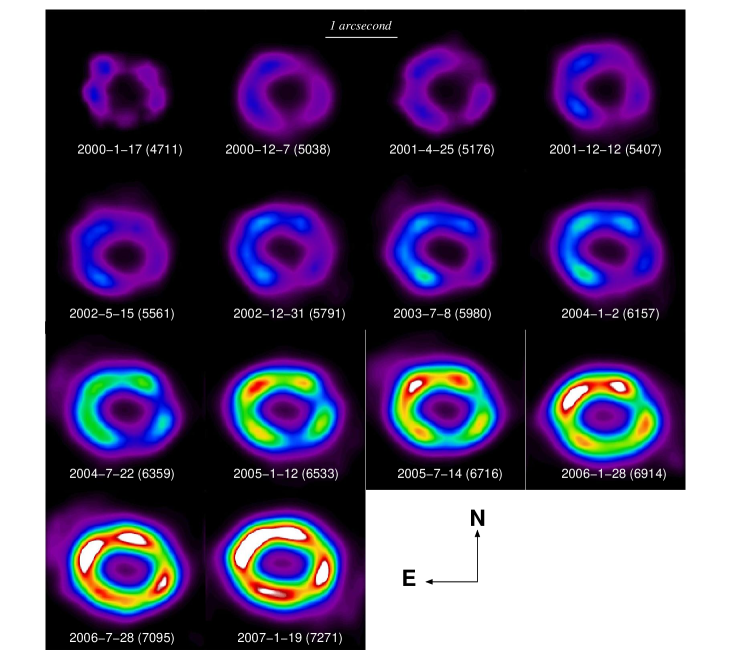
Broadband Chandra ACIS images of SNR 1987A are presented in Fig. 1. We applied a subpixel resolution method tsunemi01 , deconvolved images with the detector point spread function (PSF), and then smoothed. The ring-like overall morphology of the X-ray remnant is evident. SNR 1987A has been brightening and expanding for the last 7 yr. Initially, the eastern side was brighter, but then the western side began brightening in early 2004 (day 6200). SNR 1987A is now bright all around the ring. Early images showed that the soft X-ray band images ( 1.2 keV) were correlated with the optical images while the hard band ( 1.2 keV) image matched the radio images park02 . These differential X-ray morphologies supported our interpretation that soft X-rays are produced by the decelerated shock entering dense protrusions of the inner ring and that hard X-rays originate from the fast shock propagating through less dense regions between protrusions. Recent data show that the X-ray morphology is now nearly identical between the hard and soft bands, which is perhaps expected as an increasing fraction of the blast wave shock front is reaching dense CSM all around the inner ring park04 . The 0.38 keV band count rate is now 0.98 c s-1, which is 14 times brighter than it was in 2000.
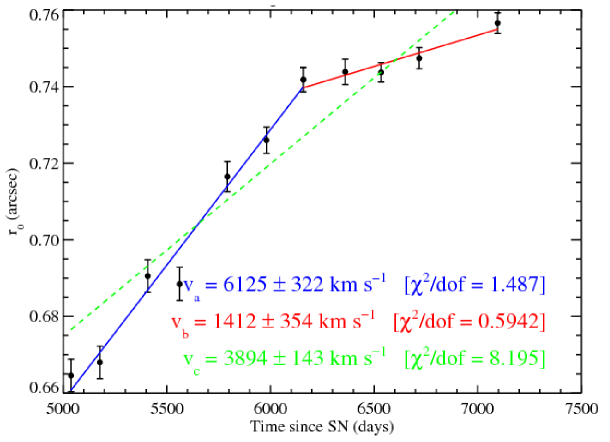
Assuming the apparent X-ray morphology of SNR 1987A (i.e., an elliptical torus superposed with 34 bright lobes), we model X-ray images to derive the best-fit radius at each epoch. The details of our image modeling are presented in the literature (Racusin et al. in preparation). Measured radii indicate that the X-ray remnant is expanding with an overall expansion rate of 3900 km s-1 (Fig. 2), which is consistent with our previous estimates park04 . It is, however, intriguing to note that the expansion rate is significantly reduced to 1400 km s-1 since day 6200 (Fig. 2). Deceleration of the expansion rate is in fact in good agreement with our interpretation of the shock reaching dense CSM all around the inner ring on days 60006200 park05 .
4 X-Ray Spectrum

| Age444 (days) | kT(soft) (keV) | kT(hard) (keV) | net(hard) (1011 cm-3 s) | EM(soft) (1058 cm-3) | EM(hard) (1058 cm-3) | 2/ |
|---|---|---|---|---|---|---|
| 6914 | 0.31 | 2.21 | 2.24 | 29.28 | 3.54 | 178.3/142 |
| 7095 | 0.29 | 2.03 | 2.63 | 37.89 | 4.65 | 240.5/141 |
| 7271 | 0.31 | 1.96 | 3.63 | 40.80 | 5.61 | 183.6/142 |
The X-ray spectrum of SNR 1987A is line-dominated, indicating a thermal origin (Fig. 3). As the shock interacts with increasing amount of dense CSM, multiple components of hot optically thin plasma are required to adequately fit the observed X-ray spectrum park04 ; park06 ; zhekov06 . In fact, a two-temperature NEI plane shock model fits the observed ACIS spectrum of SNR 1987A (Fig. 3a). The soft and hard components characteristically represent the decelerated shock (by dense protrusions of the inner ring) and the fast shock propagating into less-dense medium, respectively. Results from two-component plane shock model fits of the ACIS spectrum for the latest three epochs, which have not been published, are presented in Table 2. The foreground column is fixed at = 2.35 1021 cm-2 park06 . Metal abundances are fixed at values measured by Zhekov et al. zhekov06 , which are generally consistent with the LMC abundances. Ionization timescales for the soft component ( 0.3 keV) are high ( 1012 cm-3 s), indicating the hot gas is in collisional ionization equilibrium due to the shock interaction with dense CSM.
The high resolution dispersed spectrum obtained by the deep LETG observation revealed detailed X-ray emission lines from various elemental species (Fig. 3b, zhekov05 ). The high-quality LETG spectrum showed that the continuous distribution of the shock temperature is represented by two dominant components ( 0.5 and 2.5 keV) zhekov06 . The LETG spectrum indicated LMC-like metal abundances with a moderate enhancement in N zhekov06 . X-ray line broadening measurements using the deep LETG observation indicated shock velocities of 3001700 km s-1 zhekov05 which are significantly lower than that deduced from the HETG observation performed 5 yr earlier ( 3400 km s-1, michael02 ). These results are consistent with the ACIS spectral analysis, supporting the interpretation of the blast wave recently interacting with the entire inner ring.
5 X-Ray Light curves
| Age555 | fX(0.52 keV)666 | fX(310 keV)† | LX(0.510 keV)777 |
|---|---|---|---|
| 4711 | 1.610.66 | 0.840.57 | 1.54 |
| 5038 | 2.400.22 | 0.920.21 | 2.22 |
| 5176 | 2.710.54 | 1.220.41 | 2.59 |
| 5407 | 3.550.43 | 1.200.44 | 3.24 |
| 5561 | 4.190.46 | 1.490.64 | 3.79 |
| 5791 | 5.620.45 | 1.820.46 | 5.05 |
| 5980 | 6.440.52 | 1.950.62 | 5.71 |
| 6157 | 7.730.62 | 2.380.57 | 6.82 |
| 6359 | 11.480.69 | 2.400.60 | 9.54 |
| 6533 | 16.290.65 | 2.800.73 | 13.58 |
| 6716 | 19.410.97 | 3.260.68 | 16.06 |
| 6914 | 21.961.10 | 3.450.69 | 17.99 |
| 7095 | 25.561.28 | 3.840.77 | 20.58 |
| 7271 | 29.621.48 | 4.410.88 | 23.54 |

.
We present the soft (0.52 keV) and hard (310 keV) band X-ray light curves in Table 3 and Fig. 4. We also present the ROSAT hasinger96 and radio888Radio data obtained with Australian Telescope Compact Array (ATCA) have been provided by L. Staveley-Smith. light curves (Fig. 4). The soft X-ray light curve has been increasing nearly exponentially for the last several yr, with apparent “upturns” on days 35004000 and days 60006200. These features were interpreted as the time when the blast wave first made contact with the dense protrusions, and the time when the shock reached the main body of the inner ring park05 . The latest data points (days 6700) suggest that the soft X-ray flux is still rapidly increasing, but probably less steeply than it was for the previous 2 yr (Fig. 4). This latest behavior of the soft X-ray light curve might have implications for the details of the density structure of the inner ring. Periodic monitoring of the soft X-ray flux is important to study the details of the density and abundance structures of the inner ring.
The hard X-ray light curve is increasing at a lower rate than the soft X-ray light curve (Fig. 4). This slow increase rate appears to be roughly consistent with the radio light curve (Fig. 4). Hard X-rays in SNR 1987A might thus originate from the same synchrotron radiation as radio emission does. However, the morphology of hard X-ray images is no longer distinguishable from that of soft X-ray images park05 . The origin of hard X-ray emission from SNR 1987A is thus uncertain. Periodic monitoring of hard X-ray and radio light curves and searching for X-ray lines in the hard band (e.g., Fe K lines) will be important to reveal the origin of hard X-ray emission.
6 The ACIS Photon Pile-Up
Based on their XMM-Newton data analysis, Haberl et al. haberl06 argued that our Chandra soft X-ray light curve park05 was significantly contaminated by the ACIS photon pileup. They re-estimated the 0.52 keV band ACIS fluxes of SNR 1987A using archival Chandra data, and calculated pileup correction factors for the measured ACIS fluxes. Their 0.52 keV band flux correction factors were up to 25%, especially for recent epochs of days 6533 and 6716. Thus, they claimed that the reported upturn of the soft X-ray light curve on days 60006200 park05 was an artifact caused by the photon pileup.
Haberl et al., however, misunderstood our Chandra instrument setup for three epochs: we used the HETG on day 4609 and a 1/8 subarray of the ACIS on days 6533 and 6716, while they assumed the bare ACIS on day 4609 and a 1/2 subarray of the ACIS on days 6533 and 6716. Their ACIS flux corrections for these epochs were thus incorrect. We note that the ACIS photon pileup is not the sole contamination, and Haberl et al. did not consider other issues such as the charge transfer inefficiency and the time-dependent quantum efficiency degradation of the ACIS data. A moderate discrepancy (10%) is also known between XMM-Newton and Chandra due to the imperfect cross-calibration between them. Furthermore, SNR 1987A is an extended source as observed with the Chandra ACIS, whereas a pointlike source was apparently assumed by Haberl et al.
Considering these technical issues, we have re-analyzed the possible effects of ACIS photon pile-up on our Chandra observations using three independent methods: PIMMS/XSPEC simulations, ACIS event grade distribution analysis, and the (modified) standard ACIS photon pileup model. Our results from these three analyses agree that flux correction factors due to the ACIS photon pileup are roughly several % or less, with the exception of day 6157 where 15% of the soft X-ray flux appeared to be lost due to photon pileup (see Park et al. [in preparation] for the detailed results). Based on these results, we confirm that the scientific conclusions by Park et al. park05 were not affected by the ACIS photon pileup.
References
- (1) W. D. Arnett, J. N. Bahcall, R. P. Kirshner, and S. E. Woosley, Annual Review of Astronomy and Astrophysics 27, 629–700 (1989).
- (2) D. N. Burrows, E. Michael, U. Hwang, R. McCray, R. A. Chevalier, R. Petre, G. P. Garmire, S. S. Holt, and J. A. Nousek, The Astrophysical Journal 543, L149–L152 (2000).
- (3) F. Haberl, U. Geppert, B. Aschenbach, and G. Hasinger, Astronomy & Astrophysics 460, 811–819 (2006).
- (4) G. Hasinger, B. Aschenbach, and J. Trümper, Astronomy & Astrophysics 312, L9–L12 (1996).
- (5) E. Michael, R. McCray, C. S. J. Pun, P. Garnavich, P. Challis, R. P. Kirshner, J. Raymond, K. J. Borkowski, R. A. Chevalier, A. V. Filippenko, C. Fransson, P. Lundqvist, N. Panagia, M. M. Phillips, G. Sonneborn, N. B. Suntzeff, L. Wang, and C. J. Wheeler The Astrophysical Journal 542, L53–L56 (2000).
- (6) E. Michael, S. A. Zhekov, R. McCray, U. Hwang, D. N. Burrows, S. Park, G. P. Garmire, S. S. Holt, and G. Hasinger The Astrophysical Journal 574, 166–178 (2002).
- (7) S. Park, D. N. Burrows, G. P. Garmire, J. A. Nousek, R. McCray, E. Michael, and S. A. Zhekov The Astrophysical Journal 567, 314–322 (2002).
- (8) S. Park, S. A. Zhekov, D. N. Burrows, G. P. Garmire, and R. McCray, The Astrophysical Journal 610, 275–284 (2004).
- (9) S. Park, S. A. Zhekov, D. N. Burrows, and R. McCray, The Astrophysical Journal 634, L73–L76 (2005).
- (10) S. Park, S. A. Zhekov, D. N. Burrows, G. P. Garmire, J. L. Racusin, and R. McCray, The Astrophysical Journal 646, 1001–1008 (2006).
- (11) H. Tsunemi, K. Mori, E. Miyata, C. Baluta, D. N. Burrows, G. P. Garmire, and G. Chartas, The Astrophysical Journal 554, 496–504 (2001)
- (12) S. A. Zhekov, R. McCray, K. J. Borkowski, D. N. Burrows, and S. Park, The Astrophysical Journal 628, L127–L130 (2005).
- (13) S. A. Zhekov, R. McCray, K. J. Borkowski, D. N. Burrows, and S. Park, The Astrophysical Journal 645, 293–302 (2006).