Symmetry disquisition on the TiOX phase diagram
Abstract
The sequence of phase transitions and the symmetry of in particular the low temperature incommensurate and spin-Peierls phases of the quasi one-dimensional inorganic spin-Peierls system TiOX (TiOBr and TiOCl) have been studied using inelastic light scattering experiments. The anomalous first-order character of the transition to the spin-Peierls phase is found to be a consequence of the different symmetries of the incommensurate and spin-Peierls (P) phases.
The pressure dependence of the lowest transition temperature strongly suggests that magnetic interchain interactions play an important role in the formation of the spin-Peierls and the incommensurate phases. Finally, a comparison of Raman data on VOCl to the TiOX spectra shows that the high energy scattering observed previously has a phononic origin.
pacs:
71.20;73.43;78.30;63.2;68.35pacs:
68.18.Jk Phase transitions63.20.-e Phonons in crystal lattices
75.30.Et Exchange and superexchange interactions
75.30.Kz Magnetic phase boundaries (including magnetic transitions, metamagnetism, etc.)
78.30.-j Infrared and Raman spectra
I Introduction
The properties of low-dimensional spin systems are one of the key topics of contemporary condensed matter physics. Above all, the transition metal oxides with highly anisotropic interactions and low-dimensional structural elements provide a fascinating playground to study novel phenomena, arising from their low-dimensional nature and from the interplay between lattice, orbital, spin and charge degrees of freedom. In particular, low-dimensional quantum spin (S=1/2) systems have been widely discussed in recent years. Among them, layered systems based on a electronic configuration were extensively studied in view of the possible relevance of quantum magnetism to high temperature superconductivityImada et al. (1998); Dagotto (1999). Though they received less attention, also spin=1/2 systems based on early transition metal oxides with electronic configuration , such as titanium oxyhalides (TiOX, with X=Br or Cl), exhibit a variety of interesting propertiesKataev et al. (2003); Imai and Choub (2003). The attention originally devoted to the layered quasi two-dimensional antiferromagnets arose from considering them as the electron analog to the high- cupratesMaule et al. (1988). Only recently TiOX emerged in a totally new light, namely as a one-dimensional antiferromagnet and as the second example of an inorganic spin-Peierls compound (the first being CuGeO3)Seidel et al. (2003); Caimi et al. (2004a).
The TiO bilayers constituting the TiOX lattice are candidates for various exotic electronic configurations, such as orbital orderedKataev et al. (2003), spin-PeierlsSeidel et al. (2003) and resonating-valence-bond statesBeynon and Wilson (1993). In the case of the TiOX family the degeneracy of the orbitals is completely removed by the crystal field splitting, so that the only electron present, mainly localized on the Ti site, occupies a nondegenerate energy orbitalKataev et al. (2003). As a consequence of the shape of the occupied orbital (which has lobes oriented in the and directions, where is perpendicular to the layers), the exchange interaction between the spins on different Ti ions arises mainly from direct exchange within the TiO bilayers, along the crystallographic directionKataev et al. (2003). This, in spite of the two-dimensional structural character, gives the magnetic system of the TiOX family its peculiar quasi one-dimensional propertiesSeidel et al. (2003). Magnetic susceptibilitySeidel et al. (2003) and ESR Kataev et al. (2003) measurements at high temperature are in reasonably good agreement with an antiferromagnetic, one-dimensional spin-1/2 Heisenberg chain model. At low temperature () TiOX shows a first-order phase transition to a dimerised nonmagnetic state, discussed in terms of a spin Peierls state Seidel et al. (2003); Caimi et al. (2004b); Shaz et al. (2005). Between this low temperature spin Peierls phase (SP) and the one-dimensional antiferromagnet in the high temperature phase (HT), various experimental evidence Hemberger et al. (2005); Rckamp et al. (2005a); Imai and Choub (2003); Lemmens et al. (2004) showed the existence of an intermediate phase, whose nature and origin is still debated. The temperature region of the intermediate phase is different for the two compounds considered in this work, for TiOBr K and K while for TiOCl K and K. To summarize the properties so far reported, the intermediate phase () exhibits a gapped magnetic excitation spectrumImai and Choub (2003), anomalous broadening of the phonon modes in Raman and IR spectraLemmens et al. (2004); Caimi et al. (2004b), and features of a periodicity incommensurate with the latticePalatinus et al. (2005); van Smaalen et al. (2005); Schoenleber et al. (2006); Krimmel et al. (2006). Moreover, the presence of a pressure induced metal to insulator transition has been recently suggested for TiOClKuntscher et al. (2006). Due to this complex phase behavior, both TiOCl and TiOBr have been extensively discussed in recent literature, and various questions still remain open: there is no agreement on the crystal symmetry of the spin Peierls phase, the nature and symmetry of the incommensurate phase is not clear and the anomalous first-order character of the transition to the spin Peierls state is not explained.
Optical methods like Raman spectroscopy are powerful experimental tools for revealing the characteristic energy scales associated with the development of broken symmetry ground states, driven by magnetic and structural phase transitions. Indeed, information on the nature of the magnetic ground state, lattice distortion, and interplay of magnetic and lattice degrees of freedom can be obtained by studying in detail the magnetic excitations and the phonon spectrum as a function of temperature. The present paper reports on a vibrational Raman study of TiOCl and TiOBr, a study of the symmetry properties of the three phases and gives coherent view of the anomalous first order character of the transition to the spin Peierls phase. Through pressure-dependence measurements of the magnetic susceptibility, the role of magnon-phonon coupling in determining the complex phase diagram of TiOX is discussed. Finally, via a comparison with the isostructural compound VOCl, the previously reportedLemmens et al. (2004, 2005) high energy scattering is revisited, ruling out a possible interpretation in terms of magnon excitations.
II Experiment
Single crystals of TiOCl, TiOBr, and VOCl have been grown by a chemical vapor transport technique. The crystallinity was checked by X-ray diffractionRckamp et al. (2005a). Typical crystal dimensions are a few mm2 in the plane and 10-100 m along the axis, the stacking directionvan Smaalen et al. (2005). The sample was mounted in an optical flow cryostat, with a temperature stabilization better than 0.1 K in the range from 2.6 K to 300 K. The Raman measurements were performed using a triple grating micro-Raman spectrometer (Jobin Yvon, T64000), equipped with a liquid nitrogen cooled CCD detector (resolution 2 cm-1 for the considered frequency interval). The experiments were performed with a 532 nm Nd:YVO4 laser. The power density on the sample was kept below 500 W/cm2 to avoid sample degradation and to minimize heating effects.
The polarization was controlled on both the incoming and outgoing beam, giving access to all the polarizations schemes allowed by the back-scattering configuration. Due to the macroscopic morphology of the samples (thin sheets with natural surfaces parallel to the planes) the polarization analysis was performed mainly with the incoming beam parallel to the axis ((aa), (ab) and (bb), in Porto notation). Some measurements were performed with the incoming light polarized along the axis, where the vector of the light was parallel to the plane and the polarization of the outgoing light was not controlled. These measurements will be labeled as ().
The magnetization measurements were performed in a Quantum Design Magnetic Property Measurement System. The pressure cell used is specifically designed for measurement of the DC-magnetization in order to minimize the cell’s magnetic response. The cell was calibrated using the lead superconducting transition as a reference, and the cell’s signal (measured at atmospheric pressure) was subtracted from the data.
III Results and Discussion
The discussion will start with a comparison of Raman experiments on TiOCl and TiOBr in the high temperature phase, showing the consistency with the reported structure. Afterwards, through the analysis of Raman spectra the crystal symmetry in the low temperature phases will be discussed, and in the final part a comparison with the isostructural VOCl will be helpful to shed some light on the origin of the anomalous high energy scattering reported for TiOCl and TiOBrLemmens et al. (2004, 2005).
III.1 High Temperature Phase
The crystal structure of TiOX in the high temperature (HT) phase consists of buckled Ti-O bilayers separated by layers of X ions. The HT structure is orthorhombic with space group P. The full representationRousseau et al. (1981) of the vibrational modes in this space group is:
| (1) |
Among these, the modes with symmetry , , and are infrared active in the polarizations along the , , and crystallographic axesCaimi et al. (2004b), respectively. The modes with symmetry , , and are expected to be Raman active: The modes in the polarization (), (), and (); the modes in () and the ones in ().
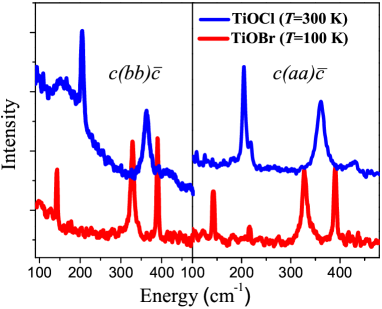
Fig.1 shows the room temperature Raman measurements in different polarizations for TiOCl and TiOBr, and
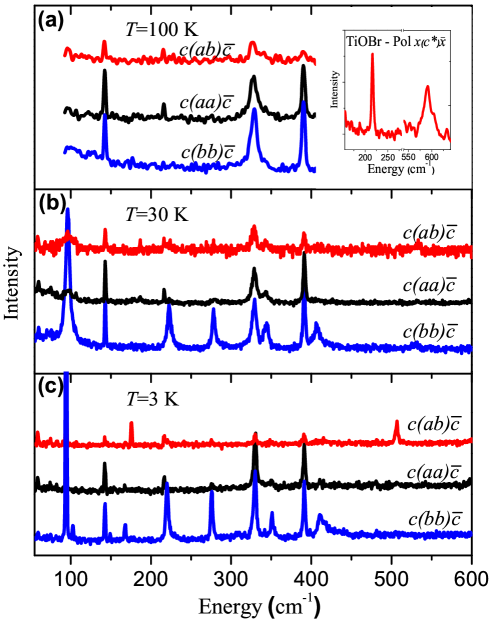
Fig.2 displays the characteristic Raman spectra for the three different phases of TiOBr, the spectra are taken at 100 (a), 30 (b) and 3K (c). At room temperature three Raman active modes are clearly observed in both compounds for the () and () polarizations (Fig.1), while none are observed in the () polarization. These results are in good agreement with the group theoretical analysis. The additional weakly active modes observed at 219 cm-1 for TiOCl and at 217 cm-1 for TiOBr are ascribed to a leak from a different polarization. This is confirmed by the measurements with the optical axis parallel to the -planes (()) on TiOBr, where an intense mode is observed at the same frequency (as shown in the inset of Fig.2(a)). In addition to these expected modes, TiOCl displays a broad peak in the () polarization, centered at around 160 cm-1 at 300K; a similar feature is observed in TiOBr as a broad background in the low frequency region at 100K. As discussed for TiOClLemmens et al. (2004), these modes are thought to be due to pre-transitional fluctuations. Upon decreasing the temperature, this ”peaked” background first softens, resulting in a broad mode at (see Fig.2(b)), and then locks at into an intense sharp mode at 94.5 cm-1 for TiOBr (Fig.2(c)) and at 131.5 cm-1 for TiOCl.
| (a) | TiOBr | TiOCl | VOCl | |||
|---|---|---|---|---|---|---|
| Exp. | Cal. | Exp. | Cal. | Exp. | Cal. | |
| 142.7 | 141 | 203 | 209.1 | 201 | 208.8 | |
| 329.8 | 328.2 | 364.8 | 331.2 | 384.9 | 321.5 | |
| 389.9 | 403.8 | 430.9 | 405.2 | 408.9 | 405.2 | |
| 105.5 | 157.1 | 156.7 | ||||
| 328.5 | 330.5 | 320.5 | ||||
| 478.2 | 478.2 | 478.2 | ||||
| 77111Value taken from Ref.Caimi et al. (2004a). | 75.7 | 104222Value taken from Ref.Caimi et al. (2004b). | 94.4 | 93.7 | ||
| 417111Value taken from Ref.Caimi et al. (2004a). | 428.5 | 438222Value taken from Ref.Caimi et al. (2004b). | 428.5 | 425.2 | ||
| 60 | 86.4 | 129.4 | 129.4 | |||
| 216 | 336.8 | 219333Value obtained considering the leakage in the polarization. | 336.8 | 327.2 | ||
| 598 | 586.3 | 586.3 | 585.6 | |||
| 131111Value taken from Ref.Caimi et al. (2004a). | 129.1 | 176222Value taken from Ref.Caimi et al. (2004b). | 160.8 | 159.5 | ||
| 275111Value taken from Ref.Caimi et al. (2004a). | 271.8 | 294222Value taken from Ref.Caimi et al. (2004b). | 272.1 | 269.8 | ||
| 155.7 | 194.1 | 192.4 | ||||
| 304.8 | 301.1 | 303.5 |
| (b) | Mode | (TiOBr) | Ti | O | Br | |
| 1 | 142.7 | 1.42 | 0.107 | 0.068 | 1 | |
| 2 | 329.8 | 1.11 | 1 | 0.003 | 0.107 | |
| 3 | 389.9 | 1.11 | 0.04 | 1 | 0.071 |
The frequency of all the vibrational modes observed for TiOCl and TiOBr in their high temperature phase are summarized in Table 1. Here, the infrared active modes are taken from the literatureCaimi et al. (2004b, a) and for the Raman modes the temperatures chosen for the two compounds are 300K for TiOCl and 100K for TiOBr. The observed Raman frequencies agree well with previous reportsLemmens et al. (2004). The calculated values reported in Table 1 are obtained with a spring-model calculation based on phenomenological longitudinal and transversal spring constants (see Appendix). The spring constants used were optimized using the TiOBr experimental frequencies (except for the ones of the modes due to their uncertain symmetry) and kept constant for the other compounds. The frequencies for the other two compounds are obtained by merely changing the appropriate atomic masses and are in good agreement with the experimental values. The relative atomic displacements for each mode of symmetry are shown in Table 2. The scaling ratio for the lowest frequency mode (mode 1) between the two compounds is in good agreement with the calculation of the atomic displacements. The low frequency mode is mostly related to Br/Cl movement and, indeed, the ratio is similar to the mass ratio . The other modes (2 and 3) involve mainly Ti or O displacements, and their frequencies scale with a lower ratio, as can be expected.
III.2 Low Temperature Phases
Although the symmetry of the low temperature phases has been studied by X-ray crystallography, there is no agreement concerning the symmetry of the SP phase; different works proposed two different space groups, PSchoenleber et al. (2006); Palatinus et al. (2005); van Smaalen et al. (2005) and PSasaki et al. (2006).
The possible symmetry changes that a dimerisation of Ti ions in the direction can cause are considered in order to track down the space group of the TiOX crystals in the low temperature phases. Assuming that the low temperature phases belong to a subgroup of the high temperature orthorhombic space group P, there are different candidate space groups for the low temperature phases. Note that the assumption is certainly correct for the intermediate phase, because the transition at is of second-order implying a symmetry reduction, while it is not necessarily correct for the low temperature phase, being the transition at is of first-order.
| (a) | Space group P |
|---|---|
| Unique axis to TiO plane, | |
| 4TiOBr per unit cell | |
| Raman active | |
| Raman active | |
| and IR active | |
| (b) | Space group P |
| Unique axis in the TiO plane, | |
| 4 TiOBr per unit cell | |
| Raman active | |
| Raman active | |
| and IR active | |
| (c) | Space group P |
| 4 TiOBr per unit cell | |
| Raman active | |
| Raman active | |
| and Raman active in and |
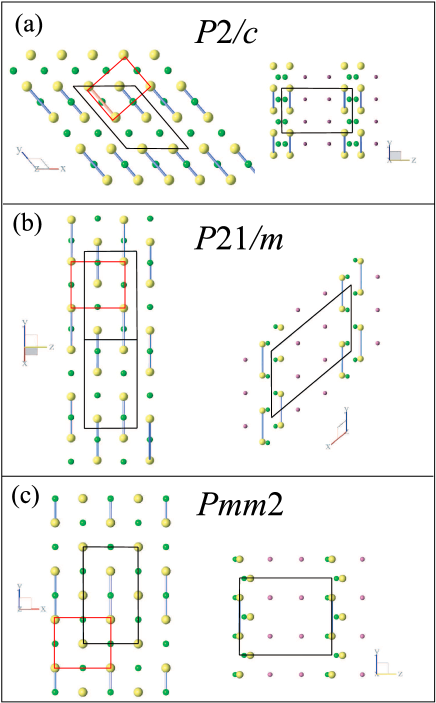
Fig.3 shows a sketch of the three possible low temperature symmetries considered, and Table 3 reports a summary of the characteristic of the unit cell together with the number of phonons expected to be active for the different space groups. Depending on the relative position of the neighboring dimerised Ti pairs, the symmetry elements lost in the dimerisation are different and the possible space groups in the SP phase are P (Table 3(a)), P (b) or P (c). The first two are monoclinic groups with their unique axis perpendicular to the TiO plane (along the axis of the orthorhombic phase), and lying in the TiO plane ( to the axis of the orthorhombic phase), respectively. The third candidate (Fig.3(c)) has orthorhombic symmetry.
The group theory analysis based on the two space groups suggested for the SP phase (PPalatinus et al. (2005) and PSasaki et al. (2006)) shows that the number of modes expected to be Raman active is different in the two cases (Table 3(b) and (c)). In particular, the 12 fully symmetric vibrational modes (), in the P space group, are expected to be active in the and polarizations, and modes are expected to be active in the cross polarizations ( and ). Note that in this notation, refers to the unique axis of the monoclinic cell, so corresponds to for the HT orthorhombic phase. For P the 11 vibrational modes are expected to be active in the polarizations, and only one mode of symmetry is expected to be active in the cross polarization ( or ).
| spin Peierls phase | |||||||
|---|---|---|---|---|---|---|---|
| (a) | TiOBr | 94.5 | 102.7 | 142.4 | 167 | 219 | |
| 276.5 | 330 | 351 | 392 | 411∗ | |||
| 175,6 | 506.5 | ||||||
| TiOCl | 131.5 | 145.8 | 203.5 | 211.5 | 296.5 | ||
| 305.3 | 322.6 | 365.1 | 387.5 | 431∗ | |||
| 178.5 | 524.3 | ||||||
| Intermediate phase | |||||||
|---|---|---|---|---|---|---|---|
| (b) | TiOBr (30K) | 94.5 | 142 | 221.5 | 277 | 328.5 | |
| 344.5 | 390.4 | ||||||
| TiOCl (75K) | 132.8 | 206.2 | 302 | 317.2 | 364.8 | ||
| 380 | 420.6 | ||||||
∗ The broad line shape of this feature suggests it may originate from a two-phonon process.
The experiments, reported in Table 4 for both compounds and in Fig.2 for TiOBr only, show that 10 modes are active in the and in the SP phase (Fig.2(c)), and, more importantly, two modes are active in the cross polarization . This is not compatible with the expectation for P. Hence the comparison between the experiments and the group theoretical analysis clearly shows that of the two low temperature structures reported in X-ray crystallographyvan Smaalen et al. (2005); Sasaki et al. (2006), only the P is compatible with the present results.
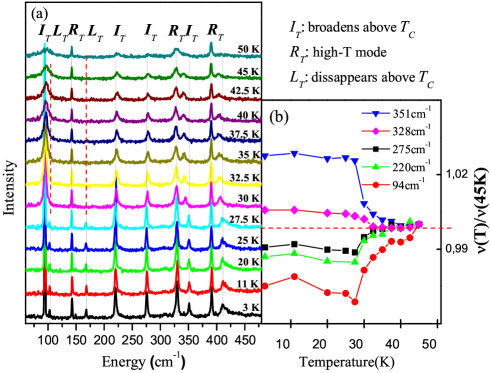
As discussed in the introduction, the presence of three phases in different temperature intervals for TiOX is now well established even though the nature of the intermediate phase is still largely debatedRckamp et al. (2005a); Caimi et al. (2004a); van Smaalen et al. (2005). The temperature dependence of the Raman active modes for TiOBr between 3 and 50 K, is depicted in Fig.4. In the spin-Peierls phase, as discussed above, the reduction of the crystal symmetrySchoenleber et al. (2006) increases the number of Raman active modes. Increasing the temperature above a different behavior for the various low temperature phonons is observed. As shown in Fig.4, some of the modes disappear suddenly at (labeled ), some stay invariant up to the HT phase () and some others undergo a sudden broadening at and slowly disappear upon approaching (). The polarization analysis of the Raman modes in the temperature region shows that the number of active modes in the intermediate phase is different from that in both the HT and the SP phases. The fact that at some of the modes disappear suddenly while some others do not disappear, strongly suggests that the crystal symmetry in the intermediate phase is different from both other phases, and indeed confirms the first-order nature of the transition at .
In the X-ray structure determination van Smaalen et al. (2005), the intermediate incommensurate phase is discussed in two ways. Firstly, starting from the HT orthorhombic (P) and the SP monoclinic space group (P - unique axis in the TiO planes, to ), the modulation vector required to explain the observed incommensurate peaks is two-dimensional for both space groups. Secondly, starting from another monoclinic space group, with unique axis perpendicular to the TiO bilayers (P), the modulation vector required is one-dimensional. The latter average symmetry is considered (in the commensurate variety) in Fig.3(a) and Table 3(a).
In the IP, seven modes are observed in the and geometry on both compounds (see Table 4(b)), and none in the geometry. This appears to be compatible with all the space groups considered, and also with the monoclinic group with unique axis perpendicular to the TiO planes (Table 3(a)). Even though from the evidence it is not possible to rule out any of the other symmetries discussed, the conjecture that in the intermediate incommensurate phase the average crystal symmetry is already reduced, supports the description of the intermediate phase as a monoclinic group with a one-dimensional modulationvan Smaalen et al. (2005), and moreover it explains the anomalous first-order character of the spin-Peierls transition at .
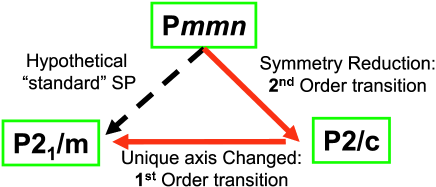
The diagram shown in Fig.5 aims to visualize that the space group in the spin-Peierls state (P) is a subgroup of the high temperature P group, but not a subgroup of any of the possible intermediate phase space groups suggested (possible P). This requires the phase transition at to be of first order, instead of having the conventional spin-Peierls second-order character.
Let us return to Fig.4(b) to discuss another intriguing vibrational feature of the intermediate phase. Among the modes characterizing the intermediate phase (), the ones at low frequency shift to higher energy approaching , while the ones at high frequency move to lower energy, seemingly converging to a central frequency (300 cm-1 for both TiOCl and TiOBr). This seems to indicate an interaction of the phonons with some excitation around 300 cm-1. Most likely this is in fact arising from a strong, thermally activated coupling of the lattice with the magnetic excitations, and is consistent with the pseudo-spin gap observed in NMR experimentsImai and Choub (2003); Baker et al. (2007) of 430 K (300 cm-1).
III.3 Magnetic Interactions
As discussed in the introduction, due to the shape of the singly occupied 3 orbital, the main magnetic exchange interaction between the spins on the Ti ions is along the crystallographic direction.
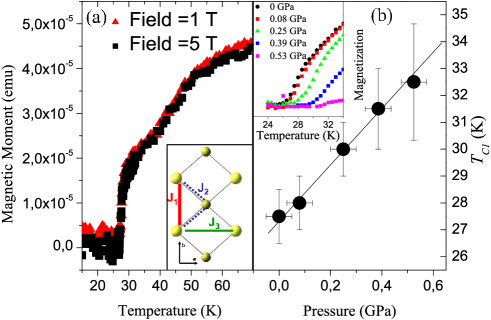
This, however, is not the only effective magnetic interaction. In fact, one also expects a superexchange interaction between nearest and next-nearest neighbor chains ( and in the insert of Fig.6(a))Macovez (2007). The situation of TiOX is made more interesting by the frustrated geometry of the interchain interaction, where the magnetic coupling between adjacent chains is frustrated and the exchange energies can not be simultaneously minimized. Table V reports the exchange interaction values for the three possible magnetic interactions calculated for TiOBr. These magnetic interactions were computed with a DFT Broken symmetry approachNoodleman and Norman (1979) using an atom cluster including the two interacting atoms and all the surrounding ligand atoms, in addition the first shell of Ti3+ ions was replaced by Al3+ ions and also included in the cluster. The calculations were performed with the Gaussian03 packageet al. using the hybrid exchange-correlation functional B3LYPBecke (1993) and the 6-3111G* basisset.
| TiOBr |
|---|
| K |
| K |
| K |
Although the computed value for the magnetic interaction along the axis is half of the value obtained from the magnetic susceptibility fitted with a Bonner-Fisher curve accounting for a one-dimensional Heisenberg chain, it is possible to extract some conclusions from the ab-initio computations. The most interesting outcome of the results is that in addition to the magnetic interaction along the axis, there is a relevant interchain interaction () in TiOBr. Firstly, this explains the substantial deviation of the Bonner-Fisher fit from the magnetic susceptibility even at temperature higher than . Secondly, the presence of an interchain interaction, together with the inherent frustrated geometry of the bilayer structure, was already proposed in literatureRckamp et al. (2005a) in order to explain the intermediate phase and its structural incommensurability.
The two competing exchange interactions and have different origins: the first arises from direct exchange between Ti ions, while the second is mostly due to the superexchange interaction through the oxygen ionsMacovez (2007). Thus, the two exchange constants are expected to depend differently on the structural changes induced by hydrostatic pressure, should increase with hydrostatic pressure (increases strongly with decreasing the distance between the Ti ions), while is presumably weakly affected due only to small changes in the Ti–O–Ti angle (the compressibility estimated from the lattice dynamics simulation is similar along the and crystallographic directions). The stability of the fully dimerized state is reduced by the presence of an interchain coupling, so that is expected to be correlated to . Pressure dependent magnetic experiments have been performed to monitor the change of upon increasing hydrostatic pressure. The main results, shown in Fig.6, indeed is consistent with this expectation: increases linearly with pressure; unfortunately it is not possible to address the behavior of from the present measurements.
III.4 Electronic Excitations and Comparison with VOCl
The nature of the complex phase diagram of TiOX was originally tentatively ascribed to the interplay of spin, lattice and orbital degrees of freedomCaimi et al. (2004a). Only recently, infrared spectroscopy supported by cluster calculations excluded a ground state degeneracy of the Ti orbitals for TiOCl, hence suggesting that orbital fluctuations can not play an important role in the formation of the anomalous incommensurate phaseRckamp et al. (2005b); Zakharov et al. (2006). Since the agreement between the previous cluster calculations and the experimental results is not quantitative, the energy of the lowest excited level is not accurately known, not allowing to discard the possibility of an almost degenerate ground state. For this reason a more formal cluster calculation has been performed using an embedded cluster approach. In this approach a TiO2Cl4 cluster was treated explicitly with a CASSCF/CASPT2 quantum chemistry calculation. This cluster was surrounded by eight Ti3+ TIP potentials in order to account for the electrostatic interaction of the cluster atoms with the shell of the first neighboring atoms. Finally, the cluster is embedded in a distribution of punctual charges fitting the Madelung’s potential produced by the rest of the crystal inside the cluster region. The calculations were performed using the MOLCAS quantum chemistry packageKarlstro et al. (2003) with a triple quality basis set; for the Ti atom polarization functions were also included.
| TiOCl | TiOBr | |
|---|---|---|
| 0.29-0.29 | 0.29-0.30 | |
| 0.66-0.68 | 0.65-0.67 | |
| 1.59-1.68 | 1.48-1.43 | |
| 2.30-2.37 | 2.21-2.29 |
The calculations reported in Table 6, confirmed the previously reported resultRckamp et al. (2005b) for both TiOCl and TiOBr. The first excited state is at 0.29-0.3 eV ( K) for both compounds, therefore the orbital degrees of freedom are completely quenched at temperatures close to the phase transition.
A comparison with the isostructural compound VOCl has been carried out to confirm that the phase transitions of the TiOX compounds are intimately related to the unpaired S=1/2 spin of the Ti ions. The V3+ ions have a 3 electronic configuration. Each ion carries two unpaired electrons in the external d shell, and has a total spin of 1. The crystal field environment of V3+ ions in VOCl is similar to that of Ti3+ in TiOX, suggesting that the splitting of the degenerate d orbital could be comparable. The electrons occupy the two lowest orbitals, of (responsible for the main exchange interaction in TiOX) and symmetry respectively. Where the lobes of the latter point roughly towards the Ti3+ ions of the nearest chain (Table 6). It is therefore reasonable to expect that the occupation of the orbital in VOCl leads to a substantial direct exchange interaction between ions in different chains in VOCl and thus favors a two-dimensional antiferromagnetic order. Indeed, the magnetic susceptibility is isotropic at high temperatures and well described by a quadratic two-dimensional Heisenberg model, and at K VOCl undergoes a phase transition to a two-dimensional antiferromagnetWiedenmann et al. (1984).
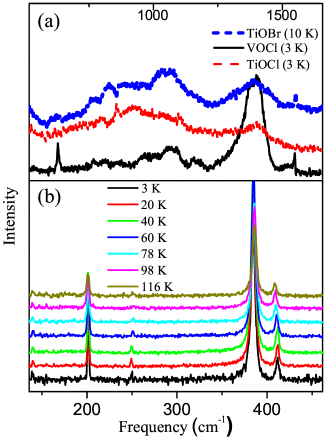
The space group of VOCl at room temperature is the same as that of TiOX in the high temperature phase (P), and, as discussed in the previous section, three modes are expected to be Raman active. As shown in Fig.7(b), three phonons are observed throughout the full temperature range ( K), and no changes are observed at . The modes observed are consistent with the prediction of lattice dynamics calculations (Table 1).
In the energy region from 600 to 1500 cm-1, both TiOBr and TiOCl show a similar highly structured broad scattering continuum, as already reported in literatureLemmens et al. (2004, 2005). The fact that the energy range of the anomalous feature is consistent with the magnetic exchange constant in TiOCl (J=660 K) suggested at first an interpretation in terms of two-magnon Raman scattering Lemmens et al. (2004). Later it was shown that the exchange constant estimated for TiOBr is considerably smaller (J=406 K) with respect to that of TiOCl while the high energy scattering stays roughly at the same frequency. Even though the authors of ref.Lemmens et al. (2005) still assigned the scattering continuum to magnon processes, it seems clear taht the considerably smaller exchange interaction in the Br compound (J=406 K) falsifies this interpretation and that magnon scattering is not at the origin of the high energy scattering of the two compounds. Furthermore, the cluster calculation (Table 6) clearly shows that no excited crystal field state is present in the energy interval considered, ruling out a possible orbital origin for the continuum. These observations are further strengthened by the observation of a similar continuum scattering in VOCl (see fig. 7(a)) which has a different magnetic and electronic nature. Therefore, the high energy scattering has most likely a vibrational origin. The lattice dynamics calculations, confirmed by the experiments, show that a ”high” energy mode (600 cm-1) of symmetry (Table 1) is expected to be Raman active in the polarization. Looking back at Fig.2, the inset shows the measurements performed with the optical axis parallel to the TiOX plane, where the expected mode is observed at 598 cm-1. The two phonon process related to this last intense mode is in the energy range of the anomalous scattering feature and has symmetry (). The nature of the anomalies observed is therefore tentatively ascribed to a multiple-phonon process. Further detailed investigations of lattice dynamics are needed to clarify this issue.
IV Conclusion
The symmetry of the different phases has been discussed on the basis of inelastic light scattering experiments. The high temperature Raman experiments are in good agreement with the prediction of the group theoretical analysis (apart from one broad mode which is ascribed to pre-transitional fluctuations). Comparing group theoretical analysis with the polarized Raman spectra clarifies the symmetry of the spin-Peierls phase and shows that the average symmetry of the incommensurate phase is different from both the high temperature and the SP phases. The conjecture that the intermediate phase is compatible with a different monoclinic symmetry (unique axis perpendicular to the TiO planes) could explain the anomalous first-order character of the transition to the spin-Peierls phase. Moreover, an anomalous behavior of the phonons characterizing the intermediate phase is interpreted as evidencing an important spin-lattice coupling. The susceptibility measurements of TiOBr show that increases with pressure, which is ascribed to the different pressure dependence of intrachain and interchain interactions. Finally, we compared the TiOX compounds with the ”isostructural” VOCl. The presence of the same anomalous high energy scattering feature in all the compounds suggests that this feature has a vibrational origin rather than a magnetic or electronic one.
Acknowledgements The authors are grateful to Maxim Mostovoy, Michiel van der Vegte, Paul de Boeij, Daniel Khomskii, Iberio Moreira and Markus Grüninger for valuable and insightful discussions. This work was partially supported by the Stichting voor Fundamenteel Onderzoek der Materie [FOM, financially supported by the Nederlandse Organisatie voor Wetenschappelijk Onderzoek (NWO)], and by the German Science Foundation (DFG).
V Appendix: Details of the spring model calculation
The spring model calculation reported in the paper, was carried out using the software for lattice-dynamical calculation UNISOFTEckold (1992) (release 3.05). In the calculations the Born-von Karman model was used; here the force constants are treated as model parameters and they are not interpreted in terms of a special interatomic potential. Only short range interactions between nearest neighbor ions are taken into account. Considering the forces to be central forces, the number of parameters is reduced to two for each atomic interaction: the longitudinal and transversal forces respectively defined as and . A custom made program was interfaced with UNISOFT to optimize the elastic constants. Our program proceeded scanning the dimensional space ( = number of parameters) with a discrete grid, to minimize the squared difference between the calculated phonon frequencies and the measured experimental frequencies for TiOBr, taken from both Raman and infrared spectroscopy. The phonon frequencies of TiOCl and VOCl were obtained using the elastic constants optimized for TiOBr and substituting the appropriate ionic masses. The optimized force constants between different atoms are reported in in the following Table.
| Number | Ions | Longitudinal (L) () | Transversal (T) () |
|---|---|---|---|
| 1 | Ti(a)-Ti(b) | 18.5 | 32.7 |
| 2 | Ti(a)-O(a) | 18.5 | 11.1 |
| 3 | Ti(a)-O(b) | 53.1 | 9.5 |
| 4 | Ti(a)-X(a) | 29.0 | 4.4 |
| 5 | O(a)-O(b) | 20.6 | 7.3 |
| 6 | X(a)-O(a) | 18.5 | 3.5 |
| 7 | X(a)-X(b) | 11.7 | 0.7 |
References
- Imada et al. (1998) M. Imada, A. Fujimori, and Y. Tokura, Rev. Mod. Phys. 70, 1039 (1998).
- Dagotto (1999) E. Dagotto, Rep. Prog. Phys. 62, 1525 (1999).
- Kataev et al. (2003) V. Kataev, J. Baier, A. Mller, L. Jongen, G. Meyer, , and A. Freimuth, Phys. Rev. B 68, 140405 (2003).
- Imai and Choub (2003) T. Imai and F. C. Choub, cond-mat 0301425 (2003), URL http://xxx.lanl.gov/abs/cond-mat/0301425.
- Maule et al. (1988) C. H. Maule, J. N. Tothill, P. Strange, and J. A. Wilson, J. Phys. C 21, 2153 (1988).
- Seidel et al. (2003) A. Seidel, C. A. Marianetti, F. C. Chou, G. Ceder, and P. A. Lee, Phys. Rev. B 67, 020405 (2003).
- Caimi et al. (2004a) G. Caimi, L. Degiorgi, P. Lemmens, and F. C. Chou, J. Phys. Cond. Mat. 16, 5583 (2004a).
- Beynon and Wilson (1993) R. J. Beynon and J. A. Wilson, J. Phys. Cond. Mat. 5, 1983 (1993).
- Caimi et al. (2004b) G. Caimi, L. Degiorgi, N. N. Kovaleva, P. Lemmens, and F. C. Chou, Phys. Rev. B 69, 125108 (2004b).
- Shaz et al. (2005) M. Shaz, S. van Smaalen, L. Palatinus, M. Hoinkis, M. Klemm, S. Horn, and R. Claessen, Phys. Rev. B 71, 100405 (2005).
- Hemberger et al. (2005) J. Hemberger, M. Hoinkis, M. Klemm, M. Sing, R. Claessen, S. Horn, and A. Loidl, Phys. Rev. B 72, 012420 (2005).
- Rckamp et al. (2005a) R. Rckamp, J. Baier, M. Kriener, M. W. Haverkort, T. Lorenz, G. S. Uhrig, L. Jongen, A. Mller, G. Meyer, and M. Grninger, Phys. Rev. Lett. 95, 097203 (2005a).
- Lemmens et al. (2004) P. Lemmens, K. Y. Choi, G. Caimi, L. Degiorgi, N. N. Kovaleva, A. Seidel, and F. C. Chou, Phys. Rev. B 70, 134429 (2004).
- Palatinus et al. (2005) L. Palatinus, A. Schoenleber, and S. van Smaalen, Acta Crystallogr. Sect. C 61, 148 (2005).
- van Smaalen et al. (2005) S. van Smaalen, L. Palatinus, and A. Schoenleber, Phys. Rev. B 72, 020105(R) (2005).
- Schoenleber et al. (2006) A. Schoenleber, S. van Smaalen, and L. Palatinus, Phys. Rev. B 73, 214410 (2006).
- Krimmel et al. (2006) A. Krimmel, J. Strempfer, B. Bohnenbuck, B. Keimer, M. Hoinkis, M. Klemm, S. Horn, A. Loidl, M. Sing, R. Claessen, et al., Phys. Rev. B 73, 172413 (2006).
- Kuntscher et al. (2006) C. A. Kuntscher, S. Frank, A. Pashkin, M. Hoinkis, M. Klemm, M. Sing, S. Horn, and R. Claessen, Phys. Rev. B 74, 184402 (2006).
- Lemmens et al. (2005) P. Lemmens, K. Y. Choi, R. Valenti, T. Saha-Dasgupta, E. Abel, Y. S. Lee, and F. C. Chou, New Journal of Pysics 7, 74 (2005).
- Rousseau et al. (1981) D. L. Rousseau, R. P. Bauman, and S. P. S. Porto, Journal of Raman Spectroscopy 10, 253 (1981).
- Sasaki et al. (2006) T. Sasaki, T. Nagai, K. Kato, M. Mizumaki, T. Asaka, M. Takata, Y. Matsui, H. Sawa, and J. Akimitsu, Sci. Tech. Adv. Mat. 7, 17 (2006).
- Baker et al. (2007) P. J. Baker, S. J. Blundell, F. L. Pratt, T. Lancaster, M. L. Brooks, W. Hayes, M. Isobe, Y. Ueda, M. Hoinkis, M. Sing, et al., Phys. Rev. B 75, 094404 (2007).
- Macovez (2007) R. Macovez (2007), unpublished.
- Noodleman and Norman (1979) L. Noodleman and J. G. Norman, J. Chem. Phys. 70, 4903 (1979).
- (25) M. J. F. et al., Gaussian 03, revision c.02, gaussian, Inc., Wallingford, CT, 2004.
- Becke (1993) A. D. Becke, J. Chem. Phys. 98, 5648 (1993).
- Rckamp et al. (2005b) R. Rckamp, E. Benckiser, M. W. Haverkort, H. Roth, T. Lorenz, A. Freimuth, L. Jongen, A. Mller, G. Meyer, P. Reutler, et al., New Journal of Physics 7, 1367 (2005b).
- Zakharov et al. (2006) D. V. Zakharov, J. Deisenhofer, H. A. K. von Nidda, P. Lunkenheimer, J. Hemberger, M. Hoinkis, M. Klemm, M. Sing, R. Claessen, M. V. Eremin, et al., Phys. Rev. B 73, 094452 (2006).
- Karlstro et al. (2003) G. Karlstro, R. Lindh, P. Malmqvist, B. Roos, U. Ryde, V. Veryazov, P. Widmark, M. Cossi, B. Schimmelpfennig, P. Neogrady, et al., Comput. Mater. Sci. 28, 222 (2003).
- Wiedenmann et al. (1984) A. Wiedenmann, J. R. Mignod, J. P. Venien, and P. Palvadeau, JMMM 45, 275 (1984).
- Eckold (1992) G. Eckold, UNISOFT - A Program Package for Lattice Dynamical Calculations: Users Manual (1992).