The Majority Can Help the Minority:
Context-rich Minority Oversampling for Long-tailed Classification
Abstract
The problem of class imbalanced data is that the generalization performance of the classifier deteriorates due to the lack of data from minority classes. In this paper, we propose a novel minority over-sampling method to augment diversified minority samples by leveraging the rich context of the majority classes as background images. To diversify the minority samples, our key idea is to paste an image from a minority class onto rich-context images from a majority class, using them as background images. Our method is simple and can be easily combined with the existing long-tailed recognition methods. We empirically prove the effectiveness of the proposed oversampling method through extensive experiments and ablation studies. Without any architectural changes or complex algorithms, our method achieves state-of-the-art performance on various long-tailed classification benchmarks. Our code is made available at https://github.com/naver-ai/cmo.
1 Introduction
Real-world data are likely to be inherently imbalanced [33, 32, 14, 21], where the number of samples per class differs greatly. If models are trained on an imbalanced dataset, they can be easily biased toward majority classes and tend to have a poor generalization ability on recognizing minority classes (i.e., overfitting).
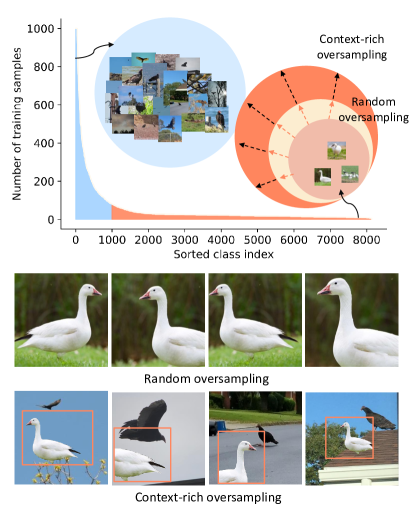
A simple and straightforward method to overcome the class imbalance problem is to repeatedly oversample the minority classes [6, 47]. However, these naive oversampling can intensify the overfitting problem, since the repeatedly selected samples have less diversity but almost similar image contexts [42]. For example, consider a minority class of ‘snow goose,’ in which the geese always stand upon grass in the training images. If samples are drawn from these limited training samples [47] or even if new samples are produced by interpolating within the class [6], only context-limited images will be created as in Figure 1. Our goal is to solve the aforementioned problem by introducing a simple context-rich oversampling method.
We pay attention to the characteristics of long-tailed distributions; that is, majority class samples are data-rich and information-rich. Unlike the existing re-sampling methods that ignore (i.e., undersample) majority samples, our method uses the affluent information of the majority samples to generate new minority samples. Specifically, our idea is to leverage the rich major-class images as the background for the newly created minor-class images. Figure 1 illustrates the concept of our proposed context-rich oversampling strategy. Given an original image from a minority class, the object is cropped in various sizes and pasted onto the various images from majority classes. Then, we can create images with more diverse contexts (e.g., ‘snow goose’ images with the sky, road, roof, crows, etc). Since this is an interpolation of the majority and minority class samples, it generates diversified data around the decision boundary, and as a result, it improves the generalization performance for minority classes.
To this end, we adopt an image-mixing data augmentation method, CutMix [52]. As our key idea is to transfer rich contexts from majority to minority samples, we apply a simple and effective data sampling method to generate new minority-centric images with majority’s contexts. However, naive use of CutMix may exacerbate the overfitting problem in favor of the majority classes because it may generate more majority-centric samples than minority samples. We solve this problem by sampling the background images and the foreground patches from different distributions to achieve the desired minority oversampling.
Our key contributions can be summarized as follows: (1) We propose a novel context-rich minority oversampling method that generates various samples by leveraging the rich context of the majority classes as background images. (2) Our method requires little additional computational cost and can be easily integrated into many end-to-end deep learning algorithms for long-tailed recognition. (3) We demonstrate that significant performance improvements and state-of-the-art performance can be achieved by applying the proposed oversampling to existing commonly used loss functions without any architectural changes or complex algorithms. (4) We empirically prove the effectiveness of the proposed oversampling method through extensive experiments and ablation studies. We believe that our study offers a useful and universal minority oversampling method for research into long-tailed classification.
2 Related Work
2.1 Long-tailed Recognition
Re-weighting methods. Re-weighting aims to assign different weights to training samples to adjust their importance either at the class level or at the instance level. Class-level re-weighting methods include re-weighting samples by inverse class frequency [22, 51], Class-balanced loss [12], LDAM loss [5], Balanced Softmax [40], LADE loss [20]. Instance-level re-weighting methods include focal loss [31] and influence-balanced loss [38].
Re-sampling methods. Resampling methods aim to modify the training distributions to decrease the level of imbalance [23]. Resampling methods include undersampling and oversampling. Undersampling methods [55, 47] that discard the majority samples can lose valuable information, and undersampling is infeasible when the imbalance between classes is too high. The simplest form of oversampling is random oversampling (ROS) [47, 3], which oversamples all minority classes until class balance is achieved. This method is simple and can be easily used in any algorithm, but since the same sample is repeatedly drawn, it can lead to overfitting [42]. As a more advanced method, the synthetic minority over-sampling technique (SMOTE) [6], which oversamples minority samples by interpolating between existing minority samples and their nearest minority neighbors, was proposed. Following the success of SMOTE, several variants have been developed: Borderline-SMOTE [17], which oversamples the minority samples near class borders, and Safe-level-SMOTE [4], which defines safe regions not to oversample samples from different classes. These methods have been widely used by classical machine learning algorithms, but there are difficulties in using them for large-scale image datasets due to the high computational complexity of calculating the K-Nearest Neighbor for every sample. Generative adversarial minority oversampling (GAMO) [37] solves this issue by producing new minority samples by training a convex generator, inspired by the success of generative adversarial networks (GANs) [15] in image generation. However, training the generator incurs high additional training cost; moreover, GAMO can suffer from the infamous mode collapse of GANs [2]. To generate diverse minority data, recent works [27, 28] have proposed adversarial augmentations by adding small noise to the input images. To this end, Major-to-minor Translation (M2m) [27] transfers knowledge from majority classes using a pre-trained network, and Balancing Long-Tailed datasets (BLT) [28] uses a gradient-ascent image generator based on the confusion matrix.
Another recent line of research is oversampling in the feature space rather than in the input space: Deep Over-sampling (DOS) [1], Feature-space Augmentation (FSA)[8], and Meta Semantic Augmentation (MetaSAug) [30]. These methods aim to augment minority classes in the feature space by sampling from the in-class neighbors in the linear subspace [1], using learned features from pretrained networks [8], or using an implicit semantic data augmentation (ISDA) algorithm [50]. However, DOS [1] requires finding the nearest neighbors in the feature space, FSA [8] requires a pre-trained feature sub-network and a classifier for feature augmentation procedure. Lastly, MetaSAug [30] demands additional uniform validation samples that outnumber the number of samples in the tail classes and hundreds and thousands of iterations for training. Consequently, these methods are less cost-efficient and technically more difficult to perform. On the other hand, our method oversamples diverse minority samples using a simple data augmentation technique and outperforms all previous methods while maintaining reasonable training costs.
Other long-tailed methods. Recently, significant improvement has been achieved by two-stage algorithms: Deferred re-weighting (DRW) [5], classifier re-training (cRT), learnable weight scaling (LWS) [25], and the Mixup shifted label-aware smoothing model (MiSLAS) [56]. Meanwhile, a bilateral branch network (BBN) [57] uses an additional network branch for re-balancing, and RIDE [49] uses multiple branches called experts, each of which learns to specialize in different classes. Another line of recent research employs meta-learning methods: Meta-Weight-Net [43] learns an explicit loss-weight function, and a meta sampler [40] estimates the optimal class sample rate. PaCo [11] proposes supervised contrastive learning with parametric class-wise centers for long-tailed classification.
2.2 Data Augmentation and Mixup Methods
Spatial-level augmentation methods have performed satisfactorily in the computer vision fields. Cutout [13] removes random regions whereas CutMix [52] fills the removed regions with patches from another training image. In addition, mixup methods [54, 48, 44] linearly interpolate two images in a training dataset. Since the data augmentation method is closely related to the oversampling methods, some recent long-tailed recognition methods have used the mixup method. Zhou et al. [57] use the mixup as a baseline method, and MiSLAS [56] uses mixup in its Stage-1 training. However, these methods apply mixup without any adjustments, and little work has been done to explore appropriate data augmentation techniques for a long-tailed dataset. Recently, for an imbalanced dataset, the Remix [7] assigned a label in favor of the minority classes when mixing two samples. Unlike these methods, our method samples images from different distributions, which takes into account the specificity of long-tailed data distribution.
3 Context-rich Minority Oversampling
3.1 Algorithm
We propose a new oversampling method called Context-rich Minority Oversampling (CMO). CMO utilizes the contexts of the majority samples to diversify the limited context of the minority samples. As shown in the Figure 1, the background images are sampled from majority classes and combined with foreground images of minority classes. Let and denote a training image and its label, respectively. We aim to generate a new sample by combining two training samples and . Here, the image is used as a background image, and the image provides the foreground patch to be pasted onto .
For the image combining method, we chose CutMix [52] data augmentation due to its simplicity and effectiveness. Following CutMix [52] settings, the image and label pairs are augmented as
| (1) |
where denotes a binary mask indicating where to select the patch and paste it onto a background image. 1 means a binary mask filled with ones, and is element-wise multiplication. The combination ratio between two images is sampled from the beta distribution . To sample the mask and its coordinates, we apply the original CutMix [52] setting. An experiment on using a different is included in the Supplementary Material.
Since CutMix was originally designed for data augmentation on a class-balanced dataset, Eq. 1 does not represent the majority or minority class of samples. To change the method to CMO, we include sampling data distributions for foreground and background samples . In our design, the background samples should be biased to the majority classes. Therefore, we sample the background samples from the original data distribution . Meanwhile, the foreground samples are sampled from minor-class-weighted distribution to be biased to the minority classes. In short, CMO consists of data sampling from two distributions, and , and combining the images using Eq. 1. The pseudo-code of the training procedure is presented in Algorithm 1.
3.2 Minor-class-weighted Distribution
To sample the foreground image from minority classes, we design the minor-class-weighted distribution by utilizing the re-weighting methods. The re-weighting approach, dating back to the classical importance sampling method [24], provided a way to assign appropriate weights to samples. Commonly used sampling strategies include ones that assign a weight inversely proportional to the class frequency [22, 51], to the smoothed class frequency [36, 35], or to the effective number [12].
Let be the number of samples in the -th class, then for the classes, the total number of samples is . Then, the generalized sampling probability for the -th class can be defined by
| (2) |
where the -th class has a sampling weight inversely proportional to . As increases, the weight of the minor class becomes increasingly larger than that of the major class. By adjusting the value of , we can examine diverse sampling strategies. Setting uses the inverse class frequency [22, 51] while setting uses the smoothed inverse class frequency, as in [36, 35]. We can also use the effective number [12] instead of , which is defined as
| (3) |
where . Since CMO is a new approach for long-tailed classification, it is hard to predict the performance of each sampling strategy for CMO. Therefore, we evaluate the different sampling strategies on the long-tailed CIFAR-100 [29] and select the best strategy for the minor-class-weighted distribution . The experimental results are displayed in Table 10 of the experimental section.
3.3 Regularization Effect of CMO
A recent study [56] has reported that models trained on long-tailed datasets are more over-confident than the models trained on balanced data. In addition, the study reveals that the long-tailed classification accuracy can be improved by solving the over-confidence issue. Moreover, CMO can be interpreted as a way to mitigate over-confidence in long-tailed classification. Inherited from CutMix, CMO uses a soft-target label , as in Eq. 1. The soft-target label penalizes over-confident outputs, similarly to the label smoothing regularization [45]. Therefore, we argue that CMO contributes not only to minority sample generation but also to mitigating the over-confidence, which both enable an impressive performance improvement in diverse long-tail settings. We will demonstrate the effectiveness of CMO through various experiments in the experimental section.
4 Experiments
We present experiments on and analyses of CMO in this section. We first describe our experimental settings and implementation details in Section 4.1. Next, we present the effectiveness of CMO using three long-tailed classification benchmarks: CIFAR-100-LT, ImageNet-LT, and iNaturalist. CMO consistently boosts the performance of these baselines with state-of-the-art accuracy (Section 4.2). In Section 4.3 we present in-depth analyses of CMO to study its inherent characteristics.
4.1 Experimental Settings
Datasets. We validate CMO on the most commonly used long-tailed recognition benchmark datasets: CIFAR-100-LT[5], ImageNet-LT [34], and iNaturalist 2018 [21] (see Table 1). CIFAR-100-LT and ImageNet-LT are artificially made imbalanced from their balanced versions (CIFAR-100 [29] and ImageNet-2012 [41]). The iNaturalist 2018 dataset is a large-scale real-world dataset that exhibits long-tailed imbalance. We used the official training and test splits in our experiments.
| Dataset | # of classes | # of training | Imbalance ratio |
|---|---|---|---|
| CIFAR-100-LT | 100 | 50K | {10, 50, 100} |
| ImageNet-LT | 1,000 | 115.8K | 256 |
| iNaturalist 2018 | 8,142 | 437.5K | 500 |
Evaluation Metrics. Performances is mainly reported as the overall top-1 accuracy. Following [34], we also report the accuracy of three disjoint subsets: Many-shot classes (classes that contain more than 100 training samples), medium-shot classes (classes that contain 20 to 100 samples), and few-shot classes (classes that contain under 20 samples).
Comparison methods. We compare CMO with the minority oversampling methods, the state-of-the-art long-tail recognition methods, and their combinations.
-
•
Minority oversampling. (1) No oversampling (vanilla); (2) Random oversampling (ROS) [47], that oversamples minority samples to balance the classes in the training data; (3) Remix [7], which oversamples minority classes by assigning higher weights to the minority labels when using Mixup [54]; (4) Feature space augmentation (FSA) [8].
-
•
Re-weighting. (5) label-distribution-aware margin (LDAM) loss [5], which regularizes the minority classes to increase margins to the decision boundary; (6) influence-balanced (IB) loss [38], which re-weights samples by their influences; (7) Balanced Softmax [40], an unbiased extension of Softmax; (8) LADE [20], which disentangles the source label distribution from the model prediction.
-
•
Other state-of-the-art methods. (9) Deferred re-weighting (DRW) [5] and (10) Decouple [25] are two-stage algorithms that re-balance the classifiers during fine-tuning; (11) BBN [57] and (12) RIDE [49] use additional network branches to handle class imbalance; (13) Causal Norm [46], which disentangles causal effects and adjusts the effects in training; (14) MiSLAS [56], a two-stage algorithm, enhances classifier learning and calibration with label-aware smoothing (LAS) in stage-2.
Implementation. We use PyTorch [39] for all experiments. For the CIFAR datasets, we use ResNet-32 [18]. The networks are trained for 200 epochs following the training strategy in [5]. For ImageNet-LT, we use ResNet-50 as the backbone network. The network is trained for 100 epochs using an initial learning rate of 0.1. The learning rate is decayed at the 60th and 80th epochs by 0.1. For iNaturalist 2018, we use ResNet-{50, 101, 152} and Wide ResNet-50 [53]. We train the networks for 200 epochs using an initial learning rate of 0.1, and decay the learning rate at epochs 75 and 160 by 0.1. All experiments are trained with stochastic gradient descent (SGD) with a momentum of .
4.2 Long-tailed classification benchmarks
4.2.1 CIFAR-100-LT
We conduct experiments on CIFAR-100-LT using different imbalance ratios: 10, 50, 100. We apply CMO to various methods to verify its effectiveness on different algorithms: vanilla cross-entropy loss, class-reweighting loss (LDAM [5]), a two-stage algorithm (DRW [5]), and multi-branch architecture (RIDE [49]).
Comparison with state-of-the-art methods. The overall classification accuracies are displayed in Table 2. It is surprising that CMO with basic cross-entropy (CE) loss shows comparable performance to that of complex long-tail recognition methods. Moreover, applying CMO to the state-of-the-art model (i.e., RIDE) further boosts the performance markedly, especially when the imbalance ratios are high as 50 and 100.
| Imbalance ratio | 100 | 50 | 10 |
|---|---|---|---|
| Cross Entropy (CE) | 38.6 | 44.0 | 56.4 |
| CE-DRW | 41.1 | 45.6 | 57.9 |
| LDAM-DRW [5] | 41.7 | 47.9 | 57.3 |
| BBN [57]† | 42.6 | 47.1 | 59.2 |
| Causal Norm [46]† | 44.1 | 50.3 | 59.6 |
| IB Loss [38]∗ | 45.0 | 48.9 | 58.0 |
| Balanced Softmax (BS) [40]† | 45.1 | 49.9 | 61.6 |
| LADE [20]† | 45.4 | 50.5 | 61.7 |
| Remix [7] | 45.8 | 49.5 | 59.2 |
| RIDE (3 experts) [49] | 48.6 | 51.4 | 59.8 |
| MiSLAS [56]∗ | 47.0 | 52.3 | 63.2 |
| CE + CMO | 43.9 | 48.3 | 59.5 |
| CE-DRW + CMO | 47.0 | 50.9 | 61.7 |
| LDAM-DRW + CMO | 47.2 | 51.7 | 58.4 |
| BS + CMO | 46.6 | 51.4 | 62.3 |
| RIDE (3 experts) + CMO | 50.0 | 53.0 | 60.2 |
| Vanilla | +ROS [47] | +Remix [7] | +CMO | |||||||||
|---|---|---|---|---|---|---|---|---|---|---|---|---|
| CE |
|
|
|
|
||||||||
| CE-DRW [5] |
|
|
|
|
||||||||
| LDAM-DRW [5] |
|
|
|
|
||||||||
| RIDE [49] |
|
|
|
|
Comparison with oversampling methods. We further compare the performance improvement of CMO with that of other oversampling techniques when combined with long-tailed recognition methods (see Table 3). The results reveal that CMO consistently improves the performance of all long-tailed recognition methods. On the other hand, simply balancing the class distribution with ROS [47] severely degrades performance. We speculate that this is because the naive balancing of the sampling distribution across classes hinders the model from learning generalized features for major classes and induces the model to memorize the minor class samples. Remix [7] improves the performance of some methods but degrades the performance when combined with RIDE [49]. This indicates that the simple labeling policy of Remix may not be effective when the model complexity becomes large, as in RIDE.
4.2.2 ImageNet-LT
Comparison with state-of-the-art methods.
The results of our method and other long-tailed recognition methods are displayed in Table 4.
Applying CMO to the basic training with CE loss improves the performance by a significant margin, outperforming most of the recent baselines.
The greater performance improvement on ImageNet-LT compared to CIFAR-100 indicates that our method benefits from the richer context information available in the major classes of ImageNet-LT.
In addition, a consistent performance improvement by using CMO when combined with DRW or BS bolsters the efficacy of CMO, which can be easily integrated into modern state-of-the-art long-tailed recognition methods.
It is noteworthy that as {CE-DRW + CMO } and {BS + CMO } especially achieve a much higher few-shot class accuracy than did the other methods, our method is useful for achieving consistent performance across classes.
Lastly, applying CMO to RIDE further boosts performance, outperforming the results of RIDE with four experts.
| All | Many | Med | Few | |
| Cross Entropy (CE)† | 41.6 | 64.0 | 33.8 | 5.8 |
| Decouple-cRT [25]† | 47.3 | 58.8 | 44.0 | 26.1 |
| Decouple-LWS [25]† | 47.7 | 57.1 | 45.2 | 29.3 |
| Remix [7] | 48.6 | 60.4 | 46.9 | 30.7 |
| LDAM-DRW [5] | 49.8 | 60.4 | 46.9 | 30.7 |
| CE-DRW | 50.1 | 61.7 | 47.3 | 28.8 |
| Balanced Softmax (BS) [40] | 51.0 | 60.9 | 48.8 | 32.1 |
| Causal Norm [46]∗ | 51.8 | 62.7 | 48.8 | 31.6 |
| RIDE (3 experts) [49]∗ | 54.9 | 66.2 | 51.7 | 34.9 |
| RIDE (4 experts) [49]∗ | 55.4 | 66.2 | 52.3 | 36.5 |
| CE + CMO | 49.1 | 67.0 | 42.3 | 20.5 |
| CE-DRW + CMO | 51.4 | 60.8 | 48.6 | 35.5 |
| LDAM-DRW + CMO | 51.1 | 62.0 | 47.4 | 30.8 |
| BS + CMO | 52.3 | 62.0 | 49.1 | 36.7 |
| RIDE (3 experts) + CMO | 56.2 | 66.4 | 53.9 | 35.6 |
Comparison with oversampling methods. In Table 5, we compare performance improvement using other oversampling techniques. While CMO consistently improves performance for all methods, Remix [7] fails to improve the performance of the long-tailed recognition methods and barely improves the model trained with cross-entropy loss. This implies that the labeling strategy of Remix is not sufficient to compensate for the adverse effect of using the same original distribution as the two sampling distributions of the mixup method, especially when the imbalance ratio rises severly to 256, as with ImageNet-LT. In contrast, CMO generates more minority samples by using different distributions when selecting two images and produces much better classification accuracy on all tasks.
| Vanilla | +Remix [7] | +CMO | |||||||
|---|---|---|---|---|---|---|---|---|---|
| CE |
|
|
|
||||||
| CE-DRW [5] |
|
|
|
||||||
| Balanced Softmax [40] |
|
|
|
Results on longer training epochs. Recently, PaCo [11] performed impressively by using supervised contrastive learning. Since contrastive learning requires diverse augmentation strategies and longer training times, PaCo trained networks for 400 epochs using RandAugment [10]. Since CMO should also improve using longer training epochs, we evaluate CMO using the same setting from PaCo (i.e., 400 epochs & RandAug). Table 6 reveals that {BS + CMO } achieves a new state-of-the-art performance. It is noteworthy that applying CMO significantly surpasses the two baselines, especially in the few-shot classes. On top of its simplicity and much lower computational cost, the results demonstrate the effectiveness of the proposed method. The results on CIFAR-100-LT and iNaturalist 2018 are included in the Supplementary Material.
| All | Many | Med | Few | |
|---|---|---|---|---|
| BS∗ | 55.0 | 66.7 | 52.9 | 33.0 |
| PaCo [11]∗ | 57.0 | 65.0 | 55.7 | 38.2 |
| BS + CMO | 58.0 | 67.0 | 55.0 | 44.2 |
| All | Many | Med | Few | |
| Cross Entropy (CE) | 61.0 | 73.9 | 63.5 | 55.5 |
| IB Loss [38]∗ | 65.4 | - | - | - |
| FSA [8]∗ | 65.9 | - | - | - |
| LDAM-DRW [5]† | 66.1 | - | - | - |
| Decouple-cRT [25]∗ | 68.2 | 73.2 | 68.8 | 66.1 |
| Decouple-LWS [25]∗ | 69.5 | 71.0 | 69.8 | 68.8 |
| BBN [57]∗ | 69.6 | - | - | - |
| Balanced Softmax [40] | 70.0 | 70.0 | 70.2 | 69.9 |
| LADE [20]∗ | 70.0 | - | - | - |
| Remix [7]∗ | 70.5 | - | - | - |
| MiSLAS [56]∗ | 71.6 | 73.2 | 72.4 | 70.4 |
| RIDE (3 experts) [49]∗ | 72.2 | 70.2 | 72.2 | 72.7 |
| RIDE (4 experts) [49]∗ | 72.6 | 70.9 | 72.4 | 73.1 |
| CE + CMO | 68.9 | 76.9 | 69.3 | 66.6 |
| CE-DRW + CMO | 70.9 | 68.2 | 70.2 | 72.2 |
| LDAM-DRW + CMO | 69.1 | 75.3 | 69.5 | 67.3 |
| BS + CMO | 70.9 | 68.8 | 70.0 | 72.3 |
| CE-DRW + CMO + LAS [56] | 71.8 | 69.6 | 72.1 | 71.9 |
| RIDE (3 experts) + CMO | 72.8 | 68.7 | 72.6 | 73.1 |
4.2.3 iNaturalist 2018
Comparison with state-of-the-art methods.
Table 7 presents the classification results.
On the naturally-skewed dataset, applying CMO to the simple training scheme of CE-DRW surpasses most of the state-of-the-arts.
On iNaturalist 2018, as in ImageNet-LT, CMO dramatically improves the performance of the cross-entropy loss (CE) by 7.9%p ( increased to ).
This is because the sample generation by CMO fully utilizes the abundant context of training data.
Again, it achieves a remarkable performance improvement in the few-shot classes.
It is moreover noteworthy that when we apply the same stage-2 strategy, LAS, from [56], it further boosts performance.
Lastly, applying CMO to RIDE achieves a new state-of-the-art performance.
Results on large models. We investigate the performance of CMO and other oversampling methods using the large deep networks of Wide ResNet-50 [53], ResNet-101, and ResNet-152 [18]. We compare CMO with the feature space augmentation method (FSA) [8]. While both methods improve the results from vanilla training with cross-entropy loss, our method provides superior performance to that of FSA. This indicates that using the context-rich information from majority classes in the input space is simple but effective in improving the overall performance.
| Method | ResNet-50 | Wide ResNet-50 | ResNet-101 | ResNet-152 |
|---|---|---|---|---|
| CE | 61.0 | - | 65.2 | 66.2 |
| FSA [8] | 65.9 | - | 68.4 | 69.1 |
| CMO | 70.9 | 71.9 | 72.4 | 72.6 |
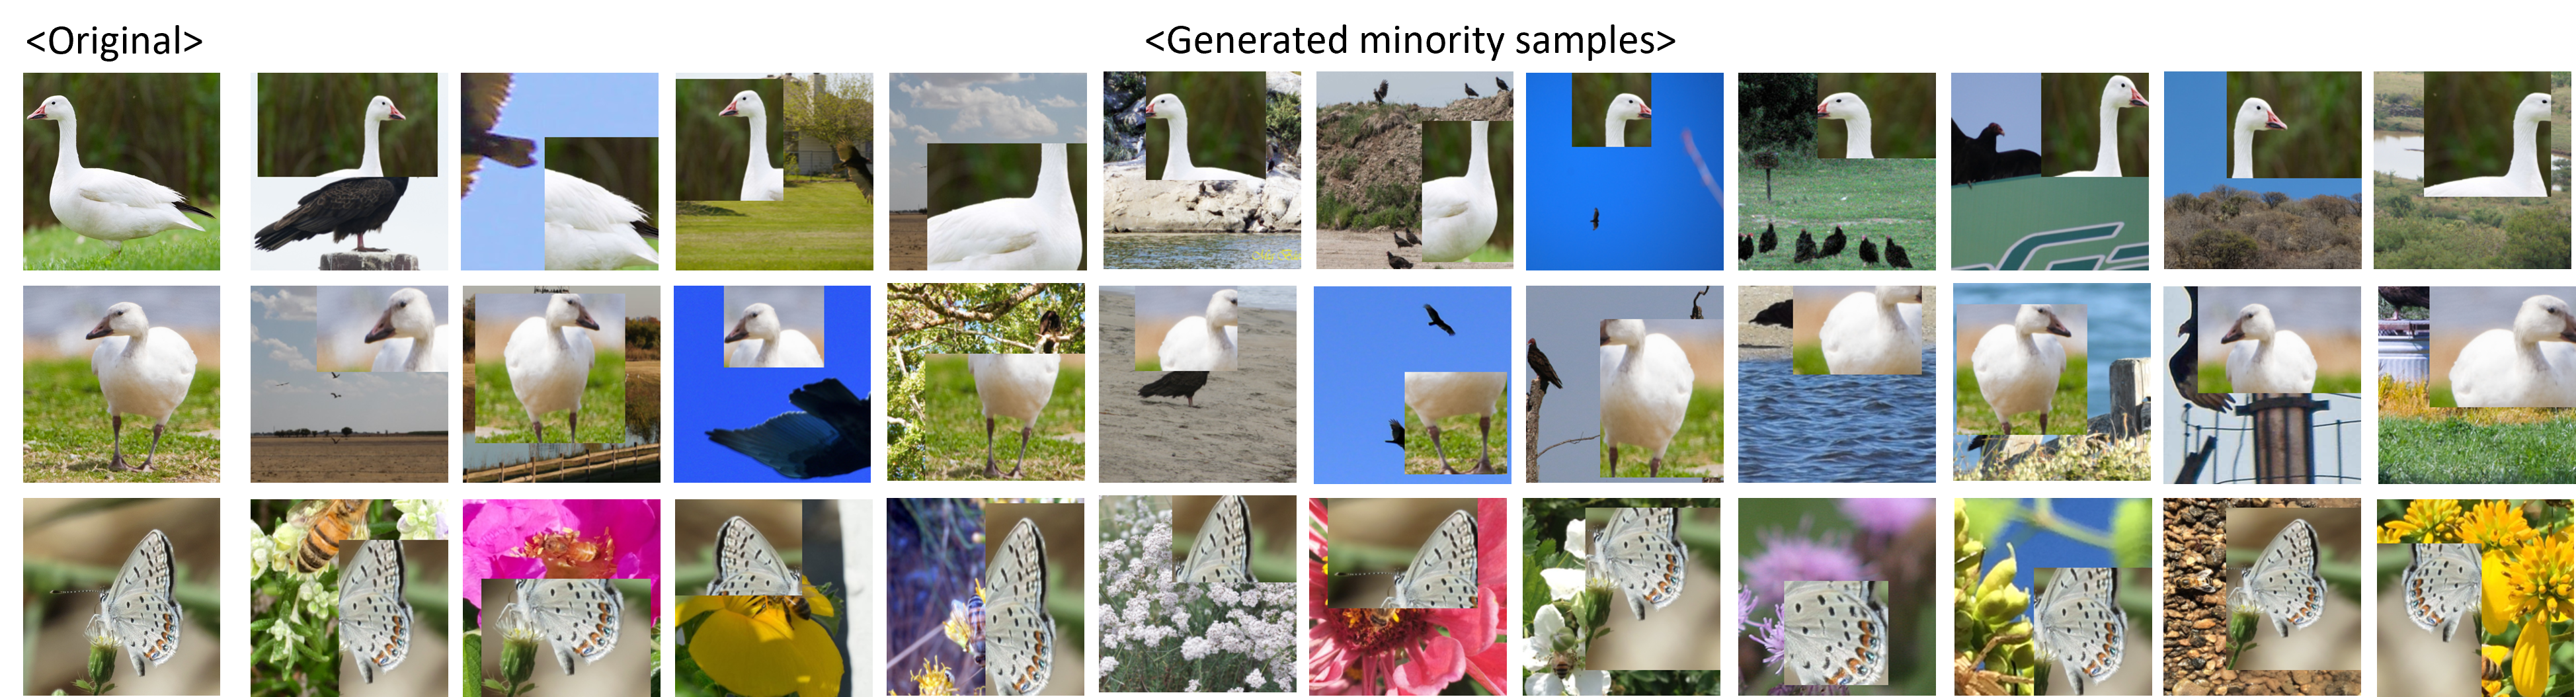
Display of the generated images. We visualize the generated images for the minority classes in Figure 2. From the rarest minority classes, we randomly choose generated images for each original image. CMO produces diverse minority samples that have various contexts. For example, while the ‘snow goose’ class contains only images of geese on grass, the generated images have various contexts, such as the sky or sea. Likewise, the butterflies in the third row are newly created as diverse images that have various contexts, containing bees and flowers of various colors and shapes. We argue that various combinations of context and minority samples encourage the model to learn a robust representation of the minority classes.
4.3 Analysis
Is the distribution for augmenting images important?
To justify the need for different distributions of background and foreground images, we compare CutMix and CMO.
As can be seen from Table 9, CMO outperforms CutMix on long-tailed classification by a large margin.
In particular, there is a remarkable performance improvement in the medium and few-shot classes.
The performance gap is due to the absence of a minor-class-weighted distribution in CutMix augmentation.
Although CutMix can generate informative mixed samples, its effect is limited when used with long-tailed distributions.
Thus, we claim that the use of a minor-class-weighted distribution is a key-point in data augmentation in the long-tailed settings; this highlights the contribution and originality of CMO.
| All | Many | Med | Few | |
|---|---|---|---|---|
| CIFAR-100-LT | ||||
| CutMix | 35.6 | 71.0 | 37.9 | 4.9 |
| CMO | 43.9 | 70.4 | 42.5 | 14.4 |
| ImageNet-LT | ||||
| CutMix | 45.5 | 68.6 | 38.1 | 8.1 |
| CMO | 49.1 | 67.0 | 42.3 | 20.5 |
How to choose the appropriate probability distribution . We evaluate different sampling strategies in Section 3.2 on CIFAR-100 with the imbalance ratio 100, The results are reported in Table 10. displays the most balanced performance. This result is consistent with the common practice of balancing the dataset by assigning weights inversely proportional to the class frequency. While , which imposes a higher probability on the minority class than does , performs acceptably in the few-shot classes, the overall performance slightly deteriorates. We assume this is because we cannot sample more diverse images when imposing too high probabilities on the few-shot classes. Based on this result, we set as in our all experiments.
| All | Many | Med | Few | |
|---|---|---|---|---|
| 42.6 | 71.6 | 42.1 | 9.5 | |
| 43.9 | 70.4 | 42.5 | 14.4 | |
| 40.1 | 67.2 | 36.7 | 12.3 | |
| [12] | 39.5 | 70.4 | 38.0 | 4.7 |
Why should we oversample only for the foreground samples? One may wonder why oversampling only for the foreground samples is better than oversampling both patches and background samples or oversampling only the backgrounds. To verify our design choice, we evaluate two variants of CMO. The first variant, CMO back, samples background images from a minor-class-weighted distribution and patches from the original distribution, which is exactly the opposite design of CMO, i.e., . The second variant, CMO minor, samples both the background and the patches from a minor-class-weighted distribution, i.e., . We report the results of applying these variants of the CMO method to the model trained with CE loss and LDAM loss [5] in Table 11.
| All | Many | Med | Few | |
|---|---|---|---|---|
| Cross Entropy (CE) | 38.6 | 65.3 | 37.6 | 8.7 |
| CE + CMO minor | 37.9 | 58.3 | 40.4 | 11.2 |
| CE + CMO back | 40.1 | 64.7 | 40.2 | 11.3 |
| CE + CMO | 43.9 | 70.4 | 42.5 | 14.4 |
| LDAM [5] | 41.7 | 61.4 | 42.2 | 18.0 |
| LDAM + CMO minor | 31.7 | 50.2 | 33.2 | 8.4 |
| LDAM + CMO back | 44.2 | 59.2 | 46.6 | 24.0 |
| LDAM + CMO | 47.2 | 61.5 | 48.6 | 28.8 |
CMO minor yields severe performance degradation using both methods.
We suspect that this is because the rich context of the majority samples cannot be utilized.
In contrast, CMO back produces acceptable performance improvements, but far less than did the original CMO.
This is because, using the CutMix method, there is a high probability that the object in the foreground image overlaps the background image.
Therefore, we can expect a loss of information about minority classes in the background image, resulting in a limited performance boost.
Comparison with other minority augmentations. To further verify our design choice, we analyze the effectiveness of using different augmentation methods, including CutMix [52], Mixup [54], color jitter, and Gaussian blur. For Mixup, we use the same sampling strategy as for CMO. For color jitter and Gaussian blur, which do not interpolate two images, we apply augmentation only to the minority classes and oversample those classes. As evidenced in Table 12, other augmentation methods provide little performance gain compared to the gains using CutMix. We suspect that this is because the pixel-level transformations (i.e., Gaussian blur and color jitter) are not effective in producing minority samples that have a rich context. Gaussian blur and color jitter do not combine two images; thus, it is hard to add a new context to minority samples. While Mixup combines two images, it does not distinguish the roles of the two samples, limiting the control of the source of the context and of the patch information. In contrast, CutMix can create diverse images with larger changes at pixel-level than can other methods.
| All | Many | Med | Few | |
|---|---|---|---|---|
| CMO w/ Gaussian Blur | 31.1 | 54.7 | 28.8 | 6.2 |
| CMO w/ Color Jitter | 34.7 | 58.9 | 34.4 | 6.8 |
| CMO w/ Mixup | 38.0 | 54.8 | 40.2 | 15.9 |
| CMO w/ CutMix | 43.9 | 70.4 | 42.5 | 14.4 |
5 Conclusion
We have proposed a novel context-rich oversampling method, CMO, to solve the data imbalance problem. We tackle the fundamental problem of previous oversampling methods that generate context-limited minority samples, which intensifies the overfitting problem. Our key idea is to transfer the rich contexts of majority samples to minority samples to augment minority samples. The implementation of CMO is simple and intuitive. Extensive experiments on various benchmark datasets demonstrate not only that our CMO significantly improves performance, but also that adding our oversampling method to the basic losses advances the state-of-the-art.
Limitations. In some cases, the performance improvement for the minority classes occurs with the degraded performance of the majority classes. Future work should be designed to improve the performance of all classes without sacrificing the performance of the many-shot classes.
Potential negative societal impact. Since our method creates new samples, it benefits more from longer training and deeper architectures. Thus, it may lead to more computations, which has a risk that the use of GPUs for machine learning could accelerate environmental degradation [19].
Acknowledgement This work was partially supported by IITP grant from Korea government (MSIT) [No.B0101-15-0266, High Performance Visual BigData Discovery Platform; NO.2021-0-01343, AI Graduate School Program (SNU)]
References
- [1] Shin Ando and Chun Yuan Huang. Deep over-sampling framework for classifying imbalanced data. In Joint European Conference on Machine Learning and Knowledge Discovery in Databases, 2017.
- [2] David Bau, Jun-Yan Zhu, Jonas Wulff, William Peebles, Hendrik Strobelt, Bolei Zhou, and Antonio Torralba. Seeing what a gan cannot generate. In Proceedings of the IEEE/CVF International Conference on Computer Vision (ICCV), 2019.
- [3] Mateusz Buda, Atsuto Maki, and Maciej A. Mazurowski. A systematic study of the class imbalance problem in convolutional neural networks. Neural Networks, 106, 2018.
- [4] Chumphol Bunkhumpornpat, Krung Sinapiromsaran, and Chidchanok Lursinsap. Safe-level-smote: Safe-level-synthetic minority over-sampling technique for handling the class imbalanced problem. In Thanaruk Theeramunkong, Boonserm Kijsirikul, Nick Cercone, and Tu-Bao Ho, editors, Advances in Knowledge Discovery and Data Mining, 2009.
- [5] Kaidi Cao, Colin Wei, Adrien Gaidon, Nikos Arechiga, and Tengyu Ma. Learning imbalanced datasets with label-distribution-aware margin loss. In Advances in Neural Information Processing Systems, 2019.
- [6] Nitesh V. Chawla, Kevin W. Bowyer, Lawrence O. Hall, and W. Philip Kegelmeyer. Smote: Synthetic minority over-sampling technique. J. Artif. Int. Res., 2002.
- [7] Hsin-Ping Chou, Shih-Chieh Chang, Jia-Yu Pan, Wei Wei, and Da-Cheng Juan. Remix: Rebalanced mixup. In Computer Vision – ECCV 2020 Workshops, 2020.
- [8] Peng Chu, Xiao Bian, Shaopeng Liu, and Haibin Ling. Feature space augmentation for long-tailed data. In Computer Vision – ECCV 2020, 2020.
- [9] Ekin D Cubuk, Barret Zoph, Dandelion Mane, Vijay Vasudevan, and Quoc V Le. Autoaugment: Learning augmentation strategies from data. In 2019 IEEE/CVF Conference on Computer Vision and Pattern Recognition (CVPR), 2019.
- [10] Ekin Dogus Cubuk, Barret Zoph, Jon Shlens, and Quoc Le. Randaugment: Practical automated data augmentation with a reduced search space. In Advances in Neural Information Processing Systems, 2020.
- [11] Jiequan Cui, Zhisheng Zhong, Shu Liu, Bei Yu, and Jiaya Jia. Parametric contrastive learning. In Proceedings of the IEEE/CVF International Conference on Computer Vision (ICCV), 2021.
- [12] Y. Cui, M. Jia, T. Lin, Y. Song, and S. Belongie. Class-balanced loss based on effective number of samples. In 2019 IEEE/CVF Conference on Computer Vision and Pattern Recognition (CVPR), 2019.
- [13] Terrance DeVries and Graham W Taylor. Improved regularization of convolutional neural networks with cutout. arXiv preprint arXiv:1708.04552, 2017.
- [14] Dheeru Dua and Casey Graff. UCI machine learning repository, 2017.
- [15] Ian Goodfellow, Jean Pouget-Abadie, Mehdi Mirza, Bing Xu, David Warde-Farley, Sherjil Ozair, Aaron Courville, and Yoshua Bengio. Generative adversarial nets. In Advances in Neural Information Processing Systems, 2014.
- [16] Priya Goyal, Piotr Dollár, Ross B. Girshick, Pieter Noordhuis, Lukasz Wesolowski, Aapo Kyrola, Andrew Tulloch, Yangqing Jia, and Kaiming He. Accurate, large minibatch SGD: training imagenet in 1 hour. CoRR, 2017.
- [17] Hui Han, Wen-Yuan Wang, and Bing-Huan Mao. Borderline-smote: A new over-sampling method in imbalanced data sets learning. In De-Shuang Huang, Xiao-Ping Zhang, and Guang-Bin Huang, editors, Advances in Intelligent Computing, 2005.
- [18] K. He, X. Zhang, S. Ren, and J. Sun. Deep residual learning for image recognition. In 2016 IEEE Conference on Computer Vision and Pattern Recognition (CVPR), 2016.
- [19] C Herweijer and D Waughray. Harnessing artificial intelligence for the earth. Fourth Industrial Revolution for the Earth Series, 2018.
- [20] Youngkyu Hong, Seungju Han, Kwanghee Choi, Seokjun Seo, Beomsu Kim, and Buru Chang. Disentangling label distribution for long-tailed visual recognition. In Proceedings of the IEEE/CVF Conference on Computer Vision and Pattern Recognition (CVPR), pages 6626–6636, June 2021.
- [21] Grant Van Horn, Oisin Mac Aodha, Yang Song, Yin Cui, Chen Sun, Alexander Shepard, Hartwig Adam, Pietro Perona, and Serge J. Belongie. The inaturalist species classification and detection dataset. In 2018 IEEE Conference on Computer Vision and Pattern Recognition, CVPR 2018, Salt Lake City, UT, USA, June 18-22, 2018, 2018.
- [22] C. Huang, Y. Li, C. C. Loy, and X. Tang. Learning deep representation for imbalanced classification. In 2016 IEEE Conference on Computer Vision and Pattern Recognition (CVPR), 2016.
- [23] Justin Johnson and Taghi Khoshgoftaar. Survey on deep learning with class imbalance. Journal of Big Data, 6:27, 2019.
- [24] H. Kahn and A. W. Marshall. Methods of Reducing Sample Size in Monte Carlo Computations. Operations Research, 1(5):263–278, 1953.
- [25] Bingyi Kang, Saining Xie, Marcus Rohrbach, Zhicheng Yan, Albert Gordo, Jiashi Feng, and Yannis Kalantidis. Decoupling representation and classifier for long-tailed recognition. In International Conference on Learning Representations, 2020.
- [26] Hanjoo Kim, Minkyu Kim, Dongjoo Seo, Jinwoong Kim, Heungseok Park, Soeun Park, Hyunwoo Jo, KyungHyun Kim, Youngil Yang, Youngkwan Kim, et al. Nsml: Meet the mlaas platform with a real-world case study. arXiv preprint arXiv:1810.09957, 2018.
- [27] Jaehyung Kim, Jongheon Jeong, and Jinwoo Shin. M2m: Imbalanced classification via major-to-minor translation. In Proceedings of the IEEE/CVF Conference on Computer Vision and Pattern Recognition, 2020.
- [28] Jedrzej Kozerawski, Victor Fragoso, Nikolaos Karianakis, Gaurav Mittal, Matthew Turk, and Mei Chen. Blt: Balancing long-tailed datasets with adversarially-perturbed images. In Proceedings of the Asian Conference on Computer Vision (ACCV), 2020.
- [29] A. Krizhevsky and G. Hinton. Learning multiple layers of features from tiny images. Master’s thesis, Department of Computer Science, University of Toronto, 2009.
- [30] Shuang Li, Kaixiong Gong, Chi Harold Liu, Yulin Wang, Feng Qiao, and Xinjing Cheng. Metasaug: Meta semantic augmentation for long-tailed visual recognition. In Proceedings of the IEEE/CVF Conference on Computer Vision and Pattern Recognition (CVPR), pages 5212–5221, June 2021.
- [31] T. Lin, P. Goyal, R. Girshick, K. He, and P. Dollár. Focal loss for dense object detection. In 2017 IEEE International Conference on Computer Vision (ICCV), 2017.
- [32] Tsung-Yi Lin, Michael Maire, Serge Belongie, James Hays, Pietro Perona, Deva Ramanan, Piotr Dollar, and Larry Zitnick. Microsoft coco: Common objects in context. In ECCV, 2014.
- [33] Ziwei Liu, Ping Luo, Xiaogang Wang, and Xiaoou Tang. Deep learning face attributes in the wild. In Proceedings of International Conference on Computer Vision (ICCV), December 2015.
- [34] Ziwei Liu, Zhongqi Miao, Xiaohang Zhan, Jiayun Wang, Boqing Gong, and Stella X. Yu. Large-scale long-tailed recognition in an open world. In IEEE Conference on Computer Vision and Pattern Recognition (CVPR), 2019.
- [35] Dhruv Mahajan, Ross Girshick, Vignesh Ramanathan, Kaiming He, Manohar Paluri, Yixuan Li, Ashwin Bharambe, and Laurens van der Maaten. Exploring the limits of weakly supervised pretraining. In Computer Vision – ECCV 2018, 2018.
- [36] Tomas Mikolov, Ilya Sutskever, Kai Chen, Greg S Corrado, and Jeff Dean. Distributed representations of words and phrases and their compositionality. In Advances in Neural Information Processing Systems, volume 26, 2013.
- [37] Sankha Subhra Mullick, Shounak Datta, and Swagatam Das. Generative adversarial minority oversampling. In 2019 IEEE/CVF International Conference on Computer Vision, ICCV 2019, Seoul, Korea (South), October 27 - November 2, 2019, 2019.
- [38] Seulki Park, Jongin Lim, Younghan Jeon, and Jin Young Choi. Influence-balanced loss for imbalanced visual classification. In Proceedings of the IEEE/CVF International Conference on Computer Vision (ICCV), pages 735–744, October 2021.
- [39] Adam Paszke, Sam Gross, Soumith Chintala, Gregory Chanan, Edward Yang, Zachary DeVito, Zeming Lin, Alban Desmaison, Luca Antiga, and Adam Lerer. Automatic differentiation in pytorch. In NIPS-W, 2017.
- [40] Jiawei Ren, Cunjun Yu, Shunan Sheng, Xiao Ma, Haiyu Zhao, Shuai Yi, and Hongsheng Li. Balanced meta-softmax for long-tailed visual recognition. In Advances in Neural Information Processing Systems 33: Annual Conference on Neural Information Processing Systems 2020, NeurIPS 2020, December 6-12, 2020, virtual, 2020.
- [41] Olga Russakovsky, Jia Deng, Hao Su, Jonathan Krause, Sanjeev Satheesh, Sean Ma, Zhiheng Huang, Andrej Karpathy, Aditya Khosla, Michael Bernstein, Alexander C. Berg, and Li Fei-Fei. ImageNet Large Scale Visual Recognition Challenge. International Journal of Computer Vision (IJCV), 2015.
- [42] Nikolaos Sarafianos, Xiang Xu, and Ioannis A Kakadiaris. Deep imbalanced attribute classification using visual attention aggregation. In Proceedings of the European Conference on Computer Vision (ECCV), 2018.
- [43] Jun Shu, Qi Xie, Lixuan Yi, Qian Zhao, Sanping Zhou, Zongben Xu, and Deyu Meng. Meta-weight-net: Learning an explicit mapping for sample weighting. In Advances in Neural Information Processing Systems 32: Annual Conference on Neural Information Processing Systems 2019, NeurIPS 2019, December 8-14, 2019, Vancouver, BC, Canada, 2019.
- [44] Cecilia Summers and Michael J Dinneen. Improved mixed-example data augmentation. In 2019 IEEE Winter Conference on Applications of Computer Vision (WACV), 2019.
- [45] Christian Szegedy, Vincent Vanhoucke, Sergey Ioffe, Jon Shlens, and Zbigniew Wojna. Rethinking the inception architecture for computer vision. In 2016 IEEE Conference on Computer Vision and Pattern Recognition (CVPR), 2016.
- [46] Kaihua Tang, Jianqiang Huang, and Hanwang Zhang. Long-tailed classification by keeping the good and removing the bad momentum causal effect. In NeurIPS, 2020.
- [47] Jason Van Hulse, Taghi M. Khoshgoftaar, and Amri Napolitano. Experimental perspectives on learning from imbalanced data. In Proceedings of the 24th International Conference on Machine Learning, 2007.
- [48] Vikas Verma, Alex Lamb, Christopher Beckham, Amir Najafi, Ioannis Mitliagkas, David Lopez-Paz, and Yoshua Bengio. Manifold mixup: Better representations by interpolating hidden states. In International Conference on Machine Learning. PMLR, 2019.
- [49] Xudong Wang, Long Lian, Zhongqi Miao, Ziwei Liu, and Stella Yu. Long-tailed recognition by routing diverse distribution-aware experts. In International Conference on Learning Representations, 2021.
- [50] Yulin Wang, Xuran Pan, Shiji Song, Hong Zhang, Gao Huang, and Cheng Wu. Implicit semantic data augmentation for deep networks. In NeurIPS, 2019.
- [51] Yu-Xiong Wang, Deva Ramanan, and Martial Hebert. Learning to model the tail. In Advances in Neural Information Processing Systems, 2017.
- [52] Sangdoo Yun, Dongyoon Han, Seong Joon Oh, Sanghyuk Chun, Junsuk Choe, and Youngjoon Yoo. Cutmix: Regularization strategy to train strong classifiers with localizable features. In International Conference on Computer Vision (ICCV), 2019.
- [53] Sergey Zagoruyko and Nikos Komodakis. Wide residual networks. In Proceedings of the British Machine Vision Conference (BMVC), 2016.
- [54] Hongyi Zhang, Moustapha Cisse, Yann N. Dauphin, and David Lopez-Paz. mixup: Beyond empirical risk minimization. In International Conference on Learning Representations, 2018.
- [55] J. Zhang and I. Mani. KNN Approach to Unbalanced Data Distributions: A Case Study Involving Information Extraction. In Proceedings of the ICML’2003 Workshop on Learning from Imbalanced Datasets, 2003.
- [56] Zhisheng Zhong, Jiequan Cui, Shu Liu, and Jiaya Jia. Improving calibration for long-tailed recognition. In Proceedings of the IEEE/CVF Conference on Computer Vision and Pattern Recognition (CVPR), 2021.
- [57] Boyan Zhou, Quan Cui, Xiu-Shen Wei, and Zhao-Min Chen. BBN: bilateral-branch network with cumulative learning for long-tailed visual recognition. In 2020 IEEE/CVF Conference on Computer Vision and Pattern Recognition, CVPR 2020, Seattle, WA, USA, June 13-19, 2020, 2020.
Supplementary Material
Appendix A Implementation details
In this section, we provide implementation details that are not included in Section 4.1.
CIFAR-100-LT. To set up a fair comparison, we used the same random seed to make CIFAR-100-LT, and followed the implementation of [5]. We trained ResNet-32 [18] by SGD optimizer with a momentum of 0.9, and a weight decay of . As in [5], we used simple data augmentation [18] by padding 4 pixels on each side and applying horizontal flipping or random cropping to size. We trained for 200 epochs and used a linear warm-up of the learning rate [16] in the first five epochs. The learning rate was initialized as 0.1, and it was decayed at the 160th and 180th epoch by 0.01. The model was trained with a batch size of 128 on a single GTX 1080Ti. We turned off CMO for the last three epochs in order to finetune the model in the original input space.
For experiments in Table 11, we use the same strategy as for {CMO w/ Mixup}.
For {CMO w/ Gaussian Blur} and {CMO w/ Color Jitter}, which do not mix two images, we divided classes into two groups: the majority and the minority.
Then, for the minority group, we augmented the data with color jitter and gaussian blur, respectively.
We set brightness to 0.5 and hue to 0.3 for color jitter, and set kernel size as and sigma as for Gaussian blur using the PyTorch [39] implemented functions.
ImageNet-LT.
For ImageNet-LT, we followed most of the details from [49].
As in [49], we performed simple horizontal flips, color jittering, and took random crops in size.
We used ResNet-50 as a backbone network.
The networks were trained with a batch size of 256 on 4 GTX 1080Ti GPUs for 100 epochs using SGD and an initial learning rate of 0.1; this rate decayed by 0.1 at 60 epochs and 80 epochs.
iNaturalist 2018. For iNaturalist 2018, we used the same data augmentation method as for ImageNet-LT. Multiple backbone networks were experimented on iNaturalist 2018, including ResNet-50, ResNet-101, ResNet-152 [18], and Wide ResNet-50 [53]. All backbone networks were trained with a batch size of 512 on 8 Tesla V100 GPUs for 200 epochs using SGD at an initial learning rate of 0.1; this rate decayed by 0.1 at 75 epochs and 160 epochs. Experiments were implemented and evaluated on the NAVER Smart Machine Learning (NSML) [26] platform.
Appendix B Ablation studies
B.1 Comparison with oversampling methods
We compare CMO with other oversampling methods for performance improvement on CIFAR-100 with imbalance ratio 50 and 10 in Table 13. As in the imbalance ratio of 100, our method consistently improves performance in all long-tailed recognition methods.
| Imbalance ratio | 50 | 10 | ||||||||||||||||||||||
|---|---|---|---|---|---|---|---|---|---|---|---|---|---|---|---|---|---|---|---|---|---|---|---|---|
| Method | Vanilla | +ROS [47] | +Remix [7] | +CMO | Vanilla | +ROS [47] | +Remix [7] | +CMO | ||||||||||||||||
| CE |
|
|
|
|
|
|
|
|
||||||||||||||||
| CE-DRW [5] |
|
|
|
|
|
|
|
|
||||||||||||||||
| LDAM-DRW [5] |
|
|
|
|
|
|
|
|
||||||||||||||||
| RIDE [49] |
|
|
|
|
|
|
|
|
||||||||||||||||
B.2 Results on longer training epochs
We evaluate CMO using the same setting from PaCo [11]. That is, we train the network for 400 epochs and use AutoAugment [9] on CIFAR-100-LT. For iNaturalist2018, RandAugment [10] is applied. Table 14, 15 reveals that {BS + CMO} surpasses PaCo in most cases, and achieves a new state-of-the-art performance. These results demonstrate the effectiveness of CMO, despite its simplicity.
B.3 Impact of
We evaluate the impact of the hyperparameter in Figure 3. The classification accuracy according to different is plotted. CMO improves the baseline accuracy (38.6%) in all cases. The best performance is achieved when .
B.4 Computational cost
One of the biggest advantages of our method is its low computational cost. CMO only requires to load an additional batch of data from the minor-class-weighted loader. We measure the training time per batch on ImageNet-LT (see Table 16). While CE takes 0.355s, CE+CMO takes 0.369s, which is only an increase of 3.94%.
![[Uncaptioned image]](/html/2112.00412/assets/figures/images/alpha.png)
| CE | CE + CMO | |
| Training Time (s) | 0.355 | 0.369 |
Appendix C Pseudo-code of Context-rich Minority Oversampling
We present the PyTorch-syle pseudo-code of CMO algorithm in Algorithm 2. Note that CMO is easy to implement with just a few lines that are easily applicable to any loss, networks, or algorithms. Thus, CMO can be a very practical and effective solution for handling imbalanced dataset.