When Does Aggregating Multiple Skills with Multi-Task Learning Work?
A Case Study in Financial NLP
Abstract
Multi-task learning (MTL) aims at achieving a better model by leveraging data and knowledge from multiple tasks. However, MTL does not always work – sometimes negative transfer occurs between tasks, especially when aggregating loosely related skills, leaving it an open question when MTL works. Previous studies show that MTL performance can be improved by algorithmic tricks. However, what tasks and skills should be included is less well explored. In this work, we conduct a case study in Financial NLP where multiple datasets exist for skills relevant to the domain, such as numeric reasoning and sentiment analysis. Due to the task difficulty and data scarcity in the Financial NLP domain, we explore when aggregating such diverse skills from multiple datasets with MTL can work. Our findings suggest that the key to MTL success lies in skill diversity, relatedness between tasks, and choice of aggregation size and shared capacity. Specifically, MTL works well when tasks are diverse but related, and when the size of the task aggregation and the shared capacity of the model are balanced to avoid overwhelming certain tasks.111 https://github.com/EdisonNi-hku/MTL4Finance.
1 Introduction
Multi-task learning (MTL) is a machine learning paradigm where multiple learning tasks are optimized simultaneously, exploiting commonalities and differences across them Caruana (1997). MTL is expected to outperform single-task learning (STL) as it utilizes more training data and enables inter-task knowledge sharing (Ruder, 2017). However, MTL may also bring about multi-task conflict and negative transfer. Empirically, in many MTL systems, only a small portion of tasks benefit from MT joint training while others suffer from negative transfer (Stickland and Murray, 2019; Raffel et al., 2020; Peng et al., 2020). Therefore, it is still an open question when MTL will work.
| Method | TSA | SC |
|---|---|---|
| GPT-3 Zero-Shot | ||
| GPT-3 Few-Shot | ||
| FinBERT Fine-Tune |
MTL systems have two components: MTL algorithms and the tasks included for aggregation. Recent progress in MTL has shown that appropriate MTL algorithms (e.g., architecture and optimization) can mitigate negative transfers (Yu et al., 2020; Wang et al., 2021; Pfeiffer et al., 2021; Karimi Mahabadi et al., 2021; Mao et al., 2022; Ponti et al., 2023, inter alia). However, it is still unclear when MTL works from the perspective of the relations between tasks and skills to be aggregated for better performance in a practical setting.
To understand this, we conduct a practical case study on Financial NLP. We choose Financial NLP mainly because (1) Financial NLP tasks are hard: GPT-3 (Brown et al., 2020) does not perform well on financial tasks (see Table 1), though it is a good zero/few-shot learner in general domains; and (2) Financial NLP datasets typically address different skills (e.g., quantitative reasoning, and sentiment analysis), and have a limited data size (Malo et al., 2013; Cortis et al., 2017; Lamm et al., 2018a; Mariko et al., 2020; Chen et al., 2019a, 2020, inter alia). Therefore, it is promising to aggregate Financial NLP tasks using MTL, which not only compiles and augments the small datasets, but also benefits the difficult tasks through relevant information transfer and comprehensive reasoning. However, no previous work explores the benefits of aggregating Financial NLP resources using MTL. Particularly, we explore the following hypotheses about when MTL works:
-
H1.
When various skills are included: Intuitively, positive transfers are likely to happen among tasks regarding the same skill. However, diversified skills might benefit the MTL system through implicit data augmentation, attention focusing, and feature eavesdropping Ruder (2017). Our empirical results also show that skill diversity benefits MTL.
-
H2.
When the aggregated tasks are well related: We find that the close relation (measured qualitatively and quantitatively) among Financial NLP tasks explains why diversified skills help each other, and contributes to the success of MTL.
-
H3.
When the aggregation size matches shared capacity: Too many objectives may exhaust the MTL shared capacity and cause interference among tasks (Stickland and Murray, 2019). We find that excessive aggregation size in a limited capacity model restricts the performance of some tasks. Thus aggregation size should be appropriate for the shared capacity.
To facilitate exploration of H1 and H2, we survey existing Financial NLP resources and propose FinDATA (Financial Data And Tasks Aggregation), a collection of Financial NLP tasks covering various financial text understanding skills. To check H3, we propose SPAL-FinBERT (Shared Parallel Attention Layer with FinBERT), an MTL architecture based on pre-trained FinBERT Araci (2019), but is highly parameter-efficient – with fewer trainable parameters but outperforming the vanilla FinBERT MTL on several tasks. Our contributions include
-
1.
We conduct a case study on Financial NLP to explore what properties of task aggregation lead to the success of MTL.
-
2.
We survey and aggregate several existing Financial NLP tasks and datasets, illustrating that MTL can be a cheap and efficient improvement for Financial NLP performance.
-
3.
We propose SPAL-FinBERT, a parameter-efficient MTL architecture with good performance. This model may also have broader use cases in other settings.
2 Background & Related Work
Previous work mainly focuses on two categories of MTL practice: MTL as pre-training and MTL as auxiliary training.
MTL as pre-training: Besides unsupervised pre-training, supervised data can also be utilized for pre-training in an MTL manner (i.e., an intermediate training stage) to improve the model’s multi-aspect intelligence and generalizability to unseen tasks. Such an approach has been shown beneficial for various pre-trained models, including encoder-only models (Liu et al., 2019; Aghajanyan et al., 2021), encoder-decoder models (Aribandi et al., 2022; Chung et al., 2022), and large language models (Wei et al., 2022; Sanh et al., 2021; Min et al., 2022; Chung et al., 2022). Aghajanyan et al. (2021) show that MTL pre-training does not work with small-scale task aggregation. More recent analysis shows that aggregating related tasks transfers better to a known target task (Padmakumar et al., 2022).
MTL as auxiliary training: Instead of training a target task alone, we can jointly train it with other auxiliary tasks to improve its performance in an MTL manner (i.e., the final training stage). However, this approach does not work in most cases, especially when multiple skills are aggregated (e.g., GLUE) (Stickland and Murray, 2019; Peng et al., 2020; Raffel et al., 2020; Mueller et al., 2022). Previous work shows that appropriate algorithmic tricks lead to more success in MTL: (1) MTL architecture: Pfeiffer et al. (2021); Karimi Mahabadi et al. (2021) and Ponti et al. (2023) propose MTL architectures that encourage high-level knowledge sharing instead of direct parameter-sharing; and (2) MTL optimization: Yu et al. (2020) and Wang et al. (2021) geometrically manipulate the gradients to reduce the conflicts, and Mao et al. (2022) learn to weight losses of including tasks automatically. In computer vision (CV), Fifty et al. (2021) address that task aggregation is also crucial for MTL besides algorithms and proposes an algorithm to select the best task grouping from a task collection. However, rare previous work in NLP analyzes what task aggregation leads to the success of MTL and what qualities of a task aggregation are important.
3 FinDATA Compilation
We compile FinDATA, a task aggregation on Financial NLP, to facilitate the case study. We first set the desiderata, and then survey existing Financial NLP tasks to select those that meet these criteria.
3.1 Desiderata
Diversified skills: We are interested in the importance of skill diversity and task-relatedness in MTL. Therefore, included tasks should cover as many Financial NLP skills as possible. If multiple tasks correspond to the same skill (e.g., sentiment analysis), we prefer smaller ones that are more worth aggregating and less likely to dominate. Some tasks can have closer relation than others (e.g., corresponding to similar skills).
Aligned form of input: To enable joint training, we prefer tasks with sentences or paragraphs as inputs, instead of phrases, tables, or full reports.
3.2 Financial NLP
The most prevalent Financial NLP task is sentiment analysis on financial tweets or news, as it directly contributes to automatic decision-making tools in the financial market. There are two types of financial sentiment analysis, the first of which defines sentiment analysis as a coarse-grained classification problem. Given a piece of financial news, the system only needs to classify its sentiment into positive, negative, or neutral. Most of the financial sentiment analysis are in this form, for example, Financial Phrase Bank (Malo et al., 2013), and StockSen (Xing et al., 2020). The other instantiation of financial sentiment analyses has more fine-grained labels: Cortis et al. (2017) assigns different sentiment scores from to to different targets in financial news.
Numbers are ubiquitous in all forms of financial text (e.g. news, tweets, and reports). Hence, many tasks and datasets are proposed for number semantics and numeracy. For example, FinNum shared task of recent years proposed several datasets focusing on financial number type understanding and number attachment (Chen et al., 2018, 2019a, 2020). Chen et al. (2019b) further proposed Numeracy-600K for number magnitude understanding. Zhu et al. (2021) proposed TAT-QA, a Question Answering(QA) benchmark financial hybrid (tabular and text) data. Similarly, Chen et al. (2021) proposed FinQA, another QA benchmark on financial hybrid data emphasizing numeracy skills.
Some datasets provide financial natural language understanding (NLU) skills other than sentiment and numbers. For instance, Lamm et al. (2018a) proposed a dataset for analogy parsing originally, which contains financial semantic role annotations and thus can be used for semantic role labeling (SRL). (Mariko et al., 2020) detects causal effect in financial news.
Not all financial NLP tasks are sentence-level. Many tasks take entire documents as inputs, for example, narrative summarization (El-Haj et al., 2020) and table of content prediction (Maarouf et al., 2021) on financial reports. Some other tasks focus on financial concepts (phrases) (Maarouf et al., 2020; Kang et al., 2021; Pontes et al., 2022) instead of complete sentences. Appendix D covers more details regarding mentioned datasets.
3.3 FinDATA
| |Train| | |Dev| | |Test| | Task Type | Metrics | Text Source | Financial NLU Skill | |
|---|---|---|---|---|---|---|---|
| TSA | 913 | 229 | 561 | Seq Regression | RMSE | News texts | Sentiment w.r.t. target |
| SC | 3866 | 484 | 484 | Seq Classification | Accuracy | News texts | Sentiment type |
| NC | 6669 | 1668 | 1191 | Seq Classification | Accuracy | Analyst report | Number type |
| NAD | 7187 | 1044 | 2109 | Seq Classification | Accuracy | Financial tweets | Number attachment |
| FSRL | 900 | 100 | 100 | Token Classification | Macro-F1 | News texts | Semantic roles |
| CD | 674 | 226 | 226 | Span Prediction | Accuracy | News texts | Causal effect |
Based on our survey and desiderata, the following 4 Financial NLP skills are selected:
Financial sentiment analysis is a prevalent skill in the Financial NLP domain, analyzing financial news’ and investors’ sentiment toward particular financial objects. We select two tasks for this skill: (1) Financial Phrasebank sentiment classification (SC, Malo et al., 2013): given a financial news headline, classifying it into positive, negative, or neutral; and (2) SemEval-2017 target-based sentiment analysis (TSA, Cortis et al., 2017): predicting a sentiment score between -1 and 1 w.r.t. a financial news headline and a target company.
Financial number understanding is another important Financial NLP skill, as numbers are ubiquitous in all forms of financial text (e.g., news, tweets, and reports). We select two tasks for this skill: (1) FinNum-3 number classification (NC) (Chen et al., 2020): given a report paragraph and a target number, classifying it into monetary, percentage, temporal, and so on; and (2) FinNum-2 number attachment detection (NAD) (Chen et al., 2019a): given a financial tweet, a target number, and a cash tag, predicting whether the number is attached (i.e., related) to the cash tag.
Financial semantic role labeling (FSRL) is a skill aiming at understanding the quantitative semantic roles (Lamm et al., 2018b) such as quantity, value, location, date, theme, etc. We include Lamm et al.’s (2018a) dataset222The dataset is for analogy parsing originally. We utilize its quantitative semantic role labels. for this skill.
Causality understanding aims at understanding the causal relationship between financial facts. For this skill, we include FinCausal 2020 Causality Detection (CD, Mariko et al., 2020).
All our datasets are in English. Other details of included tasks can be found in Table 2. We present several examples for each FinDATA dataset in Appendix J.
4 Multi-Task Learning Systems
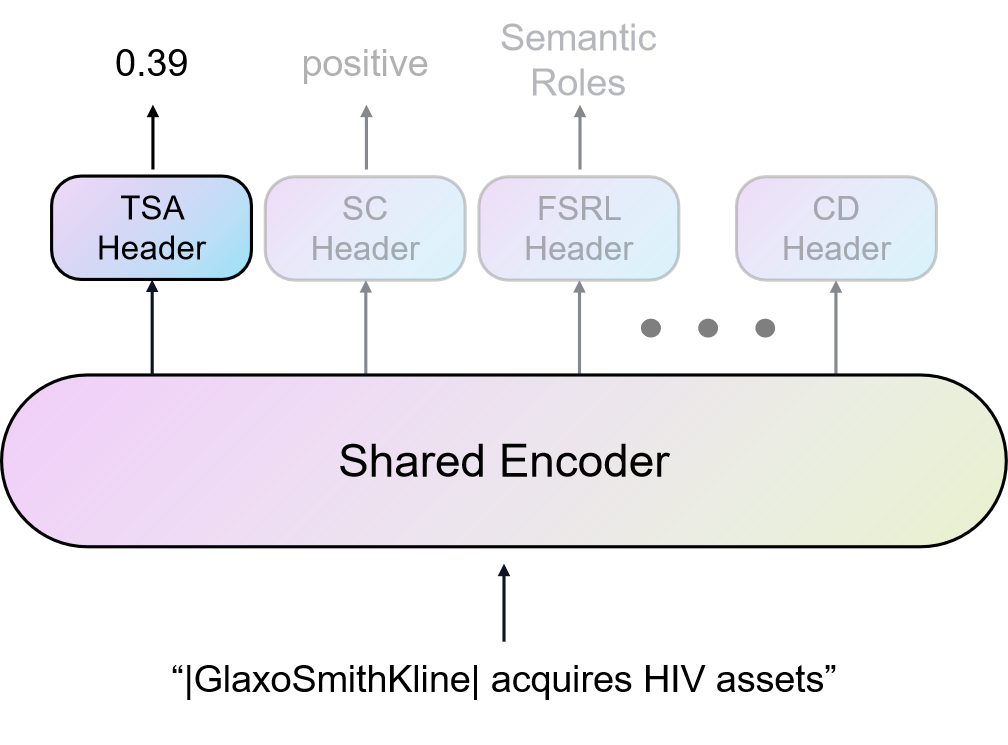
We consider various MTL systems in the form of shared encoder + one-layer task-specific prediction headers. The MTL problem is formulated as follows:
We are given a joint dataset of multiple tasks where denotes the training corpus and labels of task ; and denotes the task collection. We are also given a pre-trained encoder (e.g., FinBERT) and task-specific prediction headers , which are parameterized by . The training loss for multi-task fine-tuning:
| (1) |
Where denotes the loss function for task , and denotes the sampling weight of task . The generic architecture is illustrated in Figure 1. During training, a task is sampled for each training step, and the corresponding prediction header and the shared encoder are updated (e.g., the TSA example in Figure 1).
5 Experimental Setup
We fine-tune all MTL and STL models on corresponding data for 40 epochs. (Our MTL batching scheme is described in Appendix C.) For STL, we evaluate the model every 50 steps and save the checkpoint with the best validation score. For MTL, we evaluate every 200 steps, saving and reporting the best checkpoint for each task independently following the setting of Raffel et al. (2020) (i.e., each task can be viewed as the target task with others being auxiliary tasks). We follow the evaluation metrics in Table 2 to select the best checkpoints and report the test performance. All MTL and STL results are averaged over random seeds from 1 to 5 with standard deviations attached. Appendix C contains more details about data preprocessing, hyperparameters, and GPU usage.
Pre-trained Model Selection & STL Baselines: Existing financial pre-trained models (Araci, 2019; Yang et al., 2020; Liu et al., 2020; Hazourli, 2022) are usually compared on the Financial PhraseBank dataset (Malo et al., 2013). Such comparison is suboptimal because (1) Financial PhraseBank sentiment analysis has no official test set. Existing work separates test sets on their own, making the scores less comparable across different work; and (2) the models are not compared on benchmarks other than sentiment analysis. Therefore, we compare financial pre-trained models on all FinDATA tasks to select the best one.
STL results on all publicly available financial pre-trained models (P-FinBERT (Araci, 2019), Y-FinBERT (Yang et al., 2020), and FinancialBERT (Hazourli, 2022)) and BERT Devlin et al. (2019) are presented in the first half of Table 3. P-FinBERT (Araci, 2019) outperforms other pre-trained models. Therefore, we use P-FinBERT in all subsequent experiments.
6 Analysis
In this section, we analyze the hypotheses about when aggregating multiple skills with MTL works.
6.1 H1: Skill Diversity
| Method | STL Model or MTL Subset | Sentiment | Number | - | - | |||||||
| TSA | SC | NC | NAD | FSRL | CD | |||||||
| STL | BERT-cased | |||||||||||
| BERT-uncased | ||||||||||||
| FinancialBERT | ||||||||||||
| Y-FinBERT | ||||||||||||
| P-FinBERT | ||||||||||||
| MTL | Full FinDATA | |||||||||||
| w/o FSRL | - | |||||||||||
| w/o CD | - | |||||||||||
| w/o Sentiment | - | - | ||||||||||
| w/o Number | - | - | ||||||||||
| Only Sentiment | - | - | - | - | ||||||||
| Only Number | - | - | - | - | ||||||||
To verify the hypothesis that skill diversity benefits MTL, we compare the MTL results on full FinDATA and its subsets that ablate one skill or focus on one skill. Specifically, ablating a skill results in four subsets: w/o financial semantic role labeling, w/o causality detection, w/o sentiment analysis, and w/o number understanding. Focusing on a single skill results in two subsets: only sentiment analysis and only number understanding. We use FinBERT (Araci, 2019) as the shared encoder. The results are shown in Table 3. It can be observed that (1) skill diversity benefits MTL: the best MTL scores of all tasks are obtained by mixing several different skills while concentrating on sentiment/number understanding skills (w/o Sentiment and w/o Number) leads to a performance drop on corresponding tasks; and (2) ablating FSRL decreases the performance of all other tasks, illustrating that FSRL positively transfers to all other skills. Therefore, positive transfers can happen between different skills. Including skills other than the target skill in MTL is a potential way to benefit target performance.
6.2 H2: Task Relatedness
Similar to FinDATA, GLUE also aggregates multiple NLU skills. However, GLUE MTL usually leads to a performance drop on most tasks (according to Stickland and Murray (2019) only RTE is improved; and according to Mueller et al. (2022), 3 out of 9 tasks are improved) while FinDATA MTL increases the scores of 4 out of 6 included tasks. Therefore, we hypothesize that FinDATA tasks are more closely related than GLUE tasks though they all cover diverse skills. We measure the relatedness among FinDATA tasks qualitatively and quantitatively:
Qualitative Analysis: Many tasks relate to each other explicitly: (1) SC and TSA: though they have different annotations, both of them predict financial sentiment. (2) FSRL and NC: “date” is one of the classes in NC, while FSRL helps to understand the semantic role of time numbers. These explicit transfers can be probed by different output headers of an MTL system: for an input sentence, the MTL system outputs predictions corresponding to different tasks, where the non-target headers’ predictions may interpret the target prediction (Geva et al., 2021). In Appendix I, we illustrate these explicit transfers by listing examples of the prediction header’s outputs.
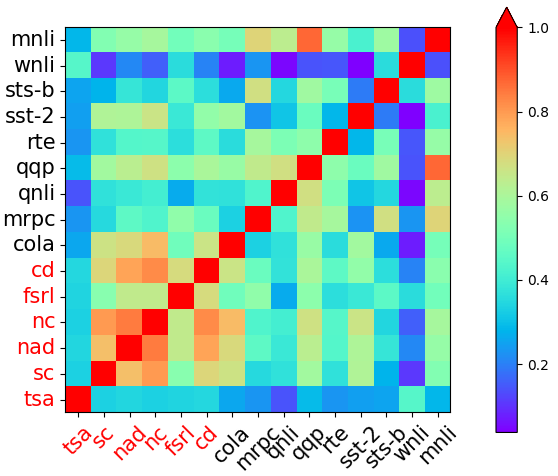
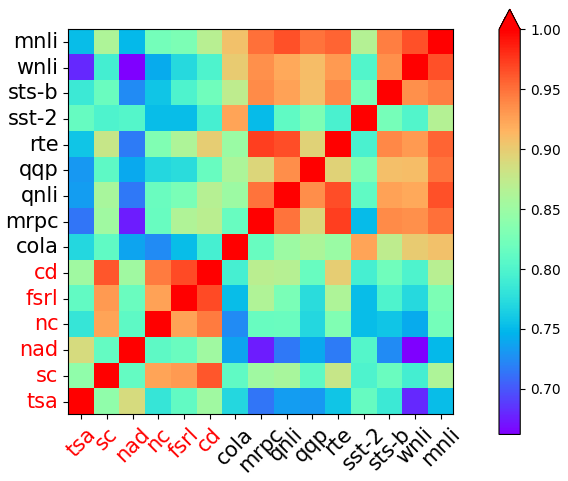
Quantitative Analysis: Vu et al. (2020) propose task and text embedding to measure the similarity between task objectives and texts. This embedding algorithm facilitates high-level knowledge sharing in the MTL architecture proposed by Karimi Mahabadi et al. (2021), which achieves superior performance. Therefore, we use these metrics to quantify the relatedness among the tasks aggregated in our MTL systems. We follow Vu et al.’s (2020) calculation setting, except that we use FinBERT instead of BERT: we first calculate task and text embeddings of FinDATA and GLUE tasks. Then we compute the cosine similarity scores among embeddings.
Figure 2(a) shows the heatmap of task embedding similarity scores, indicating that FinDATA tasks are more closely clustered than GLUE tasks, illustrating why FinDATA MTL leads to more improvements than GLUE MTL. Another observation is that TSA has the lowest similarity scores with other FinDATA tasks, which possibly explains why it is not improved by MTL in Table 3. Figure 2(b) presents the heatmap of text embedding similarity, where financial and general data are well separated with high in-domain similarity.
However, the similarity scores are symmetric metrics and thus fail to explain some asymmetric transfers (which is also observed in previous work (Geva et al., 2021)). For example, FSRL has a moderate level of text and task similarity to other tasks, but its performance is not enhanced by MTL while it boosts the performance of others. A possible explanation is that financial semantic understanding skill (provided by FSRL) is a necessary ability for other FinDATA tasks, but the skills covered by other tasks are not necessary for FSRL. Therefore, the joint training does not benefit FSRL.
We further analyze whether gradient similarities interpret task-relatedness and MTL transferability since many previous works attribute the negative transfer among aggregated tasks to gradient conflicts (Ruder, 2017; Yu et al., 2020; Wang et al., 2021; Mueller et al., 2022). However, our findings in Appendix F show that gradient conflicts/similarities are not good measurements.
In conclusion, the degree of task-relatedness serves as a significant predictor of the MTL outcome, and can be roughly measured through quantitative and qualitative means. To better explain asymmetric transfer and analyze the inter-task relations in a finer grain, it is essential to develop asymmetric measurements. We reserve that exploration for future work.
6.3 H3: Matched Aggregation Size with Shared Capacity
We hypothesize that having too many tasks sharing limited model capacity might cause interference among tasks and result in poor MTL performance. Therefore, given a fixed pre-trained model, the task aggregation size should be appropriate for the shared capacity to achieve the best MTL practice.
Section 6.1 shows that the task combination significantly influences the MTL performance. Altering the task aggregation may introduce unwanted positive or negative transfers. Therefore, to verify this hypothesis, we control the task aggregation (stick to FinDATA instead of adding other tasks) and reduce the shared capacity to simulate the scenario where task aggregation may exhaust the shared capacity.
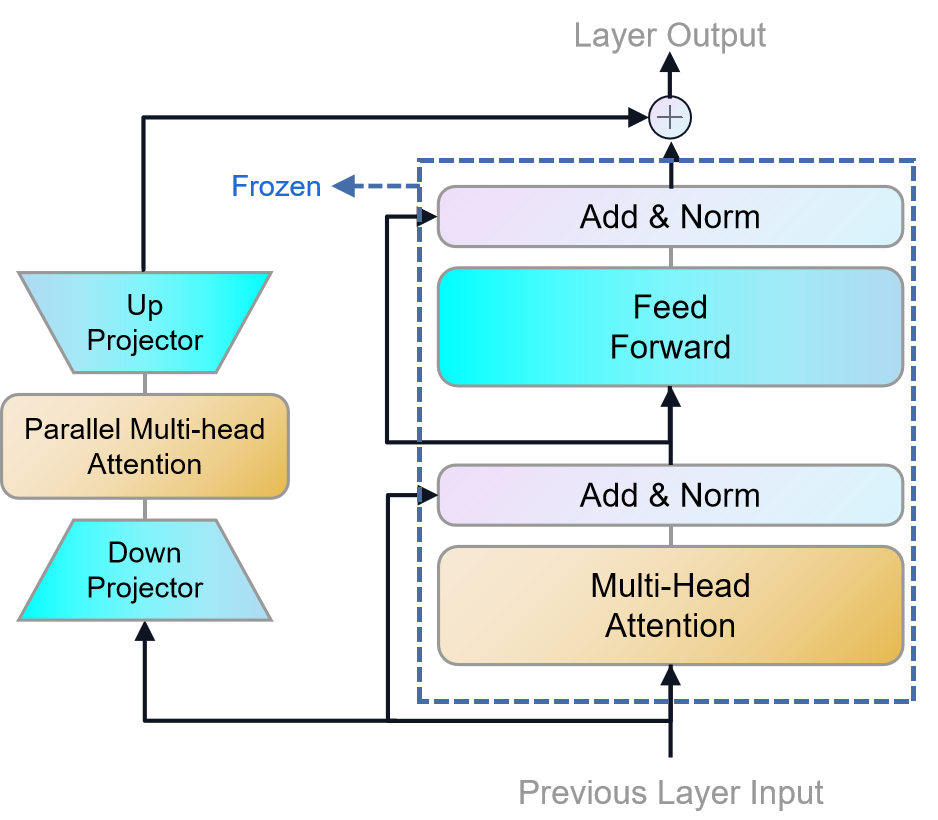
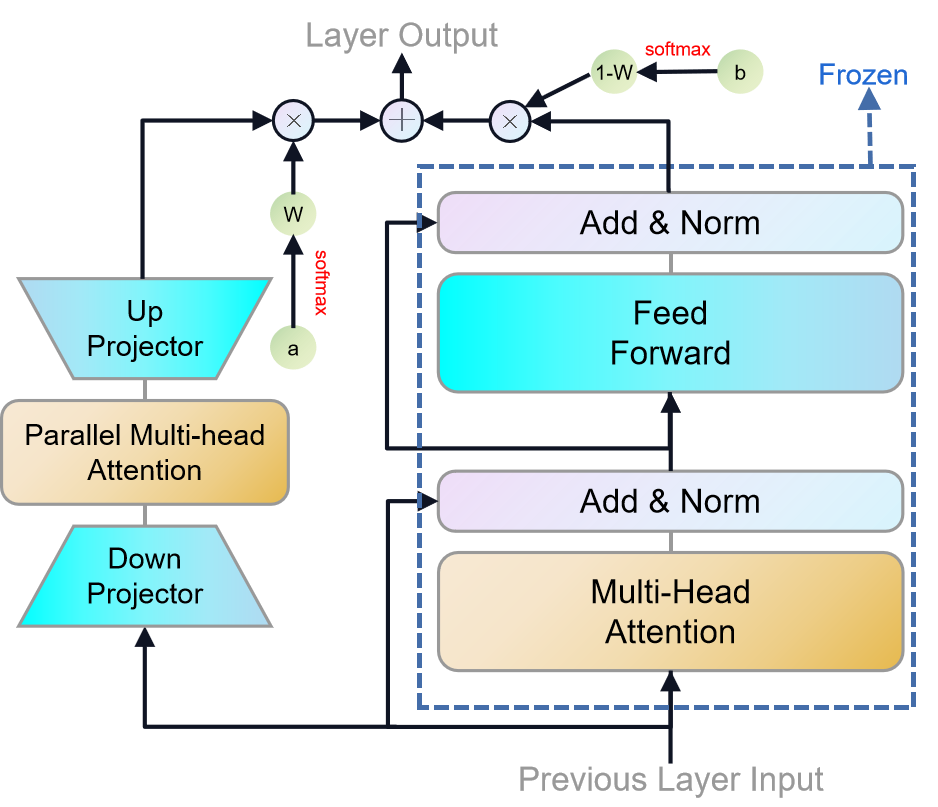
To enable altering shared capacity, we propose SPAL-FinBERT, an architecture that both leverages a pre-trained model and has tunable shared capacity. Figure 3 illustrates the architecture. The FinBERT layers are frozen while the parallel attention layers (PALs, Stickland and Murray, 2019) are trainable. Different from original task-specific PALs, ours are shared across different tasks. Thus, we call them shared PALs (SPALs). The design is similar to Adapters (Houlsby et al., 2019): both consists of light-weighted trainable structures and a frozen pre-trained model. We choose PAL as the shared trainable structure because it has a more complicated structure than an adapter which might benefit multi-task knowledge sharing (Adapters are usually for STL). We can easily change the shared capacity by setting the SPAL hidden size to any multiple of 12 (the number of self-attention heads).
| TSA | SC | NC | NAD | FSRL | CD |
|---|---|---|---|---|---|
| - | |||||
| - | - | ||||
| - | - | - | |||
| - | - | - | - | ||
| - | - | - | - | - |
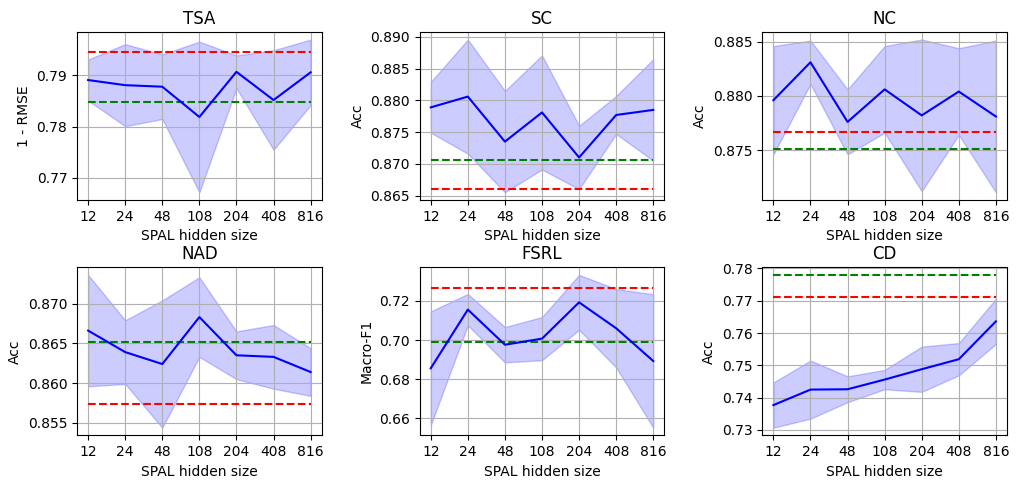
We run FinDATA MTL with SPAL hidden size from 12 to 816. The smallest and the largest trainable shared capacity are roughly 228K333SPALs’ parameter number is calculated by #layers(self-attention layerprojection layer), e.g., M when hidden size is 204. ( of FinBERT parameters) and 47M ( of FinBERT parameters). The results are shown in Figure 4. We surprisingly find that the aggregated tasks are not equally sensitive to the change of shared capacity: negative transfer towards CD grows while the shared capacity becomes limited. However, Some tasks are not significantly restricted by the limited shared capacity: SC and NC even achieve the best scores with relatively small shared capacity.
To verify that aggregating too many tasks in limited capacity overwhelms CD, we gradually ablating tasks from the MTL system with minimal shared capacity. Table 4 presents the results. The CD performance gradually improves when we decrease the aggregation size (although the task combination can be a confounder for the CD performance). The highest score is achieved when only aggregating two tasks.
Therefore, to achieve better MTL practice, the aggregation size should be appropriate for the shared capacity to avoid overwhelming tasks like CD. These tasks are sensitive to capacity sharing. Including too many auxiliary objectives might exhaust the shared capacity, distracting the MTL system from these tasks. Other tasks (e.g., SC and NC) might be more tolerant for capacity sharing, thus allowing larger-scale MTL auxiliary training.
6.4 Efficiency of SPAL-FinBERT
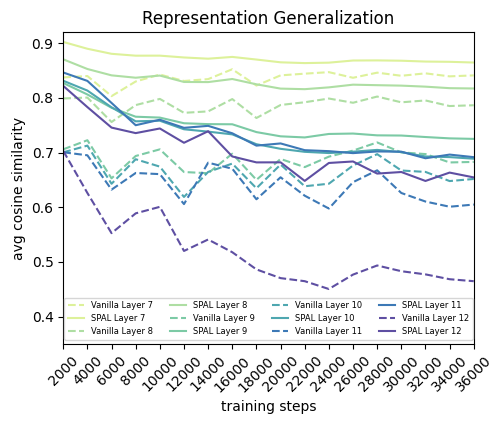
Another observation of Figure 4 is that SPAL-FinBERT outperforms vanilla FinBERT with much fewer trainable parameters. In the most impressive case, SPAL-FinBERT outperforms vanilla FinBERT on four tasks with fewer trainable parameters (when the SPAL hidden size is 12). One possible reason behind our model’s performance is that the frozen FinBERT provides a strong regularization and thus reduces the representation variance of each layer. Such generalized representations are more likely to be favored by different tasks and thus benefit MTL (Ruder, 2017). To verify this explanation, we compare the representation generalizations of SPAL-FinBERT and FinBERT MTL systems.
Representation generalization: Intuitively, representation generalization measures how similar an MTL system represents data of different tasks. We first compute the representations for all tasks, models, and layers, following the formula:
| (2) |
where denotes task ’s representation generated by layer of MTL model ; denotes the dataset of task ; and denotes the data points. Then, we compute the cosine similarity score between all task representation pairs , averaging the similarity scores to measure the representation generalization of model layer :
| (3) |
where denotes combination, denotes the task collection, and denotes cosine similarity. Figure 5 shows the representation generalization for two MTL systems at different training steps. For simplicity, only higher layers’ results (layer to ) are presented as they are modified more by fine-tuning (Zhou and Srikumar, 2022) and related more to the output. It can be observed that SPAL-FinBERT generates more generalized representations than FinBERT in all shown layers (especially for the highest ones).
Another observation is that representation generalization decreases when the training step increases. One possible explanation for this downward trend is that the MTL system is trying to learn task-specific knowledge (especially in higher layers) as multi-task fine-tuning continues.
In Appendix H, we further use an ablation experiment and a probing experiment to show the contribution of the frozen FinBERT and the necessity of freezing.
7 Discussion
Suggestions for MTL practice: Based on the results of our case study, we recommend the following practices for future MTL: (1) aggregate not only the target skill but also other related skills; (2) select tasks for aggregation based on both their qualitative and quantitative relatedness to the target task; and (3) check if the target task is sensitive to capacity sharing, excluding redundant (e.g., distantly related) tasks to avoid distracting the target task.
Aggregating multiple skills with MTL is a potential way for better Financial NLP practice: Financial NLP tasks are more complicated than those in the general domain, and many of them suffer from a lack of data. Obtaining new Financial NLP data is expensive since such annotation usually requires domain expertise. Our results show that aggregating Financial NLP tasks using MTL can be a practical and relatively cheap way to improve their performance: SC, NC, NAD, and CD are improved by up to , , , and percentage points accordingly through MTL auxiliary training (contributed by different MTL systems). In Appendix G, we also show that MTL pre-training with Financial NLP tasks can improve the model’s generalizability to unseen tasks. Therefore, future research and practice in Financial NLP may consider MTL as a potential way to achieve better performance. Other possible questions: We address some other possible questions that might be of interest to our readers in Appendix A.
8 Conclusion
In this work, we conduct a case study on Financial NLP to analyze when aggregating multiple skills with MTL works from a perspective of task relations and skills to be included. We propose a parameter-efficient MTL architecture SPAL-FinBERT. Our empirical analyses point out potential directions to improve task aggregation for future MTL practice: (1) considering diversified non-target skills that might be supportive; (2) filtering tasks with their relatedness; and (3) caring whether capacity sharing overwhelms the target task. We also show that aggregating resources through MTL can be a cheap and efficient way to improve Financial NLP performance.
Limitations
Firstly, the transferability between different tasks within an MTL system is not well measured in current work. We also find such transferability is asymmetric and thus hard to quantify using symmetric measurements such as cosine similarity between task embeddings or gradients: for example, TSA positively transfers to SC, but SC negatively transfers to TSA (see the “Only Sentiment” row in Table 3); FSRL positively transfer to all other tasks, but other tasks negatively affect FSRL. Future work may consider exploring better indicators that address the asymmetry of task transferability (e.g., similar to inter-task affinity scores (Fifty et al., 2021) in the CV domain).
Secondly, some of the conclusions drawn from our case study only point in a vague direction for future MTL practice. For example, we find that some tasks are more sensitive to capacity sharing in Section 6.3. Therefore, aggregating an excessive number of tasks with those tasks might overwhelm them. However, it is hard to determine exactly each task’s sensitivity to capacity sharing and the optimal number of aggregated tasks without some trials on different task combinations. Future work may explore why some tasks are easily overwhelmed by capacity sharing and propose methods to identify them.
Thirdly, in this work, we analyze the influence of multiple factors on MTL performance. However, the factors are usually entangled and confound each other. For example, we decrease the number of tasks aggregated with CD to show that too large aggregation overwhelms CD in a limited shared capacity. But the tasks included (a confounder for MTL performance) are also changed. Future work may conduct rigorous causal analyses, exploring how much each factor affects MTL performance.
Ethical Considerations
Data Privacy and Bias: All datasets used in this research are published in previous studies and publicly available: datasets for TSA, SC, FSRL, CD, and Numeracy-600K can be downloaded from the internet, while datasets for NC, NAD, and StockSen require signing corresponding agreements and requesting from the authors.
Licenses: TSA is under Apache License 2.0; SC is under CC BY-NC-SA 3.0; CD and StockSen are under CC BY 4.0; and Numercay-600K, NC, and NAD are under CC BY-NC-SA 4.0. The license of FSRL data is not explicitly specified, but the author allows data usage with a proper citation in their GitHub repository.
Most of the datasets are widely used in the Financial NLP domain (e.g., shared tasks). We also manually checked for offensive content in the data. There is no data bias against certain demographics with respect to these datasets.
Reproducibility: We make all of our code public on GitHub. For data, we include links to request NC, NAD, and StockSen, and provide data splits for TSA, SC, FSRL, CD, and Numeracy-600K. We also provide detailed instructions to reproduce all the experiment results on GitHub.
Potential Use: The potential use of this study is to improve future practice in MTL and the Financial NLP domain.
Author Contributions
Jingwei Ni designed the project and the storyline, and conducted the MTL analyses and the survey in Financial NLP.
Zhijing Jin helped design the storyline and provided essential suggestions on what experiments and analyses are important.
Qian Wang contributed to the financial background of the storyline, collected the first version of FinDATA, and gave insights on what skills are important from a financial perspective.
Mrinmaya Sachan and Markus Leippold guided the project and substantially contributed to the storyline and experiment design.
Everyone contributed to writing the paper.
Acknowledgements
References
- Aghajanyan et al. (2021) Armen Aghajanyan, Anchit Gupta, Akshat Shrivastava, Xilun Chen, Luke Zettlemoyer, and Sonal Gupta. 2021. Muppet: Massive multi-task representations with pre-finetuning. In Proceedings of the 2021 Conference on Empirical Methods in Natural Language Processing, pages 5799–5811, Online and Punta Cana, Dominican Republic. Association for Computational Linguistics.
- Araci (2019) Dogu Araci. 2019. Finbert: Financial sentiment analysis with pre-trained language models. arXiv preprint arXiv:1908.10063.
- Aribandi et al. (2022) Vamsi Aribandi, Yi Tay, Tal Schuster, Jinfeng Rao, Huaixiu Steven Zheng, Sanket Vaibhav Mehta, Honglei Zhuang, Vinh Q. Tran, Dara Bahri, Jianmo Ni, Jai Gupta, Kai Hui, Sebastian Ruder, and Donald Metzler. 2022. Ext5: Towards extreme multi-task scaling for transfer learning. In International Conference on Learning Representations.
- Brown et al. (2020) Tom Brown, Benjamin Mann, Nick Ryder, Melanie Subbiah, Jared D Kaplan, Prafulla Dhariwal, Arvind Neelakantan, Pranav Shyam, Girish Sastry, Amanda Askell, Sandhini Agarwal, Ariel Herbert-Voss, Gretchen Krueger, Tom Henighan, Rewon Child, Aditya Ramesh, Daniel Ziegler, Jeffrey Wu, Clemens Winter, Chris Hesse, Mark Chen, Eric Sigler, Mateusz Litwin, Scott Gray, Benjamin Chess, Jack Clark, Christopher Berner, Sam McCandlish, Alec Radford, Ilya Sutskever, and Dario Amodei. 2020. Language models are few-shot learners. In Advances in Neural Information Processing Systems, volume 33, pages 1877–1901. Curran Associates, Inc.
- Caruana (1997) Rich Caruana. 1997. Multitask learning. Machine Learning, 28:41–75.
- Chen et al. (2019a) Chung-Chi Chen, Hen-Hsen Huang, and Hsin-Hsi Chen. 2019a. Numeral attachment with auxiliary tasks. In Proceedings of the 42nd International ACM SIGIR Conference on Research and Development in Information Retrieval, SIGIR’19, page 1161–1164, New York, NY, USA. Association for Computing Machinery.
- Chen et al. (2020) Chung-Chi Chen, Hen-Hsen Huang, and Hsin-Hsi Chen. 2020. Numclaim: Investor’s fine-grained claim detection. In Proceedings of the 29th ACM International Conference on Information & Knowledge Management, CIKM ’20, page 1973–1976, New York, NY, USA. Association for Computing Machinery.
- Chen et al. (2018) Chung-Chi Chen, Hen-Hsen Huang, Yow-Ting Shiue, and Hsin-Hsi Chen. 2018. Numeral understanding in financial tweets for fine-grained crowd-based forecasting. In 2018 IEEE/WIC/ACM International Conference on Web Intelligence (WI), pages 136–143.
- Chen et al. (2019b) Chung-Chi Chen, Hen-Hsen Huang, Hiroya Takamura, and Hsin-Hsi Chen. 2019b. Numeracy-600K: Learning numeracy for detecting exaggerated information in market comments. In Proceedings of the 57th Annual Meeting of the Association for Computational Linguistics, pages 6307–6313, Florence, Italy. Association for Computational Linguistics.
- Chen et al. (2021) Zhiyu Chen, Wenhu Chen, Charese Smiley, Sameena Shah, Iana Borova, Dylan Langdon, Reema Moussa, Matt Beane, Ting-Hao Huang, Bryan Routledge, and William Yang Wang. 2021. FinQA: A dataset of numerical reasoning over financial data. In Proceedings of the 2021 Conference on Empirical Methods in Natural Language Processing, pages 3697–3711, Online and Punta Cana, Dominican Republic. Association for Computational Linguistics.
- Chung et al. (2022) Hyung Won Chung, Le Hou, Shayne Longpre, Barret Zoph, Yi Tay, William Fedus, Eric Li, Xuezhi Wang, Mostafa Dehghani, Siddhartha Brahma, Albert Webson, Shixiang Shane Gu, Zhuyun Dai, Mirac Suzgun, Xinyun Chen, Aakanksha Chowdhery, Sharan Narang, Gaurav Mishra, Adams Yu, Vincent Zhao, Yanping Huang, Andrew Dai, Hongkun Yu, Slav Petrov, Ed H. Chi, Jeff Dean, Jacob Devlin, Adam Roberts, Denny Zhou, Quoc V. Le, and Jason Wei. 2022. Scaling instruction-finetuned language models.
- Cortis et al. (2017) Keith Cortis, André Freitas, Tobias Daudert, Manuela Huerlimann, Manel Zarrouk, Siegfried Handschuh, and Brian Davis. 2017. SemEval-2017 task 5: Fine-grained sentiment analysis on financial microblogs and news. In Proceedings of the 11th International Workshop on Semantic Evaluation (SemEval-2017), pages 519–535, Vancouver, Canada. Association for Computational Linguistics.
- Devlin et al. (2019) Jacob Devlin, Ming-Wei Chang, Kenton Lee, and Kristina Toutanova. 2019. BERT: Pre-training of deep bidirectional transformers for language understanding. In Proceedings of the 2019 Conference of the North American Chapter of the Association for Computational Linguistics: Human Language Technologies, Volume 1 (Long and Short Papers), pages 4171–4186, Minneapolis, Minnesota. Association for Computational Linguistics.
- El-Haj et al. (2020) Mahmoud El-Haj, Ahmed AbuRa’ed, Marina Litvak, Nikiforos Pittaras, and George Giannakopoulos. 2020. The financial narrative summarisation shared task (FNS 2020). In Proceedings of the 1st Joint Workshop on Financial Narrative Processing and MultiLing Financial Summarisation, pages 1–12, Barcelona, Spain (Online). COLING.
- Fifty et al. (2021) Christopher Fifty, Ehsan Amid, Zhe Zhao, Tianhe Yu, Rohan Anil, and Chelsea Finn. 2021. Efficiently identifying task groupings for multi-task learning. In Advances in Neural Information Processing Systems.
- Geva et al. (2021) Mor Geva, Uri Katz, Aviv Ben-Arie, and Jonathan Berant. 2021. What’s in your head? Emergent behaviour in multi-task transformer models. In Proceedings of the 2021 Conference on Empirical Methods in Natural Language Processing, pages 8201–8215, Online and Punta Cana, Dominican Republic. Association for Computational Linguistics.
- Hazourli (2022) Ahmed Hazourli. 2022. Financialbert - a pretrained language model for financial text mining.
- Houlsby et al. (2019) Neil Houlsby, Andrei Giurgiu, Stanislaw Jastrzebski, Bruna Morrone, Quentin de Laroussilhe, Andrea Gesmundo, Mona Attariyan, and Sylvain Gelly. 2019. Parameter-efficient transfer learning for nlp.
- Kang et al. (2021) Juyeon Kang, Ismail El Maarouf, Sandra Bellato, and Mei Gan. 2021. FinSim-3: The 3rd shared task on learning semantic similarities for the financial domain. In Proceedings of the Third Workshop on Financial Technology and Natural Language Processing, pages 31–35, Online. -.
- Karimi Mahabadi et al. (2021) Rabeeh Karimi Mahabadi, Sebastian Ruder, Mostafa Dehghani, and James Henderson. 2021. Parameter-efficient multi-task fine-tuning for transformers via shared hypernetworks. In Proceedings of the 59th Annual Meeting of the Association for Computational Linguistics and the 11th International Joint Conference on Natural Language Processing (Volume 1: Long Papers), pages 565–576, Online. Association for Computational Linguistics.
- Lamm et al. (2018a) Matthew Lamm, Arun Chaganty, Christopher D. Manning, Dan Jurafsky, and Percy Liang. 2018a. Textual analogy parsing: What’s shared and what’s compared among analogous facts. In Proceedings of the 2018 Conference on Empirical Methods in Natural Language Processing, pages 82–92, Brussels, Belgium. Association for Computational Linguistics.
- Lamm et al. (2018b) Matthew Lamm, Arun Tejasvi Chaganty, Dan Jurafsky, Christopher D. Manning, and Percy Liang. 2018b. Qsrl : A semantic role-labeling schema for quantitative facts.
- Liu et al. (2019) Xiaodong Liu, Pengcheng He, Weizhu Chen, and Jianfeng Gao. 2019. Multi-task deep neural networks for natural language understanding. In Proceedings of the 57th Annual Meeting of the Association for Computational Linguistics, pages 4487–4496, Florence, Italy. Association for Computational Linguistics.
- Liu et al. (2020) Zhuang Liu, Degen Huang, Kaiyu Huang, Zhuang Li, and Jun Zhao. 2020. FinBERT: A pre-trained financial language representation model for financial text mining. In Proceedings of the Twenty-Ninth International Joint Conference on Artificial Intelligence, IJCAI-20, pages 4513–4519. Special Track on AI in FinTech.
- Maarouf et al. (2021) Ismail El Maarouf, Juyeon Kang, Abderrahim Ait Azzi, Sandra Bellato, Mei Gan, and Mahmoud El-Haj. 2021. The financial document structure extraction shared task (FinTOC2021). In Proceedings of the 3rd Financial Narrative Processing Workshop, pages 111–119, Lancaster, United Kingdom. Association for Computational Linguistics.
- Maarouf et al. (2020) Ismail El Maarouf, Youness Mansar, Virginie Mouilleron, and Dialekti Valsamou-Stanislawski. 2020. The FinSim 2020 shared task: Learning semantic representations for the financial domain. In Proceedings of the Second Workshop on Financial Technology and Natural Language Processing, pages 81–86, Kyoto, Japan. -.
- Malo et al. (2013) Pekka Malo, Ankur Sinha, Pyry Takala, Pekka J. Korhonen, and Jyrki Wallenius. 2013. Good debt or bad debt: Detecting semantic orientations in economic texts. CoRR, abs/1307.5336.
- Mao et al. (2022) Yuren Mao, Zekai Wang, Weiwei Liu, Xuemin Lin, and Pengtao Xie. 2022. MetaWeighting: Learning to weight tasks in multi-task learning. In Findings of the Association for Computational Linguistics: ACL 2022, pages 3436–3448, Dublin, Ireland. Association for Computational Linguistics.
- Mariko et al. (2020) Dominique Mariko, Hanna Abi-Akl, Estelle Labidurie, Stephane Durfort, Hugues De Mazancourt, and Mahmoud El-Haj. 2020. The financial document causality detection shared task (FinCausal 2020). In Proceedings of the 1st Joint Workshop on Financial Narrative Processing and MultiLing Financial Summarisation, pages 23–32, Barcelona, Spain (Online). COLING.
- Min et al. (2022) Sewon Min, Mike Lewis, Luke Zettlemoyer, and Hannaneh Hajishirzi. 2022. MetaICL: Learning to learn in context. In Proceedings of the 2022 Conference of the North American Chapter of the Association for Computational Linguistics: Human Language Technologies, pages 2791–2809, Seattle, United States. Association for Computational Linguistics.
- Mueller et al. (2022) David Mueller, Nicholas Andrews, and Mark Dredze. 2022. Do text-to-text multi-task learners suffer from task conflict?
- Padmakumar et al. (2022) Vishakh Padmakumar, Leonard Lausen, Miguel Ballesteros, Sheng Zha, He He, and George Karypis. 2022. Exploring the role of task transferability in large-scale multi-task learning. In Proceedings of the 2022 Conference of the North American Chapter of the Association for Computational Linguistics: Human Language Technologies, pages 2542–2550, Seattle, United States. Association for Computational Linguistics.
- Peng et al. (2020) Yifan Peng, Qingyu Chen, and Zhiyong Lu. 2020. An empirical study of multi-task learning on BERT for biomedical text mining. In Proceedings of the 19th SIGBioMed Workshop on Biomedical Language Processing, pages 205–214, Online. Association for Computational Linguistics.
- Pfeiffer et al. (2021) Jonas Pfeiffer, Aishwarya Kamath, Andreas Rücklé, Kyunghyun Cho, and Iryna Gurevych. 2021. AdapterFusion: Non-destructive task composition for transfer learning. In Proceedings of the 16th Conference of the European Chapter of the Association for Computational Linguistics: Main Volume, pages 487–503, Online. Association for Computational Linguistics.
- Pontes et al. (2022) Elvys Linhares Pontes, Mohamed Benjannet, Jose G. Moreno, and Antoine Doucet. 2022. Using contextual sentence analysis models to recognize esg concepts.
- Ponti et al. (2023) Edoardo Maria Ponti, Alessandro Sordoni, Yoshua Bengio, and Siva Reddy. 2023. Combining parameter-efficient modules for task-level generalisation. In Proceedings of the 17th Conference of the European Chapter of the Association for Computational Linguistics, pages 687–702, Dubrovnik, Croatia. Association for Computational Linguistics.
- Raffel et al. (2020) Colin Raffel, Noam Shazeer, Adam Roberts, Katherine Lee, Sharan Narang, Michael Matena, Yanqi Zhou, Wei Li, and Peter J. Liu. 2020. Exploring the limits of transfer learning with a unified text-to-text transformer. Journal of Machine Learning Research, 21(140):1–67.
- Ruder (2017) Sebastian Ruder. 2017. An overview of multi-task learning in deep neural networks. CoRR, abs/1706.05098.
- Sanh et al. (2021) Victor Sanh, Albert Webson, Colin Raffel, Stephen H. Bach, Lintang Sutawika, Zaid Alyafeai, Antoine Chaffin, Arnaud Stiegler, Teven Le Scao, Arun Raja, Manan Dey, M. Saiful Bari, Canwen Xu, Urmish Thakker, Shanya Sharma, Eliza Szczechla, Taewoon Kim, Gunjan Chhablani, Nihal V. Nayak, Debajyoti Datta, Jonathan Chang, Mike Tian-Jian Jiang, Han Wang, Matteo Manica, Sheng Shen, Zheng Xin Yong, Harshit Pandey, Rachel Bawden, Thomas Wang, Trishala Neeraj, Jos Rozen, Abheesht Sharma, Andrea Santilli, Thibault Févry, Jason Alan Fries, Ryan Teehan, Stella Biderman, Leo Gao, Tali Bers, Thomas Wolf, and Alexander M. Rush. 2021. Multitask prompted training enables zero-shot task generalization. CoRR, abs/2110.08207.
- Stickland and Murray (2019) Asa Cooper Stickland and Iain Murray. 2019. BERT and pals: Projected attention layers for efficient adaptation in multi-task learning. CoRR, abs/1902.02671.
- Vu et al. (2020) Tu Vu, Tong Wang, Tsendsuren Munkhdalai, Alessandro Sordoni, Adam Trischler, Andrew Mattarella-Micke, Subhransu Maji, and Mohit Iyyer. 2020. Exploring and predicting transferability across NLP tasks. In Proceedings of the 2020 Conference on Empirical Methods in Natural Language Processing (EMNLP), pages 7882–7926, Online. Association for Computational Linguistics.
- Wang et al. (2021) Zirui Wang, Yulia Tsvetkov, Orhan Firat, and Yuan Cao. 2021. Gradient vaccine: Investigating and improving multi-task optimization in massively multilingual models. In International Conference on Learning Representations.
- Wei et al. (2022) Jason Wei, Maarten Bosma, Vincent Zhao, Kelvin Guu, Adams Wei Yu, Brian Lester, Nan Du, Andrew M. Dai, and Quoc V Le. 2022. Finetuned language models are zero-shot learners. In International Conference on Learning Representations.
- Xing et al. (2020) Frank Xing, Lorenzo Malandri, Yue Zhang, and Erik Cambria. 2020. Financial sentiment analysis: An investigation into common mistakes and silver bullets. In Proceedings of the 28th International Conference on Computational Linguistics, pages 978–987, Barcelona, Spain (Online). International Committee on Computational Linguistics.
- Yang et al. (2020) Yi Yang, Mark Christopher Siy Uy, and Allen Huang. 2020. Finbert: A pretrained language model for financial communications. arXiv preprint arXiv:2006.08097.
- Yu et al. (2020) Tianhe Yu, Saurabh Kumar, Abhishek Gupta, Sergey Levine, Karol Hausman, and Chelsea Finn. 2020. Gradient surgery for multi-task learning. In Proceedings of the 34th International Conference on Neural Information Processing Systems, NIPS’20, Red Hook, NY, USA.
- Zhou and Srikumar (2022) Yichu Zhou and Vivek Srikumar. 2022. A closer look at how fine-tuning changes BERT. In Proceedings of the 60th Annual Meeting of the Association for Computational Linguistics (Volume 1: Long Papers), pages 1046–1061, Dublin, Ireland. Association for Computational Linguistics.
- Zhu et al. (2021) Fengbin Zhu, Wenqiang Lei, Youcheng Huang, Chao Wang, Shuo Zhang, Jiancheng Lv, Fuli Feng, and Tat-Seng Chua. 2021. TAT-QA: A question answering benchmark on a hybrid of tabular and textual content in finance. In Proceedings of the 59th Annual Meeting of the Association for Computational Linguistics and the 11th International Joint Conference on Natural Language Processing (Volume 1: Long Papers), pages 3277–3287, Online. Association for Computational Linguistics.
Appendix A Possible Questions and Answers
A.1 Are H1 and H2 proposed in our work conflict goals?
H1 encourages aggregating diverse skills for better MTL practice, while H2 suggests that the relatedness among tasks is also important, which seems contrary to H1. However, these goals do not conflict with each other because: (1) skill diversity does not imply distant inter-task relationships and vice versa (e.g., NC is well related to SC and CD in Figure 2(a) though they correspond to different skills). (2) It is possible to achieve skill diversity and good task-relatedness simultaneously: real-world MTL practice can first consider the target skill and other skills that might be supportive or in the same domain. Then select the tasks that are (qualitatively or quantitatively) closely related to the target task to achieve better MTL performance.
A.2 Our work mainly addresses Financial NLP. Are the conclusions generalizable to other domains?
Although we only provide analyses in Financial NLP, the heuristics for MTL practice are generic for other domains. For H1, non-target skills in the same domain are potentially helpful as various skills are based on similar data. For H2, the qualitative and quantitative analyses for task-relatedness are domain agnostic, meaning that we can select the most related tasks from those with diversified skills. For H3, continuously increasing the aggregation size will finally reach a threshold that overwhelms some tasks if the shared capacity is fixed.
Appendix B GPT-3 Prompts
In Table 1 we present the GPT-3 zero-shot and few-shot performance on two Financial NLP tasks. We use the official API provided by OpenAI444https://openai.com/api/ to access GPT-3. We choose the GPT-3 checkpoint Davinci-003 to conduct the experiments (completion mode, max token , temperature ). The example prompts we use for TSA and SC are illustrated in Table 5.
| Task | Example Prompts | Label | |||||||||||||||||
|---|---|---|---|---|---|---|---|---|---|---|---|---|---|---|---|---|---|---|---|
| TSA zero-shot |
|
0.588 | |||||||||||||||||
| SC zero-shot |
|
Neutral | |||||||||||||||||
| TSA few-shot |
|
0.588 | |||||||||||||||||
| SC few-shot |
|
Neutral |
Appendix C Experimental Details
MTL Batching Scheme: During MTL, we first randomly batchify training data of all tasks. Then, we randomly mix the mini-batches and pass them to the MTL data loader. This method is equivalent to the temperature-based batch sampling scheme of Karimi Mahabadi et al. (2021) where temperature (i.e., each task is sampled proportional to its data size). We choose as FinDATA tasks are not highly unbalanced in data size.
Data Preprocessing: SC and FSRL are in nature text classification and token classification tasks. Thus we use the raw texts from their datasets as inputs. NC, NAD, and TSA are text classification tasks, but they also require target companies or target numbers as inputs. Therefore, we use “|COMPANY|” to denote target companies and “<NUMBER>” to denote target numbers in input texts. CD is originally a span prediction task. For simplicity, we model it as a token classification task by converting the span labels to BIO tags (i.e., beginning and ending cause/effect spans to “B-CAUSE I-CAUSE…” and “B-EFFECT I-EFFECT…”).
Hyperparameters: All models are fine-tuned with a initial learning rate of , warm up steps of , and weight decay of . Batches sizes we used for TSA, SC, NC, NAD, FSRL, and CD are , , , , , and correspondingly. For the prediction header, we use a single feed-forward layer followed by Softmax.
| Metric | BERT cased | BERT uncased | Y-FinBERT | FinancialBERT | P-FinBERT |
|---|---|---|---|---|---|
| Cosine Similarity | |||||
| RMSE |
Evaluation Metrics Selection and Reporting: The evaluation metrics are used not only for testing but also for best checkpoint selection during validation. Therefore, we report single metrics for all results to reflect MTL’s effect on each task. We choose Accuracy for SC, NC, and NAD since these datasets have no severe label imbalance. For simplicity, we equivalently model CD, which is originally a span prediction task, as a token classification task, and use Accuracy as the metric. TSA is officially measured with cosine similarity (Cortis et al., 2017). We find RMSE, as a regular metric for regression tasks, has a high correlation with cosine similarity (see Table 6). Therefore, RMSE is suitable for TSA measurement. Besides, we avoid reporting average scores across tasks like related work because it makes no sense to average RMSE with Accuracy and F1 scores.
Evaluation Tools: We use sklearn 1.0.2 for sequence classification evaluation, and seqeval 1.2.2 for token classification evaluation.
GPU Usage: Experiments are trained on NVIDIA RTX2080 GPUs. A single run of STL experiments takes 4 to 16 GPU hours (4 GPU hours for the small datasets; 16 GPU hours for the large ones). A single run of MTL experiments takes 16 to 96 GPU hours (16 GPU hours for the smallest subsets of FinDATA, e.g., SC and TSA; 96 GPU hours for full FinDATA).
Appendix D Financial NLP Datasets
The detailed information of Financial NLP datasets discussed in Section 3.2 is shown in Table 7. We only cover English datasets, and include the English subset for those multilingual datasets (e.g., FNS and FinTOC). Most of the datasets have less than K data points in total, with fewer samples for training. Some data sizes are even fewer than K.
| Dataset | Task | |Total| | Text Source |
|---|---|---|---|
| Financial PhraseBank (Malo et al., 2013) | sentiment classification | 4,837 | Financial news |
| StockSen (Xing et al., 2020) | sentiment classification | 20,675 | Financial tweets |
| SemEval-2017 task-5-1 (Cortis et al., 2017) | target-based sentiment analysis | 2,510 | Financial tweets |
| SemEval-2017 task-5-2 (Cortis et al., 2017) | target-based sentiment analysis | 1,647 | Financial news |
| FNS (El-Haj et al., 2020) | Summarization | 12,796 | UK annual report |
| FinQA (Chen et al., 2021) | Numeracy question answering | 8,281 | Earning reports |
| TAT-QA (Zhu et al., 2021) | Tabular question answering | 16,552 | Financial reports |
| FinNum-1 (Chen et al., 2018) | Number classification | 8,868 | Financial tweets |
| FinNum-2 (Chen et al., 2019a) | Number attachement | 10,340 | Financial tweets |
| FinNum-3 (Chen et al., 2020) | Number classification | 9,528 | Analyst reports |
| Numeracy-600K subtask-1 (Chen et al., 2019b) | Number magnitude prediction | 600,000 | Market comments |
| Numeracy-600K subtask-2 (Chen et al., 2019b) | Number magnitude prediction | 600,000 | Financial news |
| TAP (Lamm et al., 2018a) | Quantitative SRL | 1,100 | Financial news |
| FinCausal (Mariko et al., 2020) | Causal effect detection | 1,126 | Financial news |
| FinSim-2 (Maarouf et al., 2020) | Financial concept understanding | 199 (concepts) | - |
| FinSim-3 (Kang et al., 2021) | Financial concept understanding | 1,394 (concepts) | - |
| FinTOC (Maarouf et al., 2021) | TOC extraction | 72 (documents) | Financial prospectuses |
Appendix E Dataset Splits
For FinDATA tasks, we use the official test set and development set if they exist and are publicly available: for TSA and FSRL, we use official test sets; for NC and NAD, we use both official test and development sets. If there is no available official test or development set, we split the datasets with a random seed of : for SC, we split for test and for validation. For TSA, we split for validation. For FSRL, we split for validation. For CD, we split for test and for validation. All these data splits are available in our GitHub repository.
Appendix F Gradient Analysis
We are curious whether gradient similarities reflect task-relatedness. Furthermore, do gradient conflicts/similarities interpret why some task aggregation works better than others? During MTL, we record each task’s gradient (averaged over the whole training set) every 2000 training steps. Then we calculate the pairwise cosine similarity between the gradients of all task pairs.
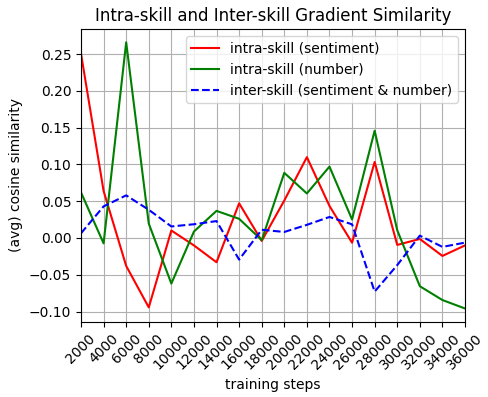
Gradient similarity fails to reflect task-relatedness: Figure 6 shows the gradient similarity within sentiment and number tasks (intra-skill gradient similarity), and the average pairwise gradient similarity in-between the sentiment and number tasks (inter-skill gradient similarity). It can be observed that intra-skill gradients are not significantly more similar than inter-skill gradients, indicating that gradient similarity might not be a good measurement for task-relatedness.
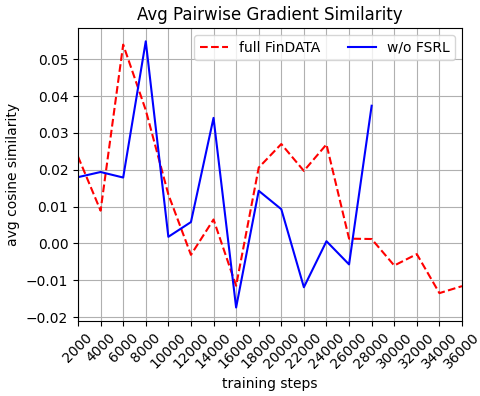
Gradient similarity does not indicate transferability within task aggregation: Figure 7 shows the average pairwise gradient similarity of two MTL systems with different task aggregation: one is trained on full FinDATA, and the other ablates FSRL. Although ablating FSRL leads to worse scores on all tasks (see Table 3), the gradient conflict of “w/o FSRL” is not significantly higher than full FinDATA. Therefore, gradient conflicts/similarities are not a good indicator of task aggregation quality.
Appendix G MTL Pre-training & Unseen task Generalization
| Method | Numeracy-600K few-shot | StockSen few-shot | ||||
|---|---|---|---|---|---|---|
| Market Comment | News Headline | - | ||||
| FinBERT (Vanilla) | ||||||
| FinBERT (MTL) | ||||||
MTL pre-training may increase the model’s generalizability to unseen tasks Aghajanyan et al. (2021); Karimi Mahabadi et al. (2021); Ponti et al. (2023), which might be extremely helpful when there is a shortage in target training data (a few-shot setting). Therefore, we test the few-shot generalizability of our MTL systems on two unseen tasks: StockSen and Numeracy-600K. StockSen is a binary (positive or negative) sentiment classification dataset on financial tweets. Numeracy-600K classifies numbers into one of seven magnitudes. It has two subtasks on different domains (financial news and market comment). We first train the models on FinDATA for steps. Then we resume the shared encoder and fine-tune it on the target unseen task for epochs, reporting the best checkpoint’s score. We use a few-shot setting (randomly sample training and validation data points) for unseen tasks to stimulate the lack of training data in the target task. For test sets, we split (with a random seed of ) K samples ( of data) for Numeracy-600K and K samples (official development set) for StockSen. The results are shown in Table 8. In all tasks, the MTL-pre-trained system beats vanilla FinBERT when generalizing to unseen tasks.
Appendix H Importance of Freezing Pretrained Model
To illustrate the importance of freezing the pre-trained model, we first compare SPAL-FinBERT (SPAL hidden size = 204) with an ablation setting where FinBERT is not frozen. The comparison is shown in Table 9, where unfreezing FinBERT compromises the MTL performance drastically on most tasks (CD prefers larger shared capacity and thus benefits from unfreezing).
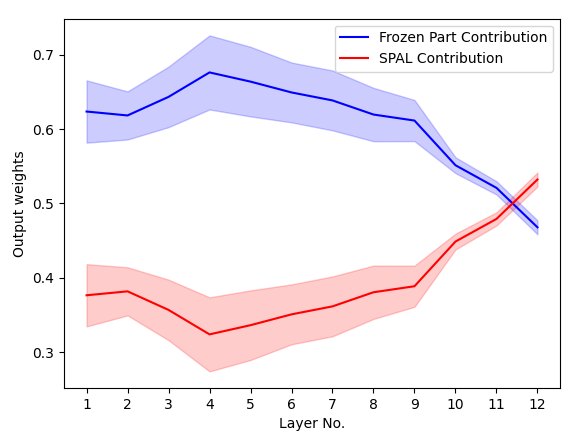
Then we add weighting parameters to probe the frozen FinBERT’s contribution to the layer outputs. Figure 8 shows the probing architecture. We add probing parameters and , which weigh the frozen FinBERT output and the SPAL output. After MTL, the contribution of each structure can be measured by the final (softmaxed) weights. The results are shown in Figure 9. In all layers except the last layer, the frozen FinBERT layers contribute more to the output than PALs, illustrating the importance of the frozen part.
| Task | TSA | SC | NC | NAD | FSRL | CD | ||
|---|---|---|---|---|---|---|---|---|
|
||||||||
|
Appendix I Task-relatedness Examples
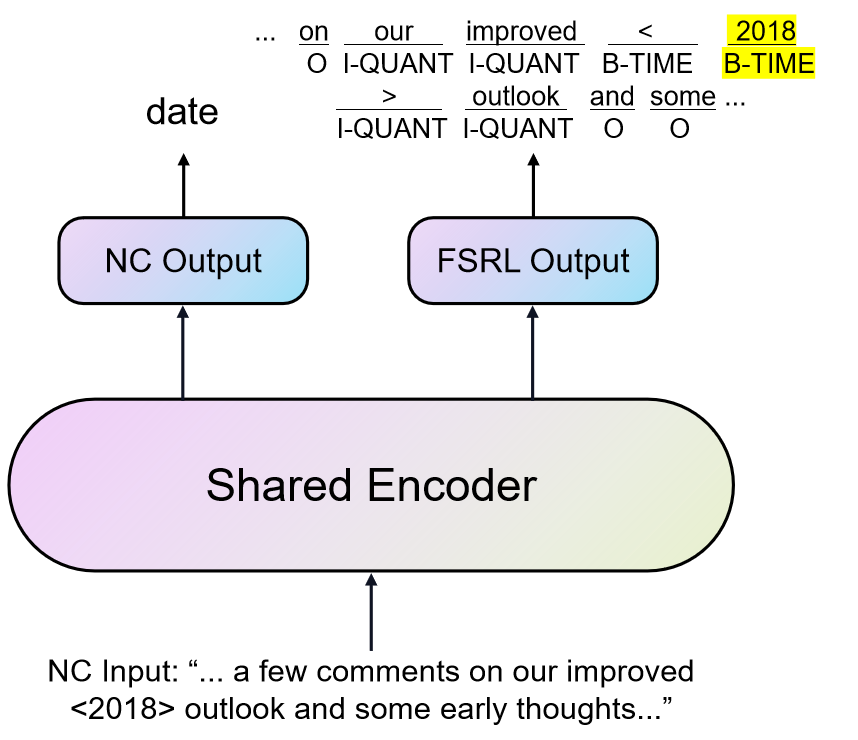
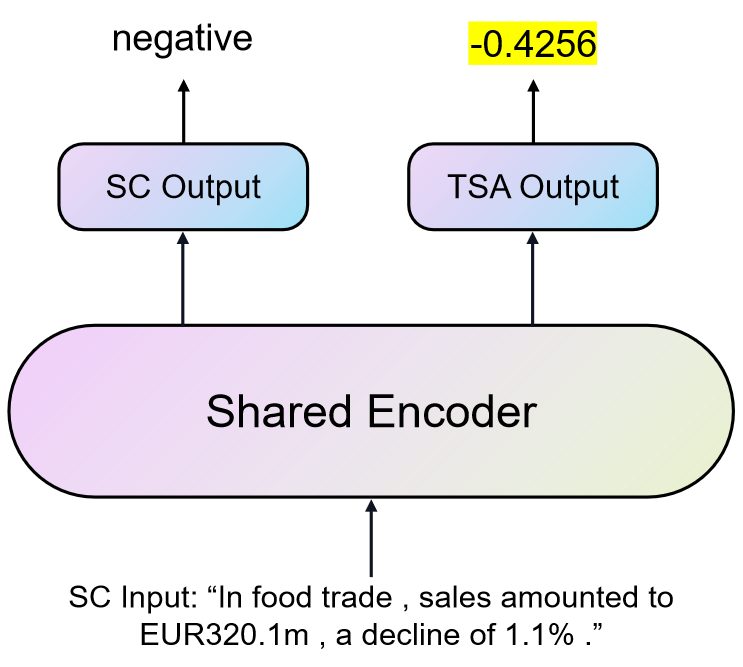
Through MT fine-tuning, the shared encoder understands an input sentence from comprehensive aspects that positively transfer to each other. To probe the explicit transfer, we analyze the non-target output headers’ outputs to illustrate that the inputs are understood comprehensively. For example, Figure 10(a) shows that the FSRL header correctly identifies the semantic role of “2018” in an NC input. Such time awareness may benefit NC when classifying the date numbers. Similarly, Figure 10(b) shows that the TSA header assigns proper sentiment score to an SC input. More examples of explicit transfer are shown below:
Positive transfer from TSA to SC (target header: SC, non-target header: TSA). All examples are from SC test set:
-
•
Finnish Aldata Solution has signed a contract of supply its G.O.L.D. system to two French retail chains. Golden label: positive; TSA output: 0.40566313
-
•
Kaupthing Bank will publish its annual results for 2007 before markets open on Thursday 31 January. Golden label: neutral; TSA output: -0.00095879
-
•
In food trade , sales amounted to EUR320.1 m , a decline of 1.1% . Golden label: negative; TSA output: -0.42561457
-
•
The company did not distribute a dividend in 2005. Golden label: neutral; TSA output: -0.35266992
-
•
Panostaja did not disclose the purchase price. Golden label: neutral; TSA output: 0.02710678
-
•
Operating profit rose to EUR 13.5 mn from EUR 9.7mn in the corresponding period in 2006. Golden label: positive; TSA output: 0.42477337
-
•
As production of other products will continue normally, temporary lay-offs concern simultaneously at most 80 employees. Golden label: negative; TSA output: -0.49556375
-
•
According to Viking Line’s Managing Director, Nils-Erik Eklund, the company’s Board of Directors is very satisfied with Viking Line’s performance. Golden label: positive; TSA output: 0.28375068
-
•
The port operator, however, favors retaining the port fees in 2010, citing the owner, the government of Estonia, committing the port to pay EEK 400mn (EUR 25.56 mn USD 36.44 mn) in dividends to the state in 2009 and another EEK 300mn in 2010. Golden label: neutral; TSA output: 0.05767085
-
•
Uponor maintains its full-year guidance for 2010. Golden label: neutral; TSA output: 0.08272883
Positive transfer from FSRL to NC (date classification). Semantic role labeling outputs are in a form of [(token, label)] entries. Time semantic roles are bold. All examples are from NC test set:
-
•
Looking ahead the 150000 people at Optum are incredibly enthusiastic about <2019> and our opportunities for longer-term growth and… FSRL output: [(’looking’, ’O’), (’ahead’, ’O’), (’the’, ’O’), (’150000’, ’I-WHOLE’), (’people’, ’I-WHOLE’), (’at’, ’I-WHOLE’), (’optum’, ’B-SOURCE’), (’are’, ’O’), (’incredibly’, ’O’), (’enthusiastic’, ’O’), (’about’, ’O’), (’<’, ’B-TIME’), (’2019’, ’B-TIME’), (’>’, ’I-QUANT’), (’and’, ’O’), (’our’, ’O’), (’opportunities’, ’O’), (’for’, ’O’), (’longer’, ’O’), (’-’, ’O’), (’term’, ’O’), (’growth’, ’O’), (’and’, ’O’) …
-
•
Now before I turn it over to Carroll just a few comments on our improved <2018> outlook and some early thoughts on 2019 … FSRL output: [(’now’, ’B-TIME’), (’before’, ’O’), (’i’, ’O’), (’turn’, ’O’), (’it’, ’O’), (’over’, ’O’), (’to’, ’O’), (’carroll’, ’O’), (’just’, ’O’), (’a’, ’O’), (’few’, ’O’), (’comments’, ’O’), (’on’, ’O’), (’our’, ’I-QUANT’), (’improved’, ’I-QUANT’), (’<’, ’B-TIME’), (’2018’, ’B-TIME’), (’>’, ’I-QUANT’), (’outlook’, ’I-QUANT’), (’and’, ’O’), (’some’, ’O’), (’early’, ’O’), (’thoughts’, ’I-QUANT’), (’on’, ’O’), (’2019’, ’I-QUANT’) …
-
•
Now before I turn it over to Carroll just a few comments on our improved 2018 outlook and some early thoughts on <2019.> … FSRL output: [(’now’, ’O’), (’before’, ’O’), (’i’, ’O’), (’turn’, ’O’), (’it’, ’O’), (’over’, ’O’), (’to’, ’O’), (’carroll’, ’O’), (’just’, ’O’), (’a’, ’O’), (’few’, ’O’), (’comments’, ’O’), (’on’, ’O’), (’our’, ’I-QUANT’), (’improved’, ’I-QUANT’), (’2018’, ’I-QUANT’), (’outlook’, ’I-QUANT’), (’and’, ’O’), (’some’, ’O’), (’early’, ’O’), (’thoughts’, ’I-QUANT’), (’on’, ’I-QUANT’), (’<’, ’I-TIME’), (’2019’, ’I-TIME’), (’.’, ’I-TIME’), (’>’, ’I-TIME’)…
Appendix J FinDATA Examples
In this section we provide examples for each FinDATA task:
TSA: (Cortis et al., 2017) the target companies are enclosed by “| |”:
-
•
NYSE owner |ICE| considers offer for LSE. Label: 0.096
-
•
NYSE owner ICE considers offer for |LSE|. Label: 0.396
-
•
|Diageo| sales disappoint as currency and comparatives leave bitter taste. Label: -0.545
-
•
AB InBev attacks |SABMiller| bid rebuffal. Label: -0.158
-
•
Are ARM Holdings plc, |Domino’s Pizza Group plc| and ASOS plc 3 must-have growth stocks?. Label: 0.063
-
•
Drugmaker |Shire| to buy Baxalta for $32 billion after 6-month pursuit. Label: 0.437
-
•
Drugmaker Shire to buy |Baxalta| for $32 billion after 6-month pursuit. Label: 0.75
-
•
Centrica extends gas deals with Gazprom, |Statoil|. Label: 0.239
-
•
|Aggreko| 2015 Profit Declines - Quick Facts. Label: -0.441
-
•
|HSBC| shakes up board with two new business chiefs, three departures. Label: -0.074
SC (Malo et al., 2013):
-
•
The business to be divested generates consolidated net sales of EUR 60 million annually and currently has some 640 employees. Label: neutral
-
•
Svyturys-Utenos Alus, which is controlled by the Nordic group Baltic Beverages Holding (BBH), posted a 6.1 percent growth in beer sales for January-September to 101.99 million liters. Label: positive
-
•
The Department Store Division’s sales fell by 8.6% to EUR 140.2 mn. Label: negative
-
•
Production capacity will rise gradually from 170,000 tonnes to 215,000 tonnes. Label: positive
-
•
Rautalinko was resposnible also for Mobility Services, and his job in this division will be continued by Marek Hintze. Label: neutral
-
•
Circulation revenue has increased by 5% in Finland and 4% in Sweden in 2008. Label: positive
-
•
The changes will take effect on 1 January 2010, and they are not estimated to have an impact on the number of employees. Label: neutral
-
•
F-Secure Internet Security 2010 is a security service for surfing the web, online banking and shopping, e-mail, and other online activities. Label: neutral
-
•
Earnings per share (EPS) were EUR0.03, up from the loss of EUR0.083. Label: positive
-
•
Production capacity will increase from 36000 to 85000 tonnes per year and the raw material will continue to be recycled paper and board. Label: positive
NC: (Chen et al., 2020) the targeted numbers are enclosed by “< >”:
-
•
Finally we experienced roughly $<104> million of hurricane-related expenses in the quarter for items like people-cost increased security in our affected stores and storm damage. So while our year-over-year sales growth was positively impacted by the hurricanes our operating profit was negatively impacted by $51 million. Label: money
-
•
In Asia we expect to acquire 51% of our Philippines bottler from Coca-Cola FEMSA during the fourth quarter. This will become a part of our Bottling Investments Group which is now comprised primarily of Southwest and Southeast Asian bottlers. These <2>transactions should roughly offset each other resulting in a minimal structural impact in our P&L in 2019. Label: money Label: quantity_absolute
-
•
From a capital allocation perspective year-to-date we have generated $6.3 billion of free cash flow returned $<8.6>billion to shareholders including $2.8 billion in dividends and $5.8 billion in buybacks repurchasing 117 million shares. Label: money
-
•
Next on Aviation which had another great quarter. Orders of $8.8 billion were up 12%. Equipment orders grew 20% driven by the continued strong momentum of the LEAP engine program up 56% versus the prior year. Military engine orders were up 69% driven by the F414 and service orders grew 7%. Revenues of $8.5 billion grew <21>%. Equipment revenues were up 13% on higher commercial engines partially offset by lower military volume. Label: relative
-
•
We’ll release 2 new movies from Pixar in fiscal <2018>. We’re thrilled with the early reaction to Coco which opens at Thanksgiving and we’re also looking forward to the summer release of The Incredibles 2. Label: date
-
•
I would like to remind you that some of the statements that we make during today’s call may be considered forward-looking statements within the meaning of the safe harbor provision of the U.S. Private Securities Litigation Reform Act of <1995>. Label: other
-
•
We ended 2017 with franchised restaurants representing <92>% of our total restaurant base up from 81% 3 years ago. As a result franchise margins now comprise more than 80% of our total restaurant margin dollars. For the fourth quarter franchise margin dollars increased across all segments reflecting sales-driven performance and the shift to a more heavily franchised system. Label: absolute
-
•
Today we announced that we will increase our quarterly dividend by 15% or by $0.07 to $0.55 per share beginning in the first quarter of 2019. In addition, the board has approved an additional $<10> billion share repurchase authorization giving us approximately $18 billion in share repurchase capacity. Label: money
-
•
Looking back on 2017 I could not be more proud of our team and all they have accomplished. As I look to our <50>th year I’m more optimistic and confident than I’ve ever been about Intel’s future. Label: quantity_absolute
-
•
Non-GAAP gross margin was <76>% in the quarter an increase of roughly 70 basis points versus the third quarter of 2016. Favorable product mix driven by KEYTRUDA and ZEPATIER was the largest contributor to the year-over-year improvement. Non-GAAP operating expenses of $4.2 billion increased 4% year-over-year primarily driven by higher R&D expense reflecting increased investments in early drug development. Taken together we earned $1.11 per share on a non-GAAP basis up 4% excluding exchange. Note that our GAAP EPS loss of $0.02 reflects the charge of $2.35 billion related to the formation of the strategic oncology collaboration with AstraZeneca announced earlier in the quarter. Label: absolute
NAD: (Chen et al., 2019a) target numbers and cash tags are indicated by “< >” and “| |” correspondingly:
-
•
$|XXII| Scott Gottlieb, Commissioner of FDA speech transcript from November <3>rd, less than 2 months left in year then. Label: attached
-
•
$|DPW| that was quite a roller coaster. Glad it ended well. Should see <5>in 7 days Label: attached
-
•
Took me <5>minutes to conclude: #Snoozefest \ud83d \ude34\ud83d \ude34 \ud83d \ude34 \ud83d \ude34 Advancers 6 to Decliners 5 NYSE + NASDAQ $|SPY| $QQQ $DIA $IWM Label: unattached
-
•
Take moment <2>note $Crypto Superiority trades 24/7 365 No dead time 4 Thanksgiving $BTC.X $LTC.X $|ETH.X| $DASH.X $XRP.X $BCH.X $TSLA $MNKD Label: unattached
-
•
2nd TP for $|JDST| is 94.05 according to my algo. Take it to the bank. Gold headed <4> major intermediate bottom b4 spike in Jan 2018. $JNUG Label: unattached
-
•
2nd TP for $|JDST| is 94.05 according to my algo. Take it to the bank. Gold headed 4 major intermediate bottom b4 spike in Jan |2018|. $JNUG Label: unattached
-
•
$|BABA| hit +$<3>pre-market - Futures up 100 - $BSTI Big Buying @ close after Rebound Holds 2nd day Heading Back to $13 Label: attached
-
•
$|BABA| hit +$3 pre-market - Futures up <100>- $BSTI Big Buying @ close after Rebound Holds 2nd day Heading Back to $13 Label: attached
-
•
$|BABA| hit +$3 pre-market - Futures up 100 - $BSTI Big Buying @ close after Rebound Holds <2>nd day Heading Back to $13 Label: attached
-
•
$|BABA| hit +$3 pre-market - Futures up 100 - $BSTI Big Buying @ close after Rebound Holds 2nd day Heading Back to $<13> Label: attached
FSRL: (Lamm et al., 2018a) we use different colors to denote different semantic roles: purple for WHOLE, red for THEME, blue for MANNER, forestgreen for VALUE, orange for TIME, goldenrod for QUANT, pink for AGENT, cyan for SOURCE, and sepia for CAUSE. For a detailed definition of each semantic role, please refer to Lamm et al. (2018b).
-
•
Commodities: Dow Jones futures index 129.72, off 0.15; spot index 130.16, up 0.91.
-
•
Between 50% and 75% of today’s workers are covered by such plans, up from 5% five years ago.
-
•
Cary Computer, which currently employs 241 people, said it expexts a work force of 450 by the end of 1990.
-
•
Colgate-Palmolive advanced 1 5/8 to 63 after saying it was comfortable with analysts’ projections that third-quarter net income from continuing operations would be between 95 cents and $1.05 a share, up from 69 cents a year ago.
-
•
In addition, CMS reported third-quarter net of $68.2 million, or 83 cents a share, up from $66.8 million, or 81 cents a share, a year ago.
-
•
Chateau Yquem, the leading Sauternes, now goes for well over $100 a bottle for a lighter vintage like 1984; the spectacularly rich 1983 runs $179.
-
•
For the nine months, Arco reported net income of $1.6 billion, or $8.87 a share, up 33% from $1.2 billion, or $6.56 a share a year earlier.
-
•
Citing its reduced ownership in the Lyondell Petrochemical Co., Atlantic Richfield reported that net income slid 3.1% in the third quarter to $379 million, or $2.19 a share, from $391 million, or $2.17 a share, for the comparable period last year.
-
•
Quarter revenue was $232.6 million, up 12% from $206 million last year.
-
•
Life insurers fared similarly, with Legal & General advancing 3 to 344, although Prudential fell 2 to 184 1/2.
CD: (Mariko et al., 2020) we use blue to denote causes, and red to denote effects:
-
•
Florida is unique in that it also draws a large proportion of higher net-worth individuals - more than 85 percent of its net inflow of income came from people earning at least six-figures.
-
•
CLICK HERE TO GET THE FOX BUSINESS APP Data from the U.S. Census Bureau showed that while Florida received more movers than any other state last year, New York’s outflows to the Sunshine State were the highest - 63,772 people.
-
•
New York had the third-largest outflows of any state, with 452,580 people moving out within the past year. Individuals earning $650,000 can save more than $69,700 in taxes per year by moving from New York to Florida.
-
•
The stock increased 1.02% or $0.23 during the last trading session, reaching $22.69.
-
•
(NASDAQ:SBRA) has declined 1.62% since September 21, 2018 and is downtrending. It has underperformed by 1.62% the S&P500.
-
•
Weyerhaeuser Company (NYSE:WY) has declined 25.53% since September 21, 2018 and is downtrending. It has underperformed by 25.53% the S&P500.
-
•
After $0.46 actual EPS reported by Sabra Health Care REIT, Inc. for the previous quarter, Wall Street now forecasts 2.17% EPS growth.
-
•
Investors sentiment increased to 1.25 in Q2 2019. Its up 0.38, from 0.87 in 2019Q1. It increased, as 23 investors sold SBRA shares while 68 reduced holdings.
-
•
It also reduced its holding in Qualcomm Inc. (NASDAQ:QCOM) by 24,294 shares in the quarter, leaving it with 158,167 shares, and cut its stake in Wells Fargo& Co (New) (NYSE:WFC).
-
•
Investors sentiment decreased to 1.02 in 2019 Q2. Its down 0.11, from 1.13 in 2019Q1. It worsened, as 43 investors sold WY shares while 242 reduced holdings.