Variability and Possible Rapid Evolution of the Hot Post-AGB Stars Hen 3-1347, Hen 3-1428, and LSS 4634
We present the results of spectroscopic and photometric observations for three hot southern-hemisphere post-AGB objects, Hen 3-1347 = IRAS 17074–1845, Hen 3-1428 = IRAS 17311–4924, and LSS 4634 = IRAS 18023–3409. In the spectrograms taken with the 1.9-m telescope of the South African Astronomical Observatory (SAAO) in 2012, we have measured the equivalent widths of the most prominent spectral lines. Comparison of the new data with those published previously points to a change in the spectra of Hen 3-1428 and LSS 4634 in the last 20 years. Based on ASAS data, we have detected rapid photometric variability in all three stars with an amplitude up to 0.3 mag, 0.4 mag in the band. A similarity between the patterns of variability for the sample stars and other hot protoplanetary nebulae is pointed out. We present the results of observations for Hen 3-1347, according to which the star undergoes rapid irregular brightness variations with maximum amplitudes =0.25 mag, =0.25 mag, and =0.30 mag and shows color-magnitude correlations. Based on archival data, we have traced the photometric history of the stars over more than 100 years. Hen 3-1347 and LSS 4634 have exhibited a significant fading on a long time scale. The revealed brightness and spectrum variations in the stars, along with evidence for their enhanced mass, may be indicative of their rapid post-AGB evolution.
Keywords: post-AGB stars, planetary nebulae, photometric and spectroscopic observations, photometric variability.
INTRODUCTION
The post-asymptotic giant branch (post-AGB) phase of evolution of intermediate-mass stars () is the transition period from the asymptotic giant branch (AGB) to planetary nebula nuclei.
Protoplanetary nebulae are stars of spectral types from late G to early B with extended atmospheres surrounded by dust envelopes formed through intense mass loss at previous evolutionary phases. The dust envelopes gradually dissipate, which is reflected in the visibility of the stars at optical wavelengths.
The studies of post-AGB stars were begun in the mid-1980s after the appearance of the IRAS survey. These objects were initially suspected and subsequently revealed among the supergiant stars with dust envelopes detected in this survey (Parthasarathy and Pottasch 1986; van der Veen et al. 1989; Hrivnak et al. 1989).
An important feature of post-AGB stars is their photometric variability. The type of variability depends on the star’s effective temperature, i.e., on its position on the horizontal evolutionary track. In particular, F-G supergiants with infrared excesses exhibit semiregular brightness variations with time scales from 40 to 130 days caused by their pulsational instability (Hrivnak and Lu 2000; Kiss et al. 2007; Arkhipova et al. 2010; Hrivnak et al. 2010). Hotter stars, early B supergiants with infrared excesses, exhibit photometric variability without any distinct periodicity with amplitudes from 0m.2 to 0m.4 in the band on time scales from one day to several days (Hrivnak and Lu 2000) and a color-magnitude relation that cannot be explained by temperature variations. An unstable stellar wind is considered as the main cause of the photometric variability in protoplanetary nebulae (Arkhipova et al. 2012). Studies of the photometric instability and radial velocity curves have revealed quite a few binary stars among the post-AGB objects (Van Winckel et al. 2009, 2012).
This paper is devoted to investigating three southern-hemisphere hot post-AGB stars for which there have been no data on their photometric behavior until the present time.
IRAS 17074–1845. The star was discovered by Henize (1976) as a result of his survey of southern-hemisphere emission-line objects and was designated as Hen 3-1347. Subsequently, the object was identified with the infrared source IRAS 17074–1845 (Dong and Hu 1991). Based on the similarity between the far-infrared colors of the star and those of planetary nebulae and taking into account its high Galactic latitude () and spectral type Be, Parthasarathy (1993) classified the star as a hot post-AGB object.
IRAS 17311–4924. Henize (1976) discovered this object as an emission-line star and designated it as Hen 3-1428. Subsequently, data from the IRAS point source catalogue (Beichmann et al. 1985) revealed a far-infrared excess in the star. Based on these data, Parthasarathy and Pottasch (1989) established that the object is in the post-AGB phase of evolution.
IRAS 18023–3409. The star CD-34 12448 was included by Stephenson and Sanduleak (1971) in the luminous star catalogue as the object LSS 4634 of spectral type BO+. Based on their analysis of the data from the IRAS point source catalogue (Beichmann et al. 1985), Preite-Martinez (1989) included IRAS 18023–3409 in the list of possible new planetary nebulae.
In this paper, we analyzed the ASAS photometric data for all three stars based on which we detected photometric variability that is also typical of other hot post-AGB stars. In addition, we carried out observations for one of the objects, IRAS 17074–1845, that confirmed the photometric instability of the star.
An important task in investigating post-AGB stars is to reveal as many rapidly evolving objects as possible to refine their theoretical evolutionary tracks.
Theoretical calculations of the post-AGB evolution of
intermediate-mass stars predict
comparatively short transition
times of the star from an AGB giant to a hot subdwarf and then to
a white dwarf. Depending on the initial mass of the star, the mass
of the remnant star, and the history of mass loss on the AGB, the
HR-diagram crossing time is estimated to be from 100 to several
thousand years (Blöcker 1995). Evolutionary changes in a
reasonable time can be noticed only in the most massive post-AGB
objects.
Objects evolving ”before our very eyes” have already been discovered among the hot post-AGB stars. These include, for example, SAO 244567 (Parthasarathy et al. 1993; Arkhipova et al. 2013a) and IRAS 18062+2410 (Arkhipova et al. 1999).
For our study, we selected post-AGB stars that, according to the estimates by Mello et al. (2012), have masses exceeding the mean values for planetary nebula nuclei and that, consequently, can manifest themselves as rapidly evolving objects. For this purpose, we traced the photometric history of the stars over more than 100 years and analyzed the spectroscopic data over the last 20 years.
Table 1 provides basic information about the objects, namely their designations, equatorial and Galactic coordinates, magnitudes, and spectral types. All three stars have the spectra of B-type emission-line supergiants, lie at high Galactic latitudes, and are infrared (IR) sources. The double-humped spectral energy distribution for these objects is attributable to the radiation from the stars themselves and the surrounding cold dust envelopes composed of the material ejected on the AGB. The mass loss from the stars with a rate of yr-1 also continues in the post-AGB phase (Gauba and Parthasarathy 2004).
| IRAS | (2000.0) | (2000.0) | Sp | ||||
|---|---|---|---|---|---|---|---|
| 17074–1845 | BD–18 4436 | 17:10:24 | –18:49:01 | 04.1 | +12.3 | 11.461 | B3IIIe3, B5Ibe4 |
| Hen 3-1347 | |||||||
| LSE 3 | |||||||
| 17311–4924 | CD–49 11554 | 17:35:02 | –49:26:26 | 341.4 | –09.0 | 10.742 | B1IIe5, B3Ie6, B1Iae4 |
| Hen 3-1428 | |||||||
| LSE 76 | |||||||
| 18023–3409 | CD–34 12448 | 18:05:38 | –34:09:30 | 357.6 | –06.3 | 12.081 | B9Ia+e7, B2IIIe5 |
| LSS 4634 |
1 Hog et al. (2000),, 2 Klare and Neckel (1977), 3 Gauba et al. (2003), 4 Carmona et al. (2010), 5Parthasarathy et al. (2000), 6Suárez et al. (2006), 7Vijapurkar and Drilling (1993).
The objects were included in the Toruń catalogue of post-AGB and related objects (Szczerba et al. 2007). IRAS 17074–1845 and IRAS 17311–4924 are contained in the spectroscopic atlas of Suárez et al. (2006) as transition sources from post- AGB stars to planetary nebulae. Previously, these objects were investigated together with other hot post-AGB stars. Gauba et al. (2003) constructed the spectral energy distribution for them and estimated the dust temperature, the distances to the stars, the mass loss rates, and the dynamical ages from the tip of the AGB. Based on ultraviolet (UV) observations, Gauba and Parthasarathy (2003) determined the parameters of the stars and estimated their masses by comparing their data with theoretical evolutionary tracks from Schönberner (1983, 1987). The properties of the dust envelope around IRAS 17074–1845 were investigated by Cerrigone et al. (2009) based on IR photometry and spectroscopy obtained with the Spitzer Space Telescope.
SPECTROSCOPIC OBSERVATIONS
Our spectroscopic observations of the program objects were carried out in May 2012 at the 1.9-m telescope of the South African Astronomical Observatory (SAAO) with a long-slit spectrograph at the Cassegrain focus. The slit was in length and 1.5′′ in width; the scale along the slit was 0.7′′/pixel. The detector was an SITe 2661798-pixel CCD array. A 300 lines/mm grism was used in the spectral range 3500–7200 Å. The actual spectral resolution was FWHM = 4.5 Å. Spectra of a Cu–Ar-filled lamp were taken to calibrate the wavelengths after each observation. Bias and flat-field images were also obtained for each night of observations to perform the standard reduction of two-dimensional spectra. The log of spectroscopic observations is given in Table 2, where the object names, dates of observation, exposure times, and airmasses are listed. Figure 1 shows the spectra of the program objects normalized to the continuum in the range 3750–7500 Å.

| IRAS | Date | Exp, s | |
|---|---|---|---|
| 17074–1845 | 2012-05-12 | 600 | 1.04 |
| 2012-05-22 | 900 | 1.15 | |
| 17311–4924 | 2012-05-12 | 2600 | 1.05 |
| 18023–3409 | 2012-05-11 | 600 | 1.05 |
One of the objects, IRAS 17074–1845, was also observed with a 125-cm reflector at the Crimean Station of the Sternberg Astronomical Institute (Moscow State University) on May 22, 2012, using a spectrograph with a 600 lines mm-1 diffraction grating and a 4′′ slit. The detector was an ST-402 CCD array (the CCD size is 765510 pixels, the pixel size is 99 m). The spectral resolution (FWHM) was 7.4 Å in the range 4000–7200 Å. The spectra were processed using the standard CCDOPS code and the SPE code developed by S.G. Sergeev at the Crimean Astrophysical Observatory.
In addition, we used the spectroscopic data for IRAS 17074–1845 and IRAS 17311–4924 from the appendix to the ”Spectroscopic atlas of post- AGB stars and planetary nebulae” by Suárez et al. (2006) provided in the VizieR electronic database (J/A+A/458/173). For IRAS 17074–1845, there is a record of the spectrum taken in the period March 13.17, 1994, in the spectral range 3285–10 980 Å and IRAS 17311–4924 was observed on March 10.13, 1993, in the range 3321–11 015 Å. The observations were carried out in Chile with a 1.5-m telescope at the La Silla Observatory of the European Southern Observatory (ESO) using the Boller-Chivens spectrograph. The formal resolution was 3.74 Å per pixel, which is close to our formal resolution ( 2.3 Å per pixel for the spectra taken at SAAO and in Crimea). The spectra are given in absolute units (erg cm-2 s-1 Å-1).
Based on the spectra that we took at SAAO and in Crimea and on the spectra from the atlas by Suárez et al. (2006), we measured the line equivalent widths. For this purpose, the profile of each line was fitted by a Gaussian after the spectrum normalization. The equivalent width was assumed to be equal to the area of the derived Gaussian. The total error in the line equivalent width was calculated as a quadratic sum of the fitting error and the continuum placement error. The latter was obtained using the AMD algorithm (Kniazev et al. 2004), which gives an estimate of the continuum noise per one point of the spectrum. The total error of the continuum for each line was found in a wavelength interval equal to 2line FWHM.
Hen 3-1347 = IRAS 17074–1845. In the low-resolution spectrograms from the appendix to the paper by Suárez et al. (2006) and those taken at SAAO and in Crimea, the emission spectrum of IRAS 17074–1845 is represented by the Balmer H and H lines and very weak [O I] lines. There are no forbidden [NII] lines. The H, H, HeI, CII ( 4267, 5045, 6578+6582, 7231+7236 Å), Si II ( 6347 and 6371 Å), and Ca II H and K lines are observed in absorption. The spectrum also exhibits individual OII absorption lines. We measured the equivalent widths of the most prominent emission and absorption lines in the spectrograms of IRAS 17074–1845 and give them in Table 3. In the table, the equivalent widths of the emission and absorption lines are positive and negative, respectively.
As can be seen from Table 3, the line equivalent widths in the spectrograms taken at different dates agree well between themselves. Thus, the stars’s spectrum underwent no significant changes from 1994 to 2012.
| , Å | Ion | , Å | ||
|---|---|---|---|---|
| 2012-05-11 | 2012-05-22 | 1994-03 | ||
| 4471 | HeI | -0.540.10 | ||
| 4481 | MgII | -0.250.08 | ||
| 4713 | HeI | -0.170.08 | ||
| 4861 | H | 2.150.11 | 2.360.21 | 2.220.19 |
| 4921 | HeI | -0.40.08 | -0.410.11 | |
| 5016 | HeI | -0.250.08 | ||
| 5876 | HeI | -0.40.08 | -0.160.09 | |
| 5893 | NaI | -1.550.11 | -1.550.16 | -1.11.0 |
| 6563 | H | 15.90.3 | 160.7 | 17.80.7 |
| 6678 | HeI | -0.530.10 | -0.40.11 | -0.370.06 |
| 7065 | HeI | -0.240.07 | -0.130.06 | |
| 7378 | UN | 0.290.07 | 0.250.09 | |
Let us also present the previously published results of
spectroscopic observations for
IRAS 17074–1845.
Parthasarathy et al. (2000) took a spectrum of the star in April 1994 using a spectrograph and a two-dimensional photon-counting detector in the range 3800–5000 Å with a resolution of about 3.5 Å. These authors estimated the spectral type of IRAS 17074–1845 as B3IIe and reported that the H and H were observed in emission. Based on the spectrum taken also in 1994, Suárez et al. (2006) determined the spectral type of the star as B3Ie.
On August 4, 2007, a spectrum of IRAS 17074–1845 was taken with a high resolution (45 000) (Carmona et al. 2010). These authors reported that the H, H, H, and H were observed in emission, although H in the table to the paper is designated as a line with a P Cyg profile for which the equivalent widths of the emission ( = 12 Å) and absorption (=–0.8 Å) components were measured. The He I 4009, 4121, 4713, 4922, 5016, 5876, and 6678 Å lines are observed in absorption; there are no He II lines. The spectrum also features the N II 3995 Å, Si II 4128 and 4131 Å, C II 4267 Å, Si III 4553, 4568, 4575 Å absorption lines. The Mg II 4481 Å absorption line is slightly stronger than He I 4471 Å. By applying various criteria for spectral classification, the authors estimated the spectral type of the star as B5Ibe.
Mello et al. (2012) took a spectrum of IRAS 17074–1845 with a resolution 48 000 on May 22, 2008, in the range 3600–9200 Å. In this spectrum, the H, H, and H lines have P Cyg profiles with a broad blueshifted absorption. Some of the He I lines exhibit emission components. There are forbidden Fe II lines. The authors modeled the spectrum and obtained the stellar parameters (600 K, = 2.05, = 10 km s-1).
Thus, the spectrum of IRAS 17074–1845 was observed in 1994, 2007, 2008, and 2012. Its spectra were taken at different telescopes and with different resolutions. High-resolution observations revealed P Cyg profiles for individual lines in the star’s spectrum, suggesting the presence of a stellar wind. The equivalent widths of the H and H lines measured in low-resolution spectra underwent no changes exceeding the observational errors. The differences in the estimates of the spectral type for the star from B3 to B5 can reflect both the real changes in the spectrum and the difference between the applied criteria for spectral classification.
Hen 3-1428 = IRAS 17311–4924. The spectroscopic observations of IRAS 17311–4924 have been carried out repeatedly.
Having analyzed the spectrum taken in April 1994 in the range 3800–5000 Å with a resolution of about 3.5 Å , Parthasarathy et al. (2000) assigned the spectral type B1IIe to IRAS 17311–4924.
Based on the spectrum taken in the period March 10-13, 1993, Suárez et al. (2006) determined the spectral type of the star as B3Ie.
The high-resolution spectroscopy in the range 4900–8250 Å performed by Sarkar et al. (2005) on June 22, 2002, allowed one to identify numerous emission and absorption lines in the spectrum of IRAS 17311–4924, to measure their equivalent widths, to reveal P Cyg profiles for the H, He I, Fe III, and C II lines, and to estimate the envelope expansion velocity, the object’s heliocentric velocity, and the stellar wind velocity.
Carmona et al. (2012) observed IRAS 17311–4924 on August 7, 2007, with a high-resolution ( = 45 000) spectrograph in the range 3500–9200 Å. The Balmer and Paschen lines in their spectrum are observed in emission with P Cyg profiles. There are no He II lines. The He I 4471, 4713, 5016, 5876 Å lines also have P Cyg profiles. Forbidden lines are present in the star’s spectrum: [O I] 5577, 6300, 6364 Å; [N II] 6548 and 6584 Å. The C II 6578 Å line with a P Cyg profile is seen in the figure given in the paper; the authors took the second doublet line, C II 6583 Å, for the P Cyg profile of [N II] 6584 Å. Analysis of the spectrum allowed the authors to determine the spectral type as B1Iae, to which =20 800 K corresponds (Lang et al. 1991).
Mello et al. (2012) took a spectrum of IRAS 17311–4924 with a resolution 48 000 on May 23, 2008, in the range 3600-9200 Å. These authors pointed out significant changes compared to the data from Sarkar et al. (2005): the intensity of the H emission line increased considerably; the emission components of the He I lines as well as the Fe III and vanadium V I emission lines associated with the circumstellar material changed. The parameters of the star derived by Mello et al. (2012), =20 500 500 K and =2.35, agree well with the estimate of its spectral type B1Iae (Carmona et al. 2012).
In the spectrogram that we took on May 5, 2012, the H, H, and H lines are emission ones and H is observed in absorption. Since the spectral resolution is insufficient, we cannot reveal any lines with P Cyg profiles. The spectrum exhibits both emission ( 5016, 5876, 6678, 7065, 7281 Å) and absorption ( 3820, 3927, 4028, 4120, 4144, 4388, 4471, 4922 Å) He I lines. Fairly strong O II absorption lines are observed; there are several N II and N III absorption lines. The C II 4267, 5122, 6095+6099 Å lines and the very strong 7231+7236 Å doublet are observed in emission; the C III ( 4647, 4650, 4651 Å) lines are observed in absorption. The situation with silicon is similar: the Si II ( 5056, 5958, 5979, 6347, 6371 Å) lines are mostly emission ones, while the Si III lines are absorption ones. The Ca II H and K absorption lines are clearly seen. Out of the forbidden lines, only [O I] 6300, 6364 Å and [N II] 6548, 6584 Å are seen. The auroral [O I] 5577 Å line is not detected in our spectrum. We estimated the spectral type from the ratio of the He I and Mg II lines ( 4471 and 4481 Å) to be B1.5-2.
We measured the equivalent widths of the strongest emission and absorption lines in the spectrum of IRAS 17311–4924 and provide them in Table 4, along with the equivalent widths of the individual lines measured in the spectrum from the appendix to the paper by Suárez et al. (2006). It can be seen from the table that the equivalent widths of the He I lines had changed only slightly since 1993, while the equivalent widths of H and H and the forbidden [O I] 6300 Å and [N II] 6584 Å lines had increased noticeably by 2012.
| , Å | Ion | , Å | , Å | Ion | , Å | ||
|---|---|---|---|---|---|---|---|
| 2012 | 1993 | 2012 | 1993 | ||||
| 3798 | H10 | -0.530.10 | 5016 | HeI | 0.390.07 | ||
| 3820 | HeI | -0.320.05 | 5048 | CII | -0.180.06 | ||
| 3835 | H9 | -0.720.06 | 5056 | SiII | 0.260.06 | ||
| 3889 | H8 | -0.470.12 | 5122 | CII | 0.180.06 | ||
| 3927 | HeI, OII | -0.170.05 | 5666 | NII | -0.150.05 | ||
| 3934 | CaII | -0.460.06 | 5680 | NII | -0.350.07 | ||
| 3956 | SiII | -0.340.08 | 5740 | SiIII | -0.240.07 | ||
| 3969 | CaII, H | -1.140.07 | 5781 | DIB | -0.250.07 | ||
| 4072 | OII | -0.590.08 | 5876 | HeI | 1.40.12 | 1.540.12 | |
| 4102 | H | -0.490.10 | 5890 | NaI | -0.270.06 | ||
| 4120 | HeI | -0.420.09 | 5896 | NaI | -0.380.06 | ||
| 4144 | HeI | -0.270.06 | 5958 | SiII | 0.320.07 | 0.350.08 | |
| 4267 | CII | 0.670.06 | 5979 | SiII | 0.410.05 | 0.330.10 | |
| 4317 | OII | -0.380.06 | 6033 | FeIII | 0.150.05 | ||
| 4340 | H | 0.480.09 | 6047 | OI | 0.180.05 | ||
| 4349 | OII | -0.860.11 | 6095 | CII | 0.510.09 | ||
| 4367 | OII | -0.180.05 | 6151 | UN | 0.220.05 | ||
| 4388 | HeI | -0.310.06 | 6300 | [OI] | 1.10.07 | 0.720.14 | |
| 4415 | OII | -0.690.07 | 6347 | SiII | 0.670.06 | ||
| 4470 | HeI | -0.40.08 | 6364 | [OI] | 0.440.04 | ||
| 4552 | SiIII | -0.330.05 | 6371 | SiII | 0.290.05 | ||
| 4568 | SiIII | -0.310.06 | 6548 | [NII] | 0.610.21 | ||
| 4575 | SiIII | -0.1650.05 | 6563 | H | 230.2 | 17.20.7 | |
| 4591 | OII | -0.420.09 | 6584 | [NII] | 1.40.21 | 0.530.5 | |
| 4639 | OII | -0.430.07 | 6460 | UN | 0.20.05 | ||
| 4650 | OII | -0.870.10 | 6678 | HeI | 0.280.05 | 0.310.09 | |
| 4661 | OII | -0.130.07 | 6640 | OII | -0.280.07 | ||
| 4676 | OII | -0.180.06 | 6722 | OII | -0.150.05 | ||
| 4861 | H | 3.810.11 | 2.740.18 | 7065 | HeI | 1.310.07 | 1.310.15 |
| 4891 | OII | -0.190.06 | 7231 | CII | 1.260.17 | } 1.60.3 | |
| 4907 | OII | -0.150.06 | 7236 | CII | 1.480.16 | ||
| 4922 | HeI | -0.580.06 | 7378 | UN | 0.270.03 | ||
Our 2012 data differ significantly from the results of the 2002 observations by Sarkar et al. (2005). The equivalent widths of both emission and absorption lines that we measured are higher than those from Sarkar et al. (2005) by a factor of 1.5-2. These differences may be associated to a greater extent with the difference in spectral resolution. However, Mello et al. (2012) also draw attention to the fact that the H intensity in their spectrum increased considerably compared to the data from Sarkar et al. (2005).
Thus, the spectroscopy for IRAS 17311–4924 obtained from 1993 to 2012 showed, first, variable P Cyg profiles, suggesting a variable stellar wind, and, second, a change in the equivalent widths of H and H and the forbidden [O I] and [N II] lines with time.
LSS 4634 = IRAS 1802–3409. IRAS 18023–3409 is the weakest and least studied star from our sample. In our spectrum taken on May 11, 2012, the signal-to-noise ratio is rather low (S/N25); there are very few prominent features in the spectrum. The H, [O I], Si II, He I 7065 Å lines and the unidentified 7378 Å line, which is also present in the spectra of IRAS 17074–1845 and IRAS 17311–4924 are observed in emission. Among the absorptions, there are the Ca II H and K, H, H, H, He I 4921 and 6678 Å as well as the interstellar and circumstellar Na I D line. The line equivalent widths that we were able to measure are given in Table 5.
| , Å | Ion | , Å |
|---|---|---|
| 4102 | H | -1.180.29 |
| 4340 | H | -1.240.17 |
| 4861 | H | -0.720.15 |
| 4922 | HeI | -0.780.18 |
| 5893 | NaI | -2.120.55 |
| 6563 | H | 8.930.44 |
| 7065 | HeI | 0.750.16 |
| 7378 | UN | 1.440.22 |
Parthasarathy et al. (2000) took a spectrum of IRAS 18023–3409 in April 1994. The authors pointed out that H was observed in emission and that the H absorption line was filled with emission. The spectral type was estimated to be B2IIIe. Previously, Vijapurkar and Drilling (1993) assigned a later spectral type to the star, B9Ia+e+2, based on the spectrum taken in 1978.
Mello et al. (2012) carried out high-resolution spectroscopic observations on May 20, 2008. The spectrum of IRAS 18023–3409 exhibits strong forbidden [Fe II] lines, weak nebular [N II] lines; the H and H lines have P Cyg profiles. A nitrogen overabundance correlating with an enhanced helium abundance was detected. The model parameters of the star given in Mello et al. (2012), =19 400 K and =2.28, correspond to the spectral type B2-3I in the calibration by Straižys (1982).
PHOTOMETRIC OBSERVATIONS
ASAS-3 Observations
All stars from our program fell within the field of view of the All Sky Automated Survey (ASAS) (Pojmanski 2002; http://www.astrouw.edu.pl/asas/). The observations in the ASAS-3 system have been carried out for more than 10 years at the Las Campanas (Chile) telescopes in an automatic mode in a photometric band close to Johnson’s standard .
The sample stars were observed in 2001-2009. Table 6 provides data on the ASAS observations, namely the mean , the mean error of a single measurement, the maximum amplitude of brightness variations, and the time interval.
| IRAS | JD 2400000+ | |||
|---|---|---|---|---|
| 17074–1845 | 11.67 | 0.04 | 0.4 | 5193654883 |
| 17311–4924 | 10.84 | 0.04 | 0.3 | 5193355104 |
| 18023–3409 | 12.41 | 0.05 | 0.4 | 5194855105 |
To analyze the data, we used the measurements made with aperture 1 (15′′) and marked in the ASAS database by symbol A (good quality).
Figure 2 shows the light curves derived from ASAS data. The pattern of variability for all three stars is similar in both characteristic time scales of brightness variations and oscillation amplitudes. The stars exhibit rapid, from night to night, photometric variability with amplitudes up to 0m.3-0m.4. Our search for a periodicity did not lead to a positive result. Apart from rapid chaotic instability, IRAS 17311–4924 and IRAS 18023–3409 showed a change in the yearly mean brightness.

Observations of IRAS 17074–1845
IRAS 17074–1845, the northernmost star in our program, is accessible to observations at the Crimean Station of the Sternberg Astronomical Institute (Moscow State University). During 2012-2013, we obtained 37 magnitude estimates for the star in the bands. The measurements were made with a 60-cm Zeiss-1 telescope using a photoelectric photometer designed by Lyuty (1971). The photometric system of the photometer is close to Johnson’s one. We used the star HD 155648, whose magnitudes (, , and ) were taken from Wehinger and Hidajat (1973), as a photometric standard. As a rule, the measurement errors did not exceed in all three bands. Table 7 gives the observations of IRAS 17074–1845 and Fig. 3 shows the light curves of the star. The mean magnitudes and colors of IRAS 17074–1845 in 2011-2012 were , , , , and . The magnitude virtually coincided with the star’s mean magnitude from the ASAS data in 2001-2009, while the amplitude of brightness variations from our photometry is smaller, which is probably because the error of our measurements is smaller than that of the ASAS observations.

| JD | |||
|---|---|---|---|
| 2456065 | 11.596 | 0.273 | -0.531 |
| 2456066 | 11.491 | 0.319 | -0.558 |
| 2456070 | 11.630 | 0.289 | -0.607 |
| 2456089 | 11.604 | 0.265 | -0.564 |
| 2456090 | 11.558 | 0.283 | -0.603 |
| 2456091 | 11.594 | 0.272 | -0.623 |
| 2456092 | 11.590 | 0.269 | -0.585 |
| 2456093 | 11.653 | 0.262 | -0.618 |
| 2456095 | 11.606 | 0.290 | -0.613 |
| 2456096 | 11.635 | 0.292 | -0.615 |
| 2456097 | 11.637 | 0.288 | -0.605 |
| 2456098 | 11.709 | 0.258 | -0.594 |
| 2456101 | 11.637 | 0.295 | -0.568 |
| 2456102 | 11.710 | 0.281 | -0.506 |
| 2456103 | 11.704 | 0.315 | -0.612 |
| 2456119 | 11.648 | 0.274 | -0.560 |
| 2456121 | 11.730 | 0.272 | -0.606 |
| 2456122 | 11.740 | 0.275 | -0.602 |
| 2456124 | 11.698 | 0.316 | -0.575 |
| 2456128 | 11.619 | 0.287 | -0.573 |
| 2456130 | 11.686 | 0.268 | -0.560 |
| 2456131 | 11.652 | 0.256 | -0.546 |
| 2456134 | 11.595 | 0.312 | -0.593 |
| 2456156 | 11.661 | 0.262 | -0.535 |
| 2456445 | 11.723 | 0.268 | -0.561 |
| 2456454 | 11.658 | 0.272 | -0.638 |
| 2456455 | 11.588 | 0.342 | -0.643 |
| 2456472 | 11.694 | 0.268 | -0.574 |
| 2456473 | 11.630 | 0.288 | -0.593 |
| 2456479 | 11.653 | 0.237 | -0.612 |
| 2456481 | 11.730 | 0.266 | -0.579 |
| 2456483 | 11.558 | 0.270 | -0.574 |
| 2456485 | 11.600 | 0.248 | -0.662 |
| 2456488 | 11.624 | 0.297 | -0.615 |
| 2456489 | 11.711 | 0.255 | -0.571 |
| 2456513 | 11.663 | 0.333 | -0.581 |
| 2456515 | 11.738 | 0.266 | -0.544 |
Our photometry points to rapid photometric variability of the star from night to night with maximum amplitudes , , and .
The photometric instability is accompanied by a change in colors: as the star brightens, may increase, while definitely decreases. This is illustrated by the color-magnitude diagrams (Fig. 4). We found such correlations for other hot post-AGB stars (see, e.g., Arkhipova et al. 2012).

We can estimate the color excess from our data. Taking the spectral type B3I and the normal colors and in the calibration of Straižys (1982) for the star, we obtained an estimate of . Comparison of this value with the maximum value of (http://irsa.ipac.caltech.edu/applications/DUST/) toward IRAS 17074–1845 derived from the maps by Schlegel (1998) leads us to conclude that there exists some fraction, , of circumstellar extinction. Given the ambiguity in determining the star’s spectral type by different authors (see Table 1) and the variability of the color, the error of the derived circumstellar extinction can be significant.
Photometric History of the Program Stars
All three stars from our sample enter into historical catalogues: BD–18∘4436=IRAS 17074–1845 is contained in the Bonner Durchmusterung (BD), while CD–49∘11554=IRAS 17311–4924 and CD–34=IRAS 18023–3409 are contained in the Cordoba Durchmusterung (CD), which allowed the photometric history of the stars to be traced over more than 100 years. However, the visual magnitudes from the BD and CD catalogues should be analyzed before they are compared with the present-day photometric data.

We selected stars contained in the CD or BD catalogues from a neighborhood of each program object. Figure 5 shows the relationship between the magnitudes transformed from the magnitudes from the Tycho-2 catalogue (Hog et al. 2000) and the visual magnitudes () from the CD and BD catalogues of the program objects and stars from their neighborhoods. The relationships between and of the stars from the neighborhoods obey linear laws, according to which of each program object are transformed into the following magnitudes:
IRAS 17074–1845 ;
IRAS 17311–4924 ;
IRAS 18023–3409 .
IRAS 17074–1845. At the epoch of the BD catalogue (the 1950-1960s), the star BD–18∘4436= IRAS 17074–1845 had a brightness corresponding to .
Later observations give the following magnitude estimates for the star:
and (1989-1992, Tycho-2; Hog et al. 2000);
(April 10, 2000; Gauba et al. 2003);
(2001-2009, ASAS);
, , (2012-2013, our data).
Thus, at the present epoch the star has become considerably fainter than at the epoch of the BD catalogue.
The difference between the star’s near-IR magnitudes from different data is also noteworthy.
The first observations of the star in the bands refer to the time interval May 23, 1989-June 5, 1989, when García-Lario et al. (1997) obtained the following magnitudes for IRAS 17074–1845:
, , .
Nine years later (on May 1, 1998), according to the 2MASS data (Skrutskie et al. 2006), the star became considerably brighter:
, , .
According to the data from García-Lario et al. (1997), the source IRAS 17074–1845 has anomalous colors, and , that are typical of neither post-AGB stars nor planetary nebulae. However, with the colors and from 2MASS, IRAS 17074–1845 on the color-color diagram falls into the region of hot post-AGB stars with an insignificant IR excess belonging to the dust envelope.
For another star from our sample, IRAS 17311–4924, the IR photometry from García-Lario et al. (1997) and 2MASS showed complete agreement, rejecting the assumption about a significant difference between the two photometric systems.
The DENIS infrared observations of IRAS 17074–1845 (Epstein et al. 1999) performed on July 7, 1997, and , show a lower brightness of the star than the 2MASS data. The difference exceeds 3.
Based on the above photometry, we can assume the star to be variable in the near infrared.
IRAS 17311–4924.The brightest star from our sample, CD–49∘11554=IRAS 17311–4924, at the epoch of the CD catalogue had a visual magnitude that corresponds to and differs insignificantly from the subsequent magnitude estimates.
The first observations of the star belong to Klare and Neckel (1977) and refer to 1973-1974:
, .15, .74.
Subsequently, in 1979 and 1980, Kozok (1985) obtained three magnitude estimates for IRAS 17311–4924. According to Kozok’s data, the mean magnitudes are
, , .
The mean brightness from the ASAS data for 2001-2009 was .
The brightness of IRAS 17311–4924 has slightly decreased since the beginning of the past century. However, given the star’s rapid variability with a maximum amplitude up to 0m.4 and the large error of the magnitude from the CD catalogue, this assertion cannot be considered quite justified.
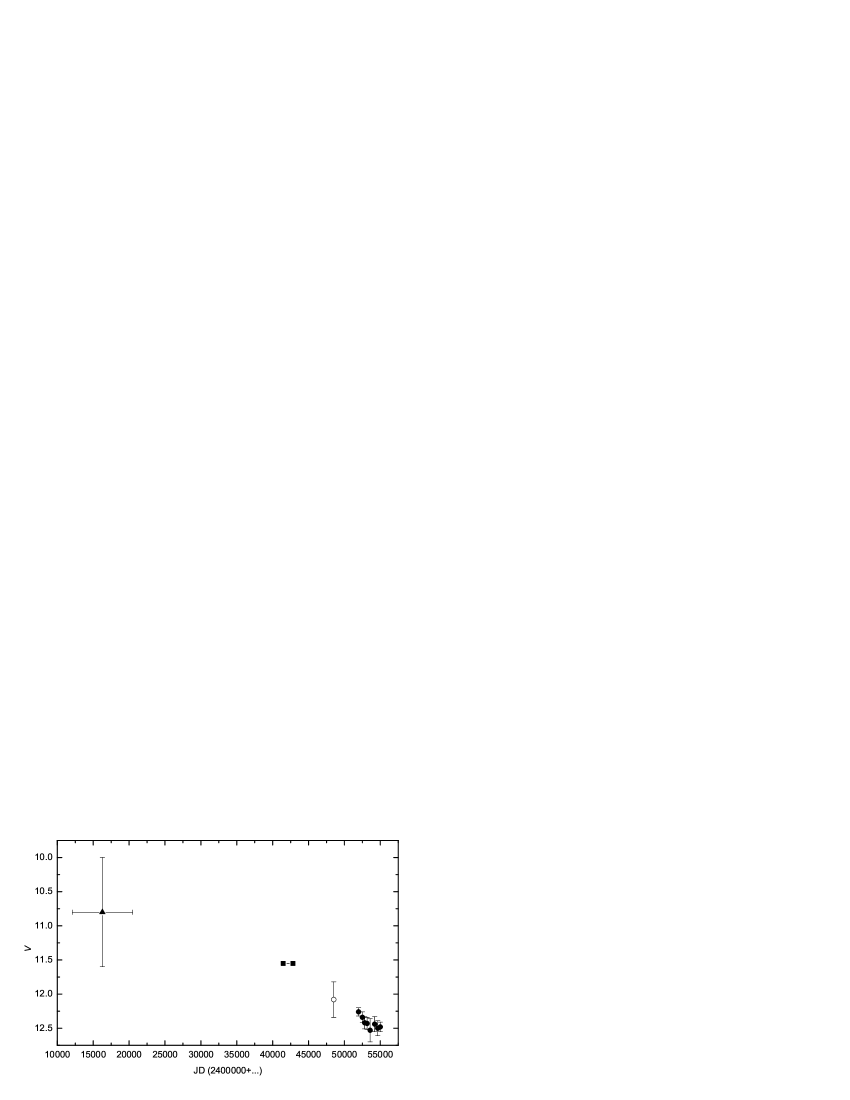
IRAS 18023–3409. For CD–34∘12448=IRAS 18023–3409, we estimated its magnitude at the epoch of the CD catalogue to be . Despite the significant uncertainty of this magnitude, it can be said with complete confidence that the star at the beginning of the past century was considerably brighter than at the present epoch.
Drilling et al. (1991) observed the star in 1972–1976 and obtained the following magnitude estimates for it:
, , .
According to the data from Tycho-2 (Hog et al. 2000), in 1989-1992 the star had and .
According to the ASAS data, the star’s mean magnitude in 2001-2009 was , while the yearly mean magnitudes showed a systematic fading.
For clarity, Fig. 6 shows the light curve for IRAS 18023–3409 from archival data. The modified magnitude from the CD catalogue, the data from Drilling et al. (1991) and Hog et al. (2000), and the yearly mean magnitudes of the star from the ASAS data are plotted in the figure.
DISCUSSION
According to the theory of stellar evolution, the duration of the post-AGB phase depends on the initial mass of the star, the history of its mass loss on the AGB, and the mass of the remnant star. Blöcker (1995) showed that for a certain set of these parameters, there exists a possibility of very rapid evolution of the star after the termination of large-scale mass loss on the AGB before the beginning of the planetary nebula phase. For example, for the model (, ) = (5 , 0.836 ), its lifetime in the post-AGB phase (6000 K 25 000 K) is 100 years. Therefore, the possibility of detecting evolutionary changes in certain stars on a time scale of several tens of years is not ruled out.
For our study, we selected hot post-AGB stars, early B supergiants with IR excesses and emission lines in the spectrum, for which Mello et al. (2012) obtained masses exceeding the mean masses of planetary nebula nuclei.
Mello et al. (2012) determined the parameters of nine hot post-AGB stars (with the stars from our sample being also among them) and used the () diagram to estimate the masses of the stars and their progenitors using evolutionary tracks from Schönberner (1983) and Blöcker (1995). For IRAS 17074–1845, the mass of the star was found to be . According to the estimates by Mello et al. (2012), IRAS 17311–4924 and IRAS 18023–3409 have even higher masses: .
An additional argument for a high mass of IRAS 18023–3409 is the fact that the object exhibits an enhanced abundance of nitrogen and helium and is the only star from the sample of Mello et al. (2012) that satisfies the criteria for Peimbert’s type I planetary nebulae, namely (He/H)0.14 or (N/O)0 (Peimbert and Torres-Peimbert 1983). Intermediate mass (3.5 ) stars are believed to be the progenitors of their nuclei.
What observational manifestations of the rapid evolution of a star in the post-AGB phase might be expected?
In the post-AGB phase, the optical brightness of the star will decrease systematically at a constant bolometric luminosity with increasing temperature starting from K. For sufficiently hot stars that can already begin to ionize their gaseous envelopes, the emission line intensities and the gas ionization fraction are expected to increase.
IRAS 17074–1845. The photometric observations of IRAS 17074–1845 showed that the star faded in the band from the epoch of the BD catalogue to the present time by more than 1 mag, corresponding to an increase in the star’s temperature by 7000-8000 K under the assumption of evolution at a constant bolometric luminosity. The rate of increase in temperature can then be estimated to be 50 K yr-1 and the star’s temperature could rise by 1000 K in 20 years of its systematic spectroscopic observations. This value is too low to be detectable from the available spectroscopic data. The difference in the estimates of the spectral type for IRAS 17074–1845 from B3I to B5I apparently reflects the difference between the criteria for spectral classification. The emission line equivalent widths from 1994 to 2012 showed no changes exceeding the measurement errors.
IRAS 17311–4924. The archival photometric data revealed a slight, by no more than 0, fading of the star in the band from the epoch of the CD catalogue to the present time.
The estimates of the spectral type for IRAS 17311–4924 made by Parthasarathy et al. (2000) based on the 1994 observations, B1IIe, and those obtained by Carmona et al. (2010) based on the 2007 spectrum, B1Iae, agree well with the stellar parameters derived by Mello et al. (2012), K and = 2.35, from the 2008 observations. Thus, the stellar parameters were virtually constants in 14 years. However, the emission lines belonging to the gaseous envelope show significant variations. For example, according to our data, the equivalent widths of the [O I] and [N II] lines increased from 1993 to 2012 by more than a factor of 1.5. Mello et al. (2012) pointed to an increase in the H intensity in their spectrum compared to the data from Sarkar et al. (2005). These changes may be related to the stellar wind instability.
IRAS 18023–3409. IRAS 18023–3409 showed a change in its spectrum and brightness. The star’s brightness declines systematically: the star has faded in the band .5 since the beginning of the past century and continues to fade at the present epoch.
According to the published data, the spectral type of the star changed from B9I (Vijapurkar and Drilling 1993) to B2I (Parthasarathy et al. 2000) in 16 years from 1978 to 1994, suggesting a considerable, 10 000 K (!), increase in the star’s temperature. However, the star’s effective temperature = 19 400 K estimated from the spectrum taken 14 years later (Mello et al. 2012) corresponds to a spectral type B2-B3I and this estimate does not confirm the further expected rise in temperature. Unfortunately, the star’s spectral type in 2012 cannot be estimated from our spectra.
If the change in spectral type from B9 to B2 is assumed to be real and related to evolution, then the corresponding change in brightness must be equal to the difference of the bolometric corrections . In reality, the brightness decline for IRAS 18023–3409 between the two epochs of spectroscopic observations did not exceed .
The data are insufficient to investigate the behavior of the emission lines in the spectrum of IRAS 18023–3409 belonging to the gaseous envelope. Based on a qualitative description of the spectrum, we can only conclude that the H line in the spectrum of IRAS 18023–3409 changes significantly with time: in the spectrogram taken in 1994 and published in Vijapurkar et al. (1998), H is an emission line, while it is an absorption one in our 2012 spectrum, although the emission spectrum of the envelope was expected to be enhanced with rising temperature of the star. Mello et al. (2012) point out that H has a P Cyg profile. The variability of the H emission line is most likely related to the wind activity of the star.
The source IRAS 18023–3409 showed the most significant changes in brightness and spectrum among the stars from our sample. The conclusion reached by Mello et al. (2012) about the star’s high mass () based on their comparison of the measured stellar parameters ( and ) with theoretical evolutionary tracks from Blöcker (1995) and the enhanced abundance of nitrogen and helium in the stellar atmosphere typical of the most massive planetary nebula nuclei allows the revealed brightness changes in IRAS 18023–3409 to be associated with the star s rapid evolution in the post-AGB phase.
CONCLUSIONS
We obtained spectroscopy for three southern-hemisphere hot post-AGB objects. We compared the new spectroscopic data with those published previously. We analyzed the new photoelectric observations of IRAS 17074–1845 and the archival photometric data for all three sample stars.
The main conclusions of our study as as follows.
(1) Rapid photometric variability of IRAS 17074–1845, IRAS 17311–4924, and IRAS 18023–3409 has been detected for the first time. According to the ASAS data for 2001-2009, all three objects exhibited brightness variations with an amplitude up to and a time scale of several days. Such a pattern of variability has also been pointed out previously for other hot post-AGB stars (Hrivnak et al. 2000; Arkhipova et al. 2013b). It was hypothesized that an unsteady stellar wind was mainly responsible for the brightness variations of hot protoplanetary stars. Its origin can be associated with density inhomogeneities in the outer layers of the star, a low-mass supergiant that has passed the hydrogen and helium shell burning stage on the AGB(Arkhipova et al. 2012).
(2) Our photoelectric observations of IRAS 17074–1845 in 2012-2013 confirmed the photometric variability of the star revealed by the ASAS data. We found a correlation of the and colors with the magnitude: an increase in and a decrease in as the star brightens.
(3) Based on the archival data, we traced the photometric history of the program objects. All three stars exhibited a fading on a time scale longer than 100 years. IRAS 17074–1845 and IRAS 18023–3409 showed the most prominent fading. Their brightness decreased by more than 1m compared to the epochs of the BD and CD catalogues, respectively.
(4) For IRAS 17311–4924 and IRAS 18023–3409, we obtained data on the change in their spectra over the last 20 years. For IRAS 17311–4924, the equivalent widths of the [N II] and [O I] emission lines increased noticeably. For IRAS 18023–3409, we revealed a change in the spectral type and the H line.
Our hypothesis about rapid evolution of the objects presented here is based on the detected brightness variations in the stars. The secular fading in the band is consistent with an increase in temperature at a constant luminosity in the post-AGB phase of evolution. However, the spectrum variations can be associated both with the evolutionary change in stellar temperature and with the stellar wind instability. Therefore, spectroscopic observations on a time scale longer than 20 years are needed to reach a more definitive conclusion about the possible rapid evolution.
ACKNOWLEDGMENTS
This study was supported by the National Research Foundation of the Republic of South Africa. We wish to thank the administration of the South African Astronomical Observatory for the allocation of observing time on the 1.9-m telescope. We used the 2MASS and ASAS archival data.
REFERENCES
-
1.
V. P. Arkhipova, N. P. Ikonnikova, R. I. Noskova, et al., Astron. Lett. 25, 25 (1999).
-
2.
V. P. Arkhipova, N. P. Ikonnikova, and G. V. Komissarova, Astron. Lett. 36, 269 (2010).
-
3.
V. P. Arkhipova, M. A. Burlak, V. F. Esipov, et al., Astron. Lett. 38, 157 (2012).
-
4.
V. P. Arkhipova, N. P. Ikonnikova, A. Yu. Knyazev, et al., Astron. Lett. 39, 201 (2013a).
-
5.
V. P. Arkhipova, M. A. Burlak, V. F. Esipov, et al., Astron. Lett. 39, 619 (2013b).
-
6.
C. A. Beichmann, G. Neugebauer, H. J. Habing, P. E. Clegg, and T. J. Chester, IRAS Point Source Catalogue, JPL (1985).
-
7.
T. Blöcker, Astron. Astrophys. 299, 755 (1995).
-
8.
A. Carmona, M. E. van den Ancker, and M. Audard, Astron. Astrophys. 517, A67 (2010).
-
9.
L. Cerrigone, J. L. Hora, G. Umana, and C. Trigilio, Astrophys. J. 703, 585 (2009).
-
10.
Y.-S. Dong and J.-Y. Hu, Chin. Astron. 15, 275 (1991).
-
11.
J. S. Drilling, Astrophys. J. Suppl. Ser. 76, 1033 (1991).
-
12.
N. Epchtein, E. Deul, S. Derriere, et al., Astron. Astrophys. 349, 236 (1999).
-
13.
P. García-Lario, M. Parthasarathy, D. de Martino, L. Sanz Ferna. ndez de Co. rdoba, R. Monier, A. Manchado, and S. R. Pottasch, Astron. Astrophys. 326, 1103 (1997).
-
14.
G. Gauba, M. Parthasarathy, . Kumar, R.K.S. Yadav and R. Sagar, Astron. Astrophys. 404, 305 (2003).
-
15.
G. Gauba and M. Parthasarathy, Astron. Astrophys. 407, 1007 (2003).
-
16.
G. Gauba and M. Parthasarathy, Astron. Astrophys. 417, 201 (2004).
-
17.
G. Handler, R.H. Mendez, R. Medupe, et al., Astron. Astrophys. 320, 125 (1997).
-
18.
K.G. Henize, Astrophys. J. Suppl. Ser. 30, 491 (1976).
-
19.
E. Hog, C. Fabricius, V.V.Makarov, Astron. Astrophys., 355, L27 (2000).
-
20.
B.J. Hrivnak, S. Kwok and K.M. Volk, Astrophys. J. 346, 265, (1989).
-
21.
B.J. Hrivnak and W. Lu The Carbon Star Phenomenon, Proceedings of the 177th Symposium of the International Astronomical Union, Vol. 177 ed. R. F. Wing (Dordrecht: Kluwer Academic Publishers), p.293 (2000)
-
22.
B.J. Hrivnak and W. Lu, R. E. Maupin, and B. D. Spitzbart Astrophys. J., 709, 1042, (2010).
-
23.
L.L. Kiss, A. Derekas, G.M. Szabo , T.R. Bedding and L. Szabados, MNRAS 375, 1338 (2007).
-
24.
G. Klare, T. Neckel, Astron. and Astrophys., Suppl. Ser., 27, 215 (1977).
-
25.
A.Y. Kniazev, S.A. Pustilnik, E.K. Grebel, H. Lee, A.G. Pramskij, Astrophys. J. Suppl. Ser. 153, 429 (2004).
-
26.
J. R. Kozok, Astron. Astrophys., Suppl. Ser. 61, 387 (1985).
-
27.
K. R. Lang, Astrophysical Data: Planets and Stars (Springer) (1991).
-
28.
V. M. Lyutyi, Soobshch. GAISh 172, 30 (1971).
-
29.
D.R.C. Mello, S. Daflon, C.B. Pereira and I. Hubeny Astron. Astrophys. 543, A11 (2012).
-
30.
M. Parthasarathy and S.R. Pottasch, Astron. Astrophys. 154, L16 (1986).
-
31.
M. Parthasarathy and S.R.Pottasch, Astron. Astrophys. 225, 521 (1989).
-
32.
M. Parthasarathy, ASPC 45, 173 (1993).
-
33.
M. Parthasarathy, P. García-Lario, S.R.Pottasch et al., Astron. Astrophys. 267, L19 (1993).
-
34.
M. Parthasarathy, J. Vijapurkar, J.S. Drilling, Astron. Astrophys. Suppl. Ser. 145, 269 (2000).
-
35.
M. Peimbert and S. Torres-Peimbert, in Proceedings of the IAU Symposium 103 on Planetary Nebulae, Ed. by D.R.Flower (D. Reidel, Dordrecht, 1983), p. 233.
-
36.
G. Pojmanski, Acta Astronomica 52, 397 (2002).
-
37.
A. Preite-Martinez, Astron. Astrophys. Suppl. Ser. 76, 317 (1988).
-
38.
G. Sarkar, M. Parthasarathy And B.E. Reddy, Astron. Astrophys., 431, 1007 (2005).
-
39.
D.J. Schlegel, D.P. Finkbeiner, and M. Davis, Astrophys. J. 500, 525 (1998).
-
40.
D. Schönberner, Astrophys. J. 272, 708 (1983).
-
41.
D. Schönberner, Late Stages of Stellar Evolution, Ed. by S. Kwok and S. R. Pottasch (Reidel, Dordrecht, 1987), p. 341.
-
42.
M. F. Skrutskie, R. M. Cutri, R. Stiening et al., Astron. J., 131, 1163 (2006).
-
43.
C. B. Stephenson and N. Sanduleak, Publication of the Warner and Swasey Observatory (Case Western Reserve Univ., Cleveland, Ohio, 1971).
-
44.
V. L. Straižhis, Metal-Deficient Stars (Mokslas,Vilnyus, 1982) [in Russian].
-
45.
O. Suárez, P. García-Lario, A. Manchado, M. Manteiga, A. Ulla and S.R. Pottasch, Astron. Astrophys. 458, 173 (2006).
-
46.
R. Szczerba, N. Siodmiak, G. Stasinska and J. Borkowski, Astron. Astrophys. 469, 799 (2007).
-
47.
W. E. C. J. van der Veen, H. J. Habing, and T. R. Geballe, Astron. Astrophys. 226, 108 (1989).
-
48.
J. Vijapurkar and J. S. Drilling, Astrophys. J. Suppl. Ser. 89, 293 (1993).
-
49.
J. Vijapurkar, M. Parthasarathy, and J. S. Drilling, Bull. Astron. Soc. India 26, 497 (1998).
-
50.
P. A. Wehinger and B. Hidajat, Astron. J. 78, 401 (1973).
-
51.
H. van Winckel, T. L. Evans, M. Briquet, P. De Cat, P. Degroote, W. De Meester, J. De Ridder, P. Deroo, et al., Astron. Astrophys. 505, 1221 (2009).
-
52.
H. van Winckel, B. J. Hrivnak, N. Gorlova, C. Gielen, and W. Lu, Astron. Astrophys. 542, 53 (2012).
Erratum: Variability and Possible Rapid Evolution of the Hot Post-AGB Stars Hen 3-1347, Hen 3-1428, and LSS 4634 [Astronomy Letters, 2014, 40, 485 (2014)].
V. P. Arkhipova, M.A.Burlak, V. F. Esipov, N. P. Ikonnikova,
A. Yu. Kniazev,
G. V. Komissarova, and A. Tekola
In this note, we add two references mentioned in the text, but missed in the list of references.
REFERENCES
-
1.
M. Parthasarathy and S.R.Pottasch, Astron. Astrophys. 225, 521 (1989).
-
2.
M. Parthasarathy, ASPC 45, 173 (1993).
Acknowledgments
We thank M. Parthasarathy for pointing out missing references.