22email: federico.lelli@case.edu 33institutetext: Department of Physics and Astronomy, University of Bologna, viale Berti Pichat 6/2, 40127, Bologna, Italy
Dynamics of starbursting dwarf galaxies. III.
We investigate the dynamics of starbursting dwarf galaxies, using both new and archival H I observations. We consider 18 nearby galaxies that have been resolved into single stars by HST observations, providing their star formation history and total stellar mass. We find that 9 objects have a regularly rotating H I disk, 7 have a kinematically disturbed H I disk, and 2 show unsettled H I distributions. Two galaxies (NGC 5253 and UGC 6456) show a velocity gradient along the minor axis of the H I disk, which we interpret as strong radial motions. For galaxies with a regularly rotating disk we derive rotation curves, while for galaxies with a kinematically disturbed disk we estimate the rotation velocities in their outer parts. We derive baryonic fractions within about 3 optical scale lengths and find that, on average, baryons constitute at least 30 of the total mass. Despite the star formation having injected 1056 ergs in the ISM in the past 500 Myr, these starbursting dwarfs have both baryonic and gas fractions similar to those of typical dwarf irregulars, suggesting that they did not eject a large amount of gas out of their potential wells.
Key Words.:
galaxies: dwarf – galaxies: starburst – galaxies: kinematics and dynamics – galaxies: evolution – dark matter1 Introduction
Starburst activity is thought to strongly affect the evolution of dwarf galaxies. Both observations and theoretical models suggest that massive star formation can alter the morphology and kinematics of the gas in dwarf galaxies (e.g., Mac Low & Ferrara 1999; Cannon et al. 2011), as well as their chemical properties (e.g., Recchi et al. 2004; Romano et al. 2006). Moreover, models of galaxy formation in a cold dark matter (CDM) cosmology require strong feedback from star formation to explain several observational facts, such as i) the existence of bulgeless disk galaxies by removing low angular-momentum gas from the galaxy center (e.g., Governato et al. 2010; Brook et al. 2011); ii) the “cored” DM profiles observed in dwarfs by flattening the presumed central “cusps” (e.g., Oh et al. 2011a; Governato et al. 2012); iii) the slope of the baryonic Tully-Fisher relation by reducing the baryonic fraction in galaxies (e.g., McGaugh 2012; Stringer et al. 2012), and iv) the number density of low-luminosity galaxies by suppressing star formation in low-mass DM halos (e.g., Okamoto et al. 2010; Sawala et al. 2013). Detailed dynamical studies of nearby starbursting dwarfs are necessary to determine the actual efficiency of these processes.
Starbursting dwarfs can be identified by i) their blue colors and high surface brightness, such as the blue compact dwarfs (BCDs) (e.g., Gil de Paz et al. 2003); ii) their strong emission-lines, such as the H II-galaxies (e.g., Terlevich et al. 1991; Taylor et al. 1995); and iii) their peculiar morphologies, such as the “amorphous dwarfs” (e.g., Gallagher & Hunter 1987; Marlowe et al. 1999). Hereafter, we refer to any starbursting dwarf as a BCD.
To date, detailed studies of the H I kinematics of BCDs have been focused either on individual galaxies (e.g., Viallefond & Thuan 1983; Hunter et al. 1996; Wilcots & Miller 1998; Matthews & Uson 2008) or on small galaxy samples with four to five objects (e.g., van Zee et al. 1998, 2001; Thuan et al. 2004; Ramya et al. 2011). These studies show that some BCDs have regularly rotating H I disks (e.g., van Zee et al. 1998, 2001), whereas others have complex H I kinematics (e.g., Cannon et al. 2004; Kobulnicky & Skillman 2008). The relative fraction of BCDs with ordered or disturbed H I kinematics remains unclear, as does the possible relation between the gas kinematics and the starburst. The DM content of starbursting dwarfs is also poorly constrained. Elson et al. (2010, 2013) argue that the BCDs NGC 1705 and NGC 2915 are dominated by DM at all radii (see also Meurer et al. 1996, 1998). In contrast, Walter et al. (1997) and Johnson et al. (2012) studied the starbursting dwarfs II Zw 33 and NGC 1569, respectively, and conclude that there is no need for DM to explain their inner kinematics.
| Name | Alternative | Dist | SFRp | 12+log(O/H) | Ref. | ||||||
|---|---|---|---|---|---|---|---|---|---|---|---|
| Name | (Mpc) | (107 M⊙) | (M⊙/L⊙) | (10-3M⊙ yr-1) | (Myr) | (10-3M⊙ yr-1 kpc-2) | |||||
| NGC 625 | ESO 297-G005 | 3.90.4 | 2610 | -17.250.24 | 0.6 | 3.00.1 | 8620 | 820180 | 2.50.6 | 8.080.12 | a, g, l |
| NGC 1569 | UGC 3056 | 3.40.2 | 707 | -17.140.25 | 1.70.2 | 211 | 24010 | 4010 | 8.50.3 | 8.190.02 | a, h, m |
| NGC 1705 | ESO 158-G013 | 5.10.6 | 20 | -16.350.26 | 1 | 6 | 31478 | 3 | 4411 | 8.210.05 | b, i, l |
| NGC 2366 | UGC 3851 | 3.20.4 | 263 | -16.640.27 | 1.00.1 | 5.60.4 | 16010 | 45050 | 2.60.2 | 7.910.05 | a, h, l |
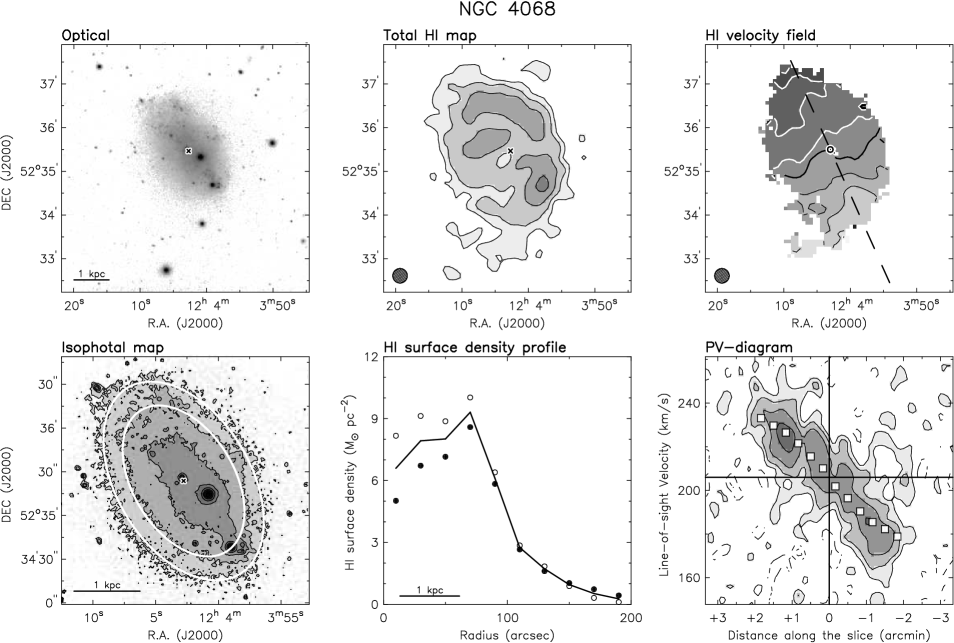
| NGC 4068 | UGC 7047 | 4.30.1 | 223 | -15.670.05 | 2.00.3 | 4.70.3 | 423 | 36040 | 4.50.3 | … | a, h |
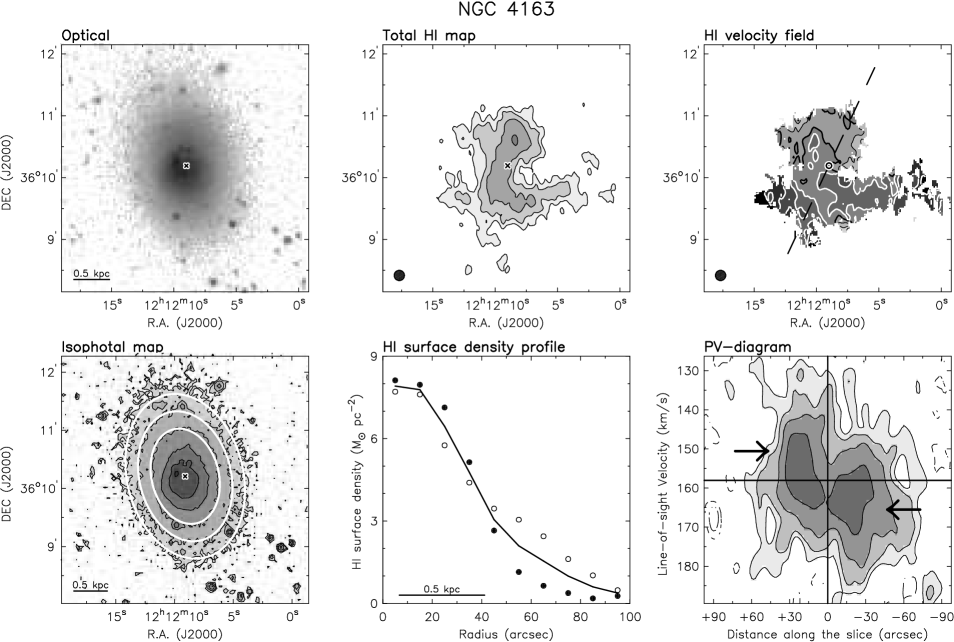
| NGC 4163 | UGC 7199 | 3.00.1 | 103 | -14.810.10 | 2.00.6 | 2.90.6 | 123 | 45050 | 3.80.9 | 7.560.14 | a, h, l |
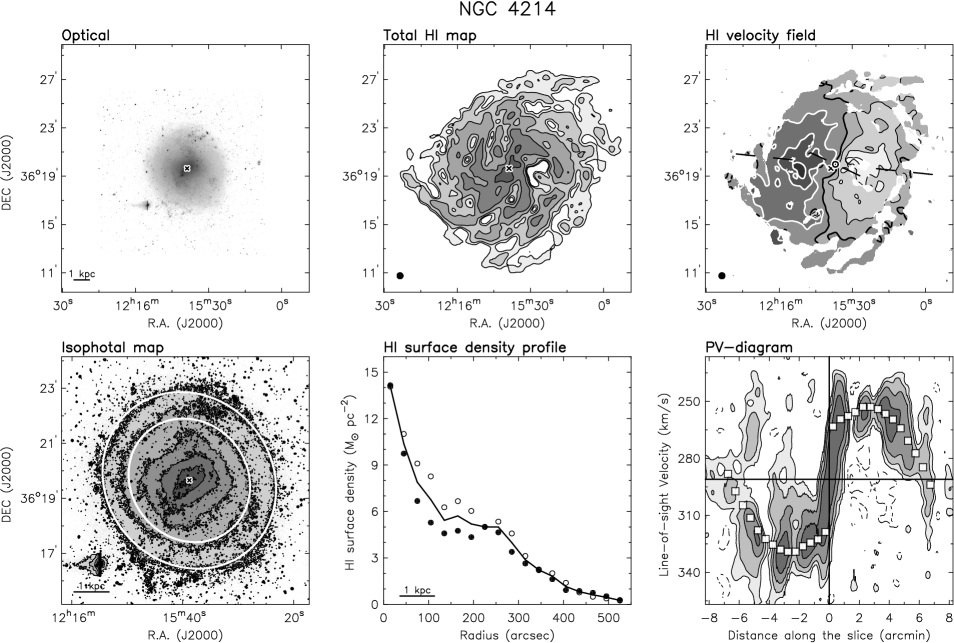
| NGC 4214 | UGC 7278 | 2.70.2 | 28 | -17.770.24 | 0.4 | 3.10.9 | 13040 | 45050 | 8.52.6 | 8.220.05 | a, h, l |
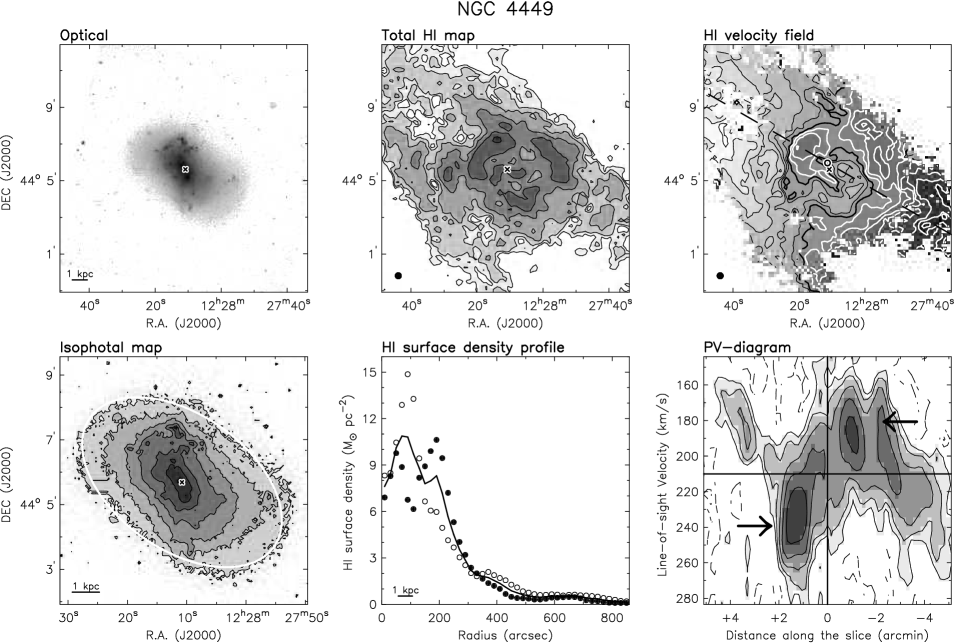
| NGC 4449 | UGC 7592 | 4.20.5 | 21035 | -18.880.26 | 1.00.2 | 6.00.5 | 97070 | 53 | 282 | 8.260.09 | a, h, l |
| NGC 5253 | Haro 10 | 3.50.4 | 15421 | -17.610.27 | 2.40.3 | 9.00.9 | 40040 | 45050 | 293 | 8.120.05 | a, g, k |
| NGC 6789 | UGC 11425 | 3.60.2 | 72 | -15.090.14 | 1.10.3 | 3.81.3 | 155 | 56565 | 9.73.2 | … | a, i |
| UGC 4483 | … | 3.20.2 | 1.00.2 | -12.970.19 | 1.10.3 | 143 | 112 | 56565 | 8.83.5 | 7.560.03 | a, i, l |
| UGC 6456 | VII Zw 403 | 4.30.1 | 52 | -14.410.05 | 1.50.6 | 7.61.1 | 233 | 168 | 5.10.7 | 7.690.01 | a, j, n |
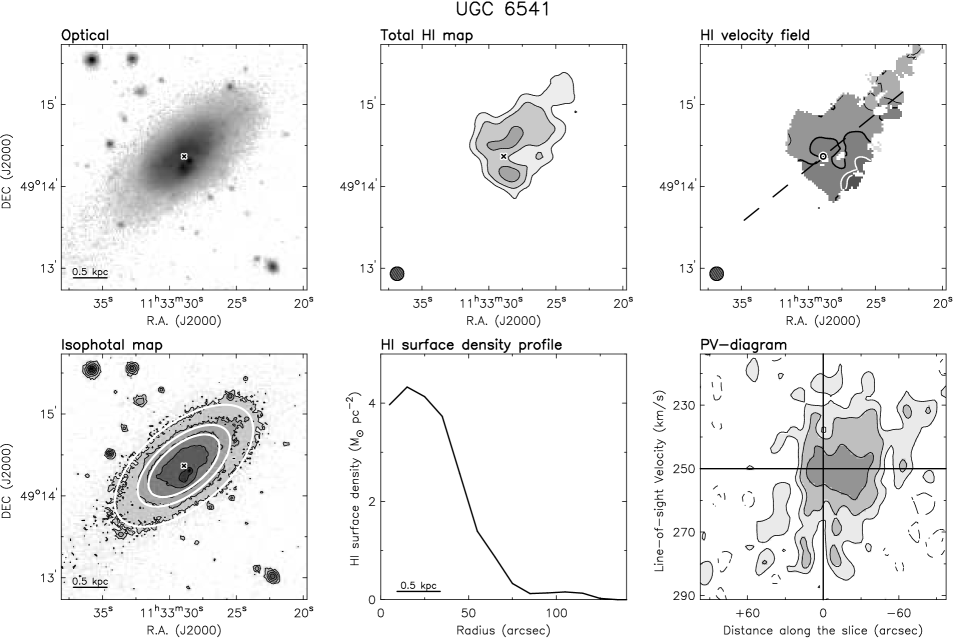
| UGC 6541 | Mrk 178 | 4.20.2 | 0.8 | -14.610.10 | 0.2 | 3 | 3 | … | 1.20.6 | 7.820.06 | c, j, l |
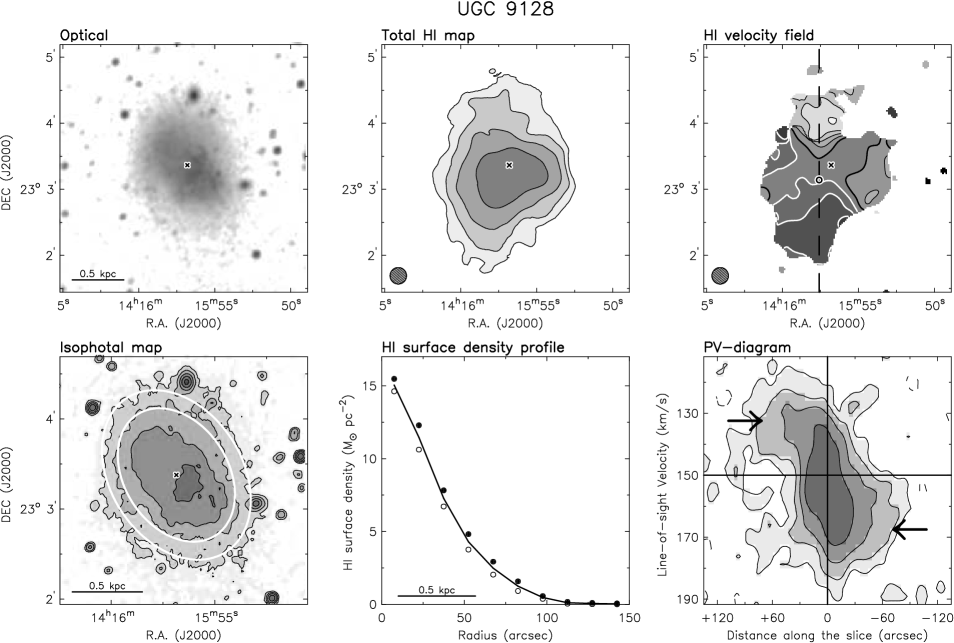
| UGC 9128 | DDO 187 | 2.20.1 | 1.30.2 | -12.820.12 | 1.60.2 | 6.31.4 | 51 | 15050 | 4.40.9 | 7.750.05 | a, h, l |
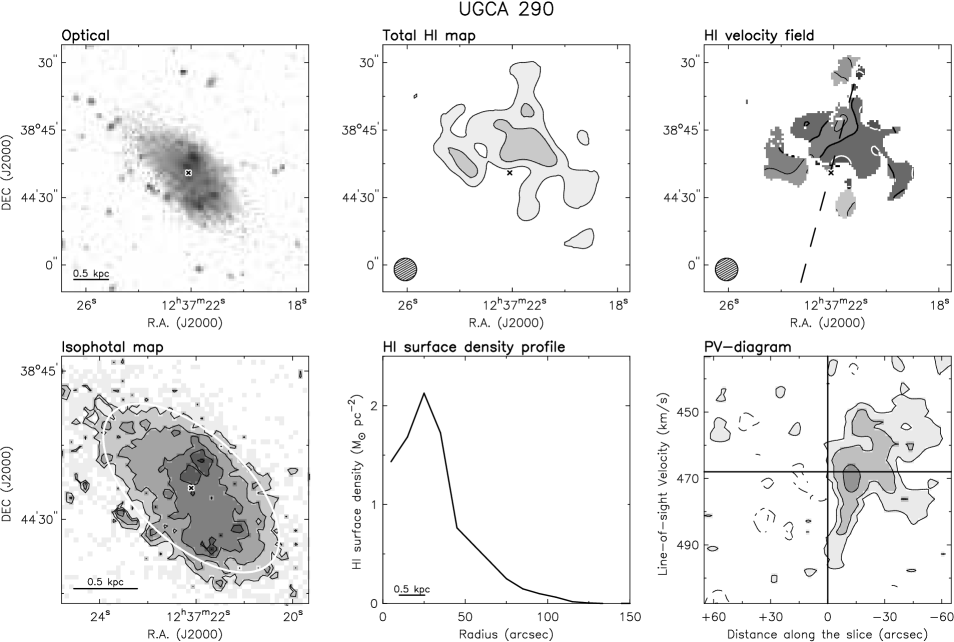
| UGCA 290 | Arp 211 | 6.70.4 | 1.0 | -14.090.18 | 0.4 | 3 | 4215 | 15 | 166 | … | d, i |
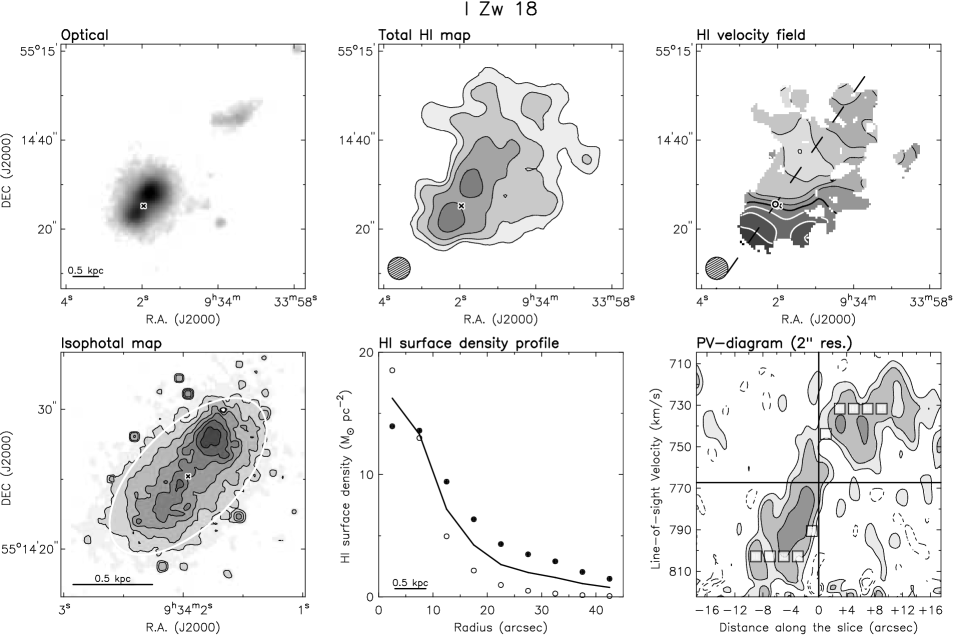
| I Zw 18 | Mrk 116 | 18.21.4 | 1.7 | -14.990.26 | 0.3 | 30 | 100 | 10 | 127 | 7.200.01 | e, j, k |
| I Zw 36 | Mrk 209 | 5.90.5 | 0.8 | -14.880.23 | 0.1 | 7 | 25 | … | 9.8 | 7.770.01 | f, i, k |
| SBS 1415+437 | … | 13.61.4 | 173 | -15.900.25 | 1.30.2 | 122 | 15010 | 45050 | 8.30.5 | 7.620.03 | a, i, o |
(a) McQuinn et al. (2010a); (b) Annibali et al. (2003); (c) Schulte-Ladbeck et al. (2000); (d) Crone et al. (2002); (e) Annibali et al. (2013); (f) Schulte-Ladbeck et al. (2001); (g) Lauberts & Valentijn (1989); (h) Swaters & Balcells (2002); (i) Gil de Paz et al. (2003); (j) Papaderos et al. (2002); (k) Izotov & Thuan (1999); (l) Berg et al. (2012); (m) Kobulnicky & Skillman (1997); (n) Thuan & Izotov (2005); (o) Guseva et al. (2003).
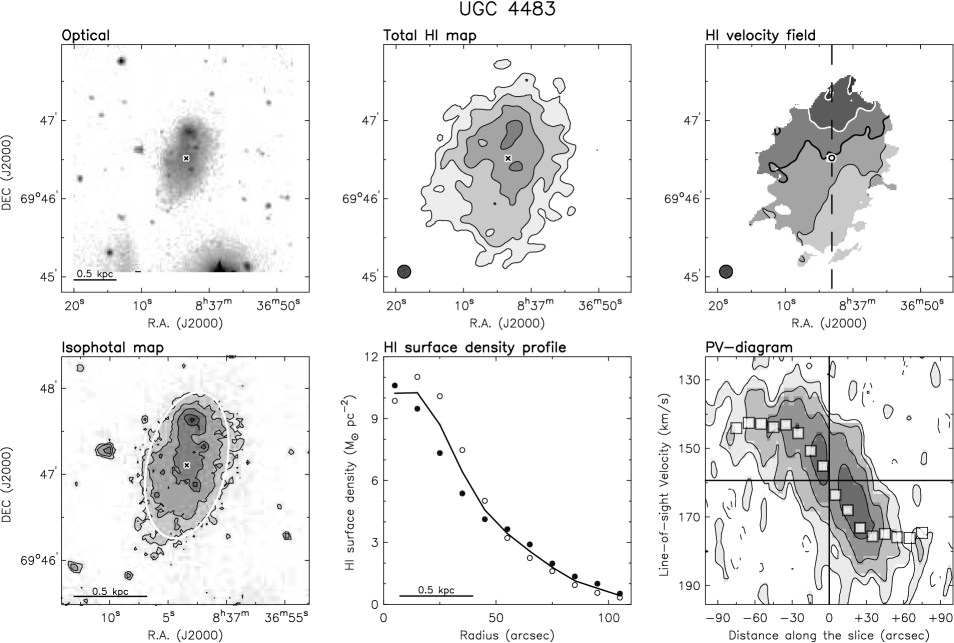
To clarify these issues, we considered a sample of 18 starbursting dwarfs, for which we collected both new and archival H I observations. We selected objects that have been resolved into single stars by the Hubble Space Telescope (HST), providing a direct estimate of the recent star-formation history (SFH) and of the total stellar mass (e.g., Annibali et al. 2003). The latter information allows us to break the “disk-halo degeneracy” (van Albada & Sancisi 1986) and to estimate baryonic fractions. In Lelli et al. (2012a, b), we presented our results for two show-case galaxies: I Zw 18 and UGC 4483. For both objects, we showed that i) the H I gas forms a compact, rotating disk; ii) the rotation curve rises steeply in the inner parts and flattens in the outer regions; and iii) old stars and atomic gas are dynamically important, since they constitute at least of the total dynamical mass within the last measured point of the rotation curve. Here we present a dynamical study of the remaining 16 objects.
2 The sample
Table 1 summarizes the main properties of our sample of starbursting dwarfs. For these 18 galaxies, the studies of the resolved stellar populations provide i) the galaxy distance from the tip of the red giant branch (TRGB), ii) the spatial distribution of the different stellar populations, iii) the recent SFH (ages 1 Gyr) by modeling the color-magnitude diagrams (CMDs), iv) the energy produced during the burst by supernovae and stellar winds, and v) the stellar mass in young and old stars. For 13 objects, we adopt the SFHs derived by McQuinn et al. (2010a) using archival HST images. The remaining 5 objects (I Zw 18, I Zw 36, NGC 1705, UGC 6541, and UGCA 290) have not been studied by McQuinn et al. (2010a) because the HST observations have a relatively shallow photometric depth (1 mag below the TRGB). We use the SFHs derived by other authors (Annibali et al. 2003, 2013; Crone et al. 2002; Schulte-Ladbeck et al. 2000, 2001), although they are more uncertain due to the limited photometric depth. Note that all these 18 objects are well-defined starburst galaxies, as their star-formation rates (SFRs) show an increase in the recent SFH by a factor 3 with respect to the past, average SFR. The sample covers a broad range in luminosities (), stellar masses (), and metallicities ().
For all these galaxies, we collected both new and archival H I data. We obtained new H I observations for SBS 1415+437 and UGCA 290 using the Jansky Very Large Array (VLA, during its upgrade period), and of NGC 6789 using the Westerbork Synthesis Radio Telescope (WSRT). We analyzed raw data from the VLA archive for I Zw 18 (Lelli et al. 2012a), UGC 4483 (Lelli et al. 2012b), UGC 6456 and NGC 625 (this work). The H I datacubes of NGC 1705 (Elson et al. 2013) and NGC 5253 (López-Sánchez et al. 2012) were kindly provided by Ed Elson and Angel R. Lopez-Sanchez, respectively. For the remaining 9 galaxies, we used H I cubes from 3 public surveys: WHISP (Swaters et al. 2002), THINGS (Walter et al. 2008), and LITTLE-THINGS (Hunter et al. 2012). For 4 galaxies (NGC 2366, NGC 4163, NGC 4214, and UGC 9128), H I cubes are available from both WHISP and THINGS/LITTLE-THINGS; we used the VLA data as they have higher spatial resolution than the WSRT observations.
| Galaxy | Array | Project | Observing Dates | Time on Source | Calibrators |
|---|---|---|---|---|---|
| UGCA 290 | VLA/B | 10C-200 | 12, 26, 28 Mar. 2011 | 7.6 h | 3C286, 1227+365 |
| VLA/C | 12A-246 | 25, 27, 28 Apr. 2012 | 4.6 h | 3C286, 1227+365 | |
| VLA/D | 11B-075 | 2, 13 Nov. 2011 | 0.28 h | 2C295, 1227+365 | |
| SBS 1415+345 | VLA/B | 10C-200 | 4, 27 Mar., and 8 Apr. 2011 | 7.6 h | 3C286, 1400+621 |
| VLA/C | 12A-246 | 26, 28, 30 Apr. 2012 | 4.6 h | 3C286, 1400+621 | |
| VLA/D | 11B-075 | 6, 9 Oct. 2011 | 0.28 h | 3C295, 1400+621 | |
| NGC 6789 | WSRT | R11A007 | 20 May. 2011 | 12 h | 3C286, 3C48 |
3 Data Reduction & Analysis
3.1 H I data
In the following, we outline the main steps of the H I data analysis. We first describe the new 21 cm-line observations and the data reduction. For the latter, we followed procedures similar to Lelli et al. (2012a, b) and refer to these papers for further details. For the existing H I datacubes, we refer to the original papers (see Table 7). Finally, we describe the derivation of total H I maps and velocity fields.
NGC 6789 was observed in May 2011 with the WSRT in a standard 12 h session. The correlator was used in dual-polarization mode, with a total bandwidth of 10 MHz and 1024 spectral channels, providing a velocity resolution of 2.5 km s-1. SBS 1415+437 and UGCA 290 were observed with the B, C, and D arrays of the VLA between March 2011 and April 2012. The correlator was used in dual-polarization WIDAR mode with a total bandwidth of 2.0 MHz and 256 spectral line channels, providing a velocity resolution of 1.9 km s-1. Between 20 Sept. 2011 and 3 Dec. 2011, the VLA correlator back-end, by mistake, integrated for only 1 sec per record, thus the D-array observations have a time on source of only 16 mins instead of the expected 2 hours. The new H I observations are summarized in Table 2. We also reduced archival VLA observations of NGC 625 and UGC 6456.
The raw UV data were flagged, calibrated, and combined using the AIPS package and following standard procedures. We Fourier-transformed the UV data using a robust weighting technique (Briggs 1995). After various trials, we chose the value of the robust parameter (either , , or 0) that minimizes sidelobes and wings in the beam profile. After the Fourier transform, we continued the data analysis using the Groningen Imaging Processing SYstem (GIPSY) (van der Hulst et al. 1992). The channel maps were continuum-subtracted using line-free channels and then cleaned (Högbom 1974) down to 0.3 using a mask to define the search areas.
A detailed study of the H I kinematics requires a combination of spatial resolution, spectral resolution, and sensitivity that varies from object to object, depending both on the quality of the H I observations and on the intrinsic properties of the galaxy (e.g., angular size, rotation velocity, mean H I column density). We used the following approach. For every galaxy, we first analyzed the H I datacube at the highest spatial and spectral resolutions available. This cube is typically obtained using and has relatively low column-density sensitivity, but the synthesized beam profile is close to a Gaussian and does not have the broad wings that are typical for natural-weighted UV-data. Then, we smoothed the cube both in the image plane and in velocity using various Gaussian tapers, until we found the optimal compromise between resolution and sensitivity. The properties of both original and final datacubes are summarized in Appendix B (Table 7). The spatial and spectral resolutions range between 5′′ to 30′′ and 5 to 10 km s-1, respectively.
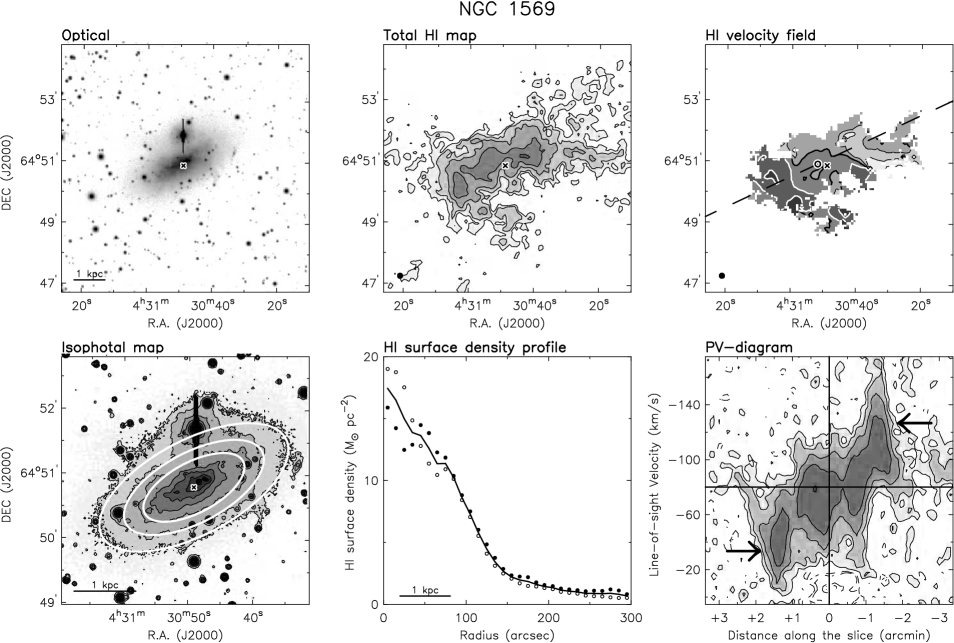
Total H I maps were obtained by summing the masked channel maps. The masks were constructed by first smoothing the datacubes in the image plane to 30′′ or 60′′ (depending on the angular extent of the galaxy) and in velocity to 10 or 20 km s-1 (depending on the H I line-width of the galaxy), and subsequently clipping the channel maps at 3 ( is the rms noise in the smoothed cube). A pseudo-3 contour in the total H I map was calculated following Verheijen & Sancisi (2001). The H I datacube of NGC 1569 is strongly affected by Galactic emission that we have interactively blotted out; the resulting H I map is rather uncertain. Velocity fields (VFs) were derived by fitting a Gaussian function to the H I line profiles. Fitted Gaussians with a peak intensity less than 3 were discarded. For most galaxies, the H I line profiles are very broad and asymmetric, thus the VFs only provide a rough description of the galaxy kinematics. As a consequence, our kinematical analysis is mostly based on channel maps, Position-Velocity (PV) diagrams, and 3-dimensional (3D) disk models.
3.2 Optical data
In order to compare the relative H I and stellar distributions of the BCDs, we collected optical images via the NASA/IPAC Extragalactic Database (NED222The NASA/IPAC Extragalactic Database is operated by the Jet Propulsion Laboratory, California Institute of Technology, under contract with the National Aeronautics and Space Administration.). When available, we used -band images, otherwise we used -band ones. The images come from the following studies: Kuchinski et al. (2000), Gil de Paz et al. (2003), Taylor et al. (2005), Hunter & Elmegreen (2006), and Meurer et al. (2006). In I Zw 18, the nebular emission line dominates the optical morphology, thus we have also used the H-subtracted, -band image from Papaderos et al. (2002).
The images were analyzed as follows. We determined the sky level by masking the sources in the frame and fitting a 2D polynomial to the masked image. Then, we created sky-subtracted images and isophotal maps, using the calibration parameters provided in the original papers. To improve the signal-to-noise ratio in the outer regions, the isophotal maps were pixel-averaged with a 33 box; this preserves the resolution of the images as the pixel sizes were typically 3 times smaller than the seeing.
The images were interactively fitted with ellipses to determine the optical center (), position angle (PAopt), and ellipticity . Foreground stars and scattered light in the frames were masked out by hand. Since the inner isophotes of BCDs are usually irregular due to the starburst, we estimated (), PAopt, and by taking the mean value over the outer isophotes. We also estimated the optical inclination using the formula
| (1) |
where is the intrinsic thickness of an oblate stellar disk. We assumed , as indicated by statistical studies of the ellipticities of dwarf galaxies (Binggeli & Popescu 1995; Sánchez-Janssen et al. 2010). The orientation parameters of different isophotes often show relatively large variations with radii, that we used to estimate the uncertainties in PAopt and (2∘ to 6∘, except for NGC 4214 that is very close to face-on). The resulting orientation parameters are provided in Appendix B (Table 8). The sky-subtracted images and isophotal maps are presented in Appendix C.
| Name | Ref. | ||||
|---|---|---|---|---|---|
| () | (kpc) | (kpc) | |||
| Galaxies with a regularly rotating H I disk | |||||
| NGC 1705 | 11.12.9 | 2.1 | 1.5 | 1.4 | a |
| NGC 2366 | 6217 | 6.8 | 4.4 | 1.5 | b |
| NGC 4068 | 14.91.6 | 3.1 | 1.8 | 1.7 | b |
| NGC 4214 | 438 | 5.5 | 2.2 | 2.5 | b |
| NGC 6789 | 1.80.3 | 1.0 | 0.7 | 1.4 | a |
| UGC 4483 | 2.90.5 | 1.4 | 0.6 | 2.3 | a |
| I Zw 18 | 213 | 3.3 | 0.5 | 6.6 | c |
| I Zw 36 | 6.71.3 | 1.9 | 0.9 | 2.1 | a |
| SBS 1415+437 | 20.14.6 | 4.3 | 2.4 | 1.8 | a |
| Galaxies with a kinematically disturbed H I disk | |||||
| NGC 625 | 9.72.2 | 2.6 | 3.3 | 0.8 | a |
| NGC 1569 | 29.14.5 | 3.9 | 3.0 | 1.3 | b |
| NGC 4163 | 1.50.2 | 1.1 | 1.0 | 1.1 | b |
| NGC 4449 | 30077 | 8.9 | 3.3 | 2.7 | b |
| NGC 5253 | 13.83.4 | 3.1 | 2.1 | 1.5 | a |
| UGC 6456 | 4.50.5 | 1.8 | 1.2 | 1.5 | c |
| UGC 9128 | 1.30.2 | 0.9 | 0.6 | 1.5 | b |
| Galaxies with unsettled H I distribution | |||||
| UGC 6541 | 1.20.2 | … | 0.9 | … | c |
| UGCA 290 | 1.40.2 | … | 0.9 | … | a |
For 11 galaxies in our sample, Swaters & Balcells (2002) and Papaderos et al. (2002) derived -band luminosity profiles that were used to estimate the scale length and the central surface brightness of the old stellar component by fitting an exponential law to their outer parts. For the remaining 7 objects, we derived luminosity profiles both for the whole galaxy and for the approaching/receding sides separately, by azimuthally averaging the -band images over concentric ellipses. We did not correct the profiles for internal extinction, as BCDs are usually metal-poor (see Table 1) and the dust content is expected to be low. Finally, we estimated the central surface brightness and scale length of the old stellar component by fitting an exponential law to the side of the disk that is least affected by the starburst (as in Lelli et al. 2012b for UGC 4483).
4 H I distribution and kinematics
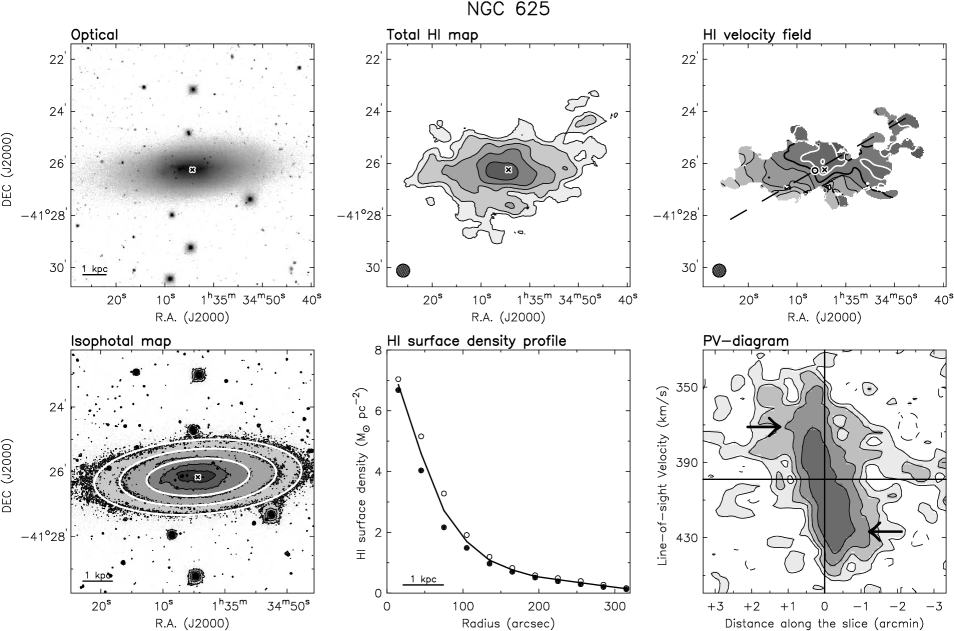
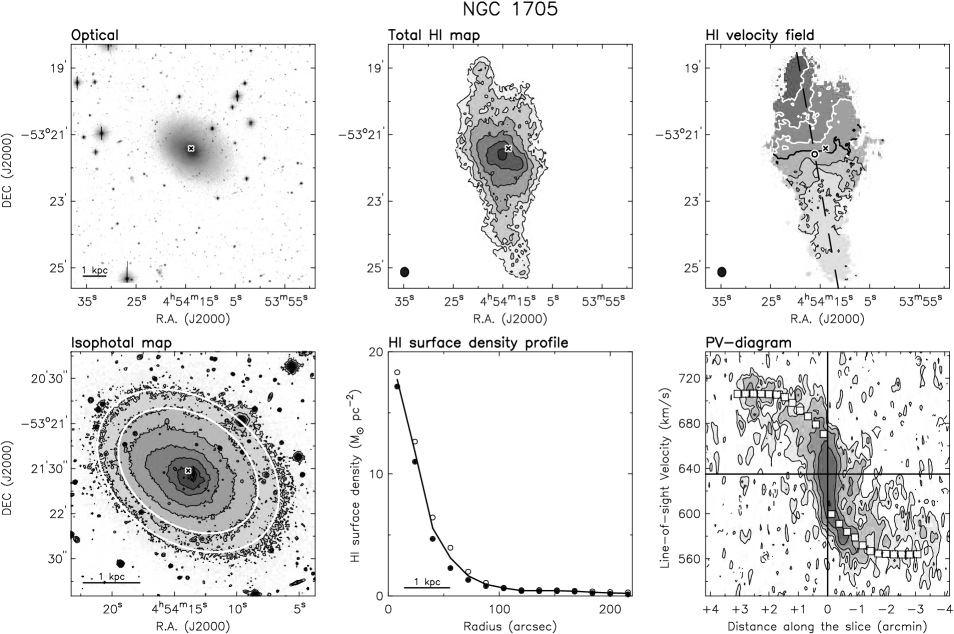
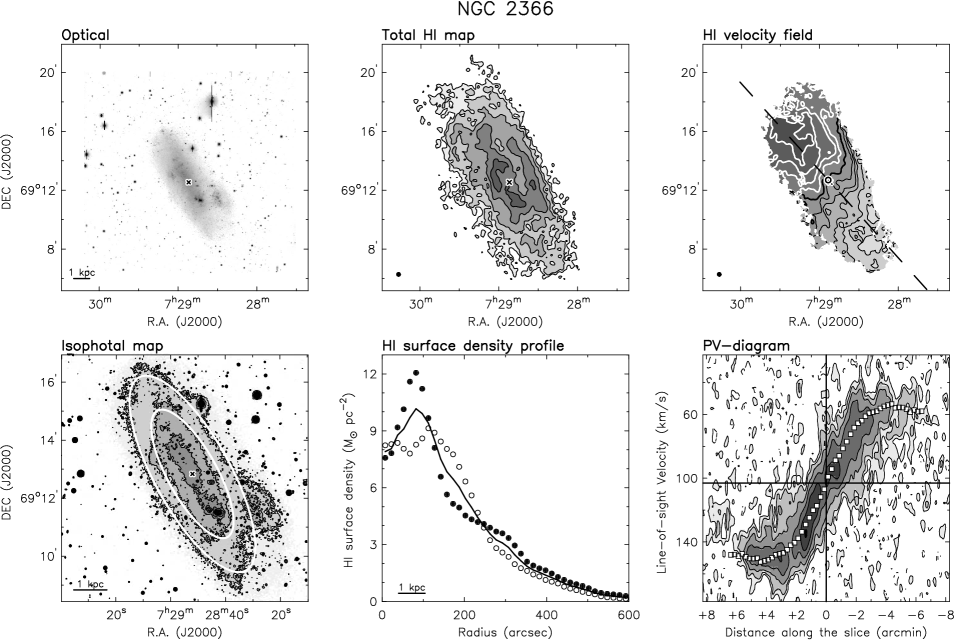
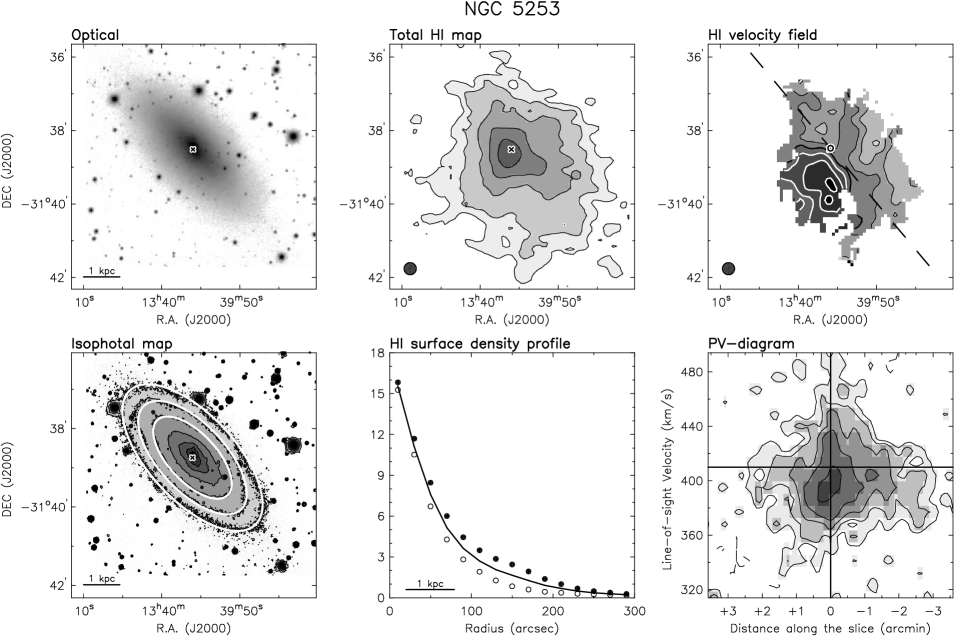
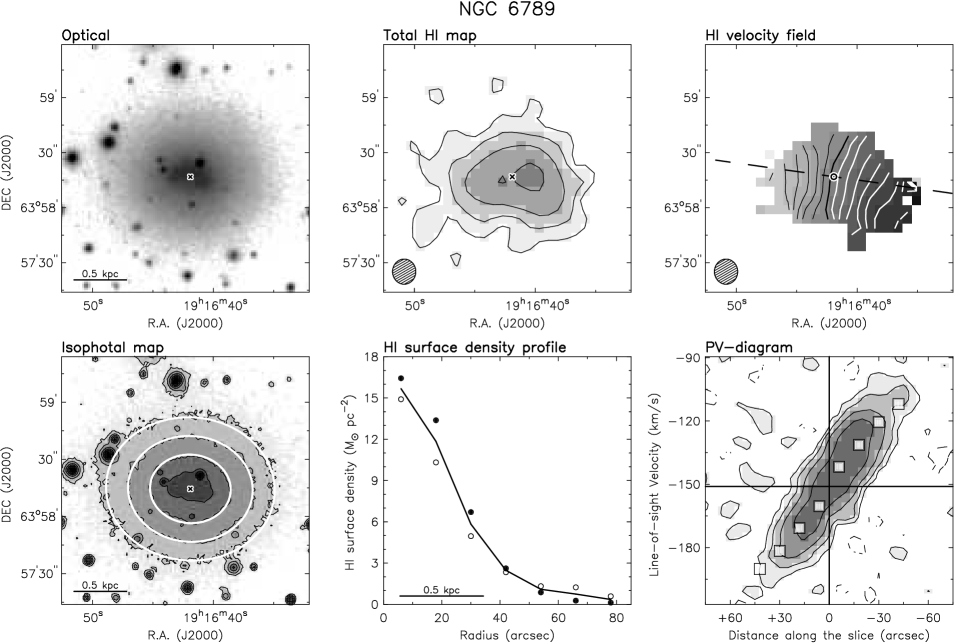
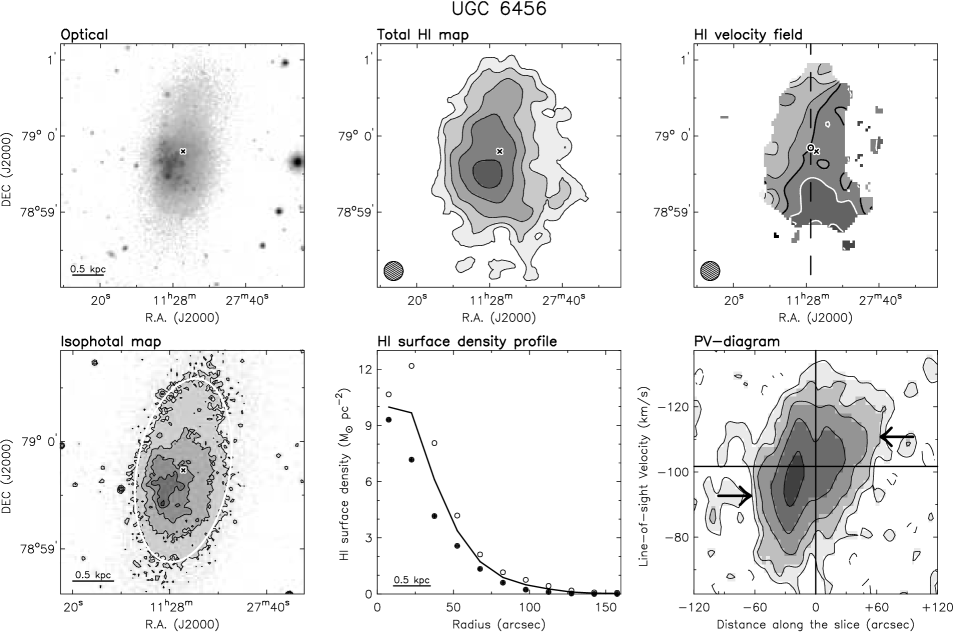
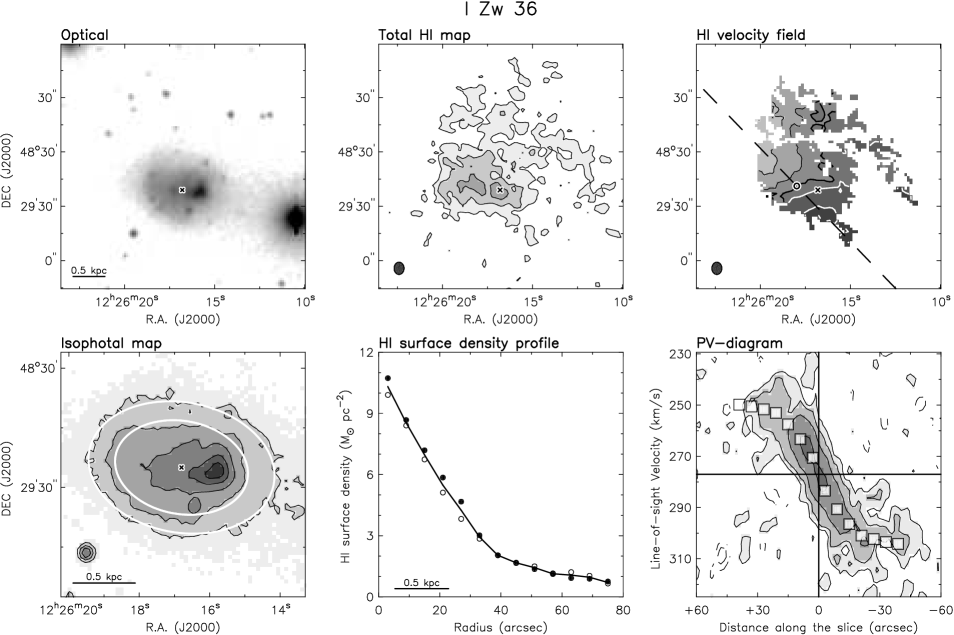
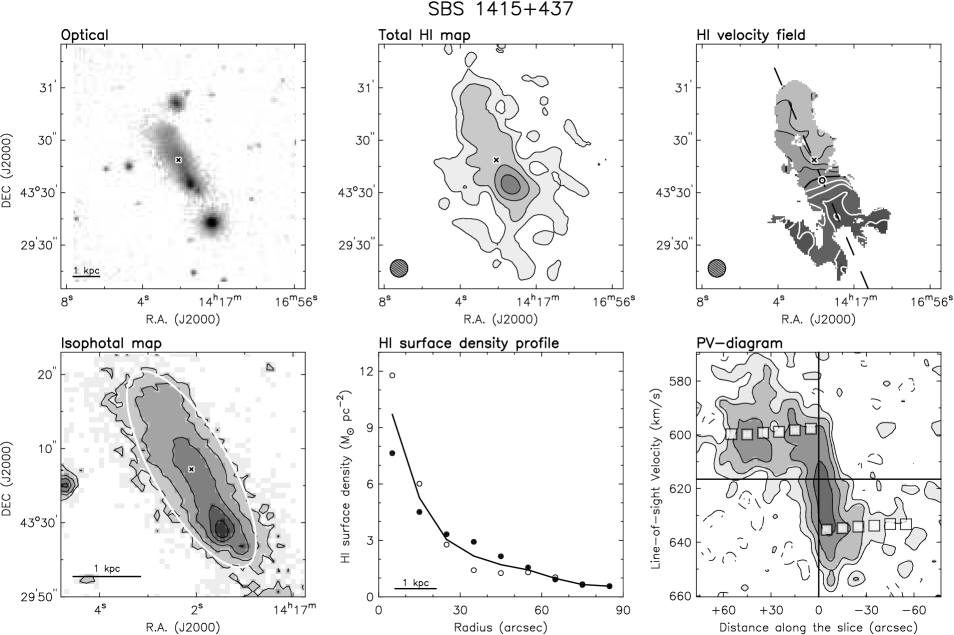
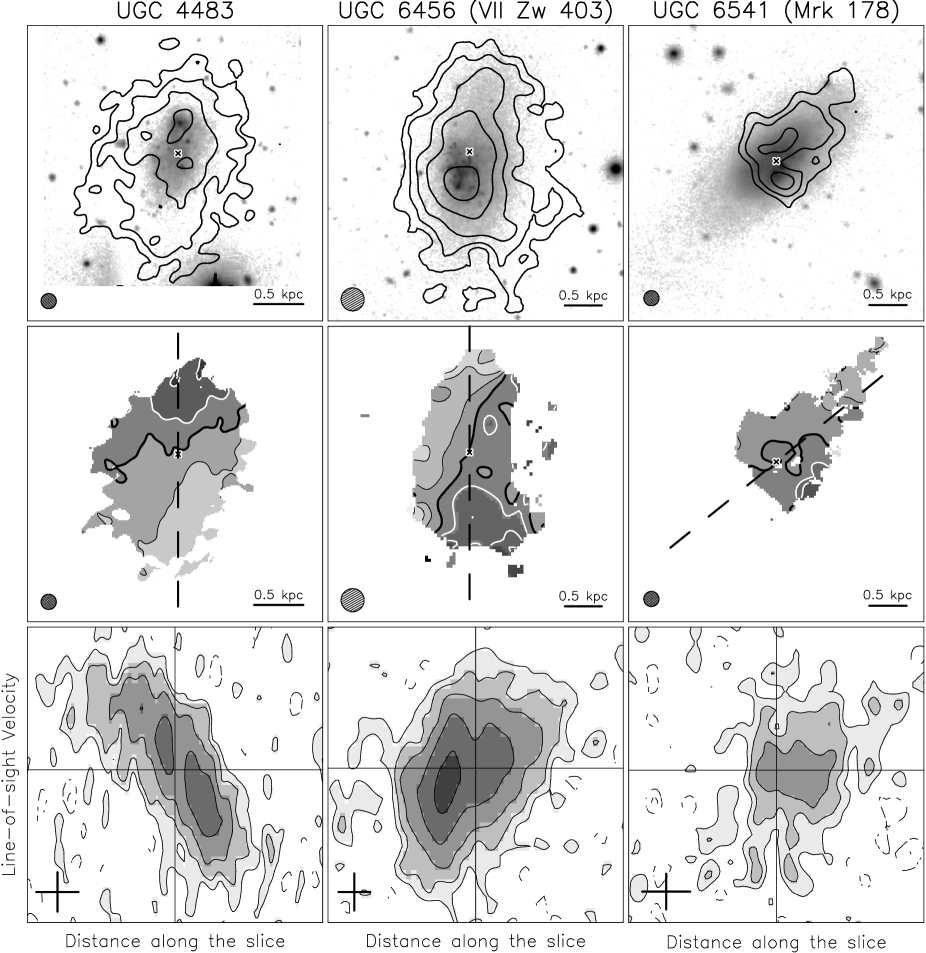
In the following, we discuss the distribution and kinematics of the high-column-density gas associated with the stellar component of BCDs. In Appendix A we discuss individual galaxies in detail and compare our results to previous studies, while in Appendix C we present an atlas with optical images, isophotal maps, total H I maps, H I surface density profiles, H I velocity fields, and PV-diagrams.
Based on the H I morphology and kinematics, we classify starbursting dwarfs into three main families:
-
•
BCDs with a regularly rotating H I disk (50).
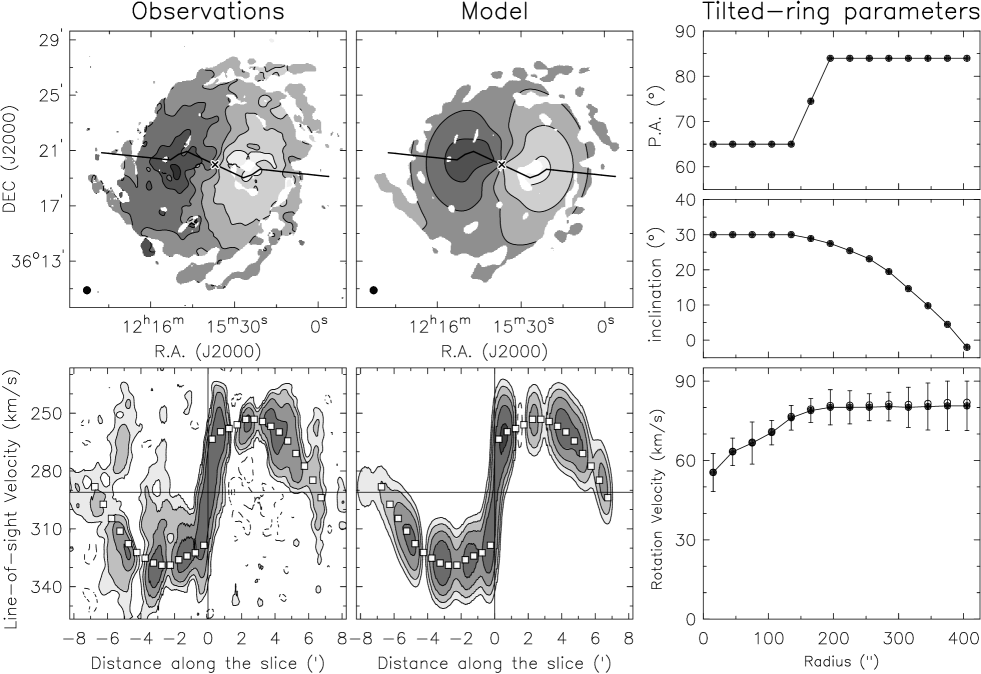
The PV-diagram along the H I major axis shows a regular velocity gradient (see Fig. 1, left). The VF displays a pattern that is typical of a rotating disk, although minor asymmetries caused by non-circular motions may be present. In some cases, the kinematical center and PA may not coincide with the optical ones. For these galaxies, we derive rotation curves (see Sect. 5). -
•
BCDs with a kinematically disturbed H I disk (40).
The H I distribution resembles a disk, but the PV-diagrams and the VF are irregular and asymmetric (see Fig. 1, center). For these galaxies, it is not possible to derive a reliable rotation curve, but we obtain rough estimates of the kinematical parameters and of the rotation velocity in the outer parts (see Sect. 6). -
•
BCDs with unsettled H I distributions (10).
Both the H I distribution and kinematics are irregular and asymmetric (see Fig. 1, right), and they are inconsistent with a rotating disk.
For the 16 galaxies with a H I disk, we derived H I surface density profiles by azimuthally averaging the H I maps over ellipses with a width of 1 beam-size. We assumed the orientation parameters defined by the H I kinematics (see Table 8). Following Swaters et al. (2002), we calculated i) the H I radius , defined as the radius where the H I surface density profile (corrected for inclination) reaches 1 pc-2, and ii) the optical radius , defined as 3.2 scale lengths . The latter definition allows us to compare the sizes of galaxies with different central surface brightnesses: for an exponential disk with mag arcsec-2 (Freeman 1970), corresponds to the isophotal radius . In our sample of BCDs, the ratio ranges from 1 to 3 (see Table 3), which is typical for gas-rich spirals and irregulars (Irrs) (e.g., Verheijen & Sancisi 2001). The only exception is I Zw 18 with , as the H I distribution extends towards a secondary stellar body (see Appendix C and Lelli et al. 2012a). Excluding I Zw 18, the mean value of is 1.70.5, in close agreement with the values found by Swaters et al. (2002) for 73 gas-rich dwarfs (1.80.8) and by Broeils & Rhee (1997) for 108 gas-rich spirals (1.70.5).

Previous H I studies have shown that BCDs have centrally-concentrated H I distributions with higher surface densities than typical Irrs (Taylor et al. 1994; van Zee et al. 1998, 2001; Simpson & Gottesman 2000). We confirm this result for a larger sample of galaxies. In Fig. 2 (left), we compare the mean H I surface density profile of late-type dwarfs obtained by Swaters et al. (2002, averaging over 73 objects) with the mean H I surface density profile of our starbursting dwarfs (averaging over the 16 objects with a H I disk). Note that the sample of Swaters et al. (2002) contains a few BCDs that are also part of our sample, but it is fully dominated by typical, non-starbursting Irrs. Fig. 2 (left) shows that BCDs, on average, have central H I surface densities a factor of 2 higher than typical Irrs. In several cases, the central, azimuthally averaged H I surface densities can be as high as 20 pc-2 (see e.g., NGC 1569 and NGC 1705 in Appendix C). The actual peak H I column densities can reach even higher values, up to 50-100 pc-2 in I Zw 18 at a linear resolution of 200 pc (Lelli et al. 2012a).
When comparing the H I surface densities of different galaxies, a possible concern is the different linear resolutions (in kpc) of the 21 cm-line observations. The 16 H I cubes used here have linear resolutions ranging from 0.2 to 0.7 kpc (see Table 7), while the 73 cubes used by Swaters et al. (2002) have linear resolutions ranging from 0.4 to 2 kpc (apart for 13 cases where the linear resolution is 2 kpc). To quantify the effect of beam smearing, we derived H I surface density profiles by smoothing our data to (as in Swaters et al. 2002), and checked that the distribution of the ratio /beam-size is comparable for the two samples. We found that the azimuthally averaged H I surface density of BCDs decreases by only 20 in the inner parts. Thus, we conclude that the difference between the mean H I surface density profile of BCDs and Irrs is not due to observational effects.
Fig. 2 (right) shows the mean H I surface density profiles of BCDs binned by SFR surface density (see Table 1). We used three bins (in units of yr-1 kpc-2): (five objects), (seven objects), and (four objects). It is clear that galaxies with higher values of have higher central H I surface densities, as one may expect from the Kennicutt-Schmidt law (e.g., Kennicutt 1998). We also derived mean H I surface density profiles binned by the value of the birthrate parameter (see Table 1), but found no strong relation between and the shape of the H I surface density profile. The relation between star formation, gas surface density, and internal dynamics is further investigated and discussed in Lelli2014.
Finally, we compare the overall H I kinematics of BCDs and typical Irrs. A detailed comparison between the rotation curves of BCDs and Irrs is presented in Lelli2014. Irrs generally have regularly rotating H I disks. For example, Swaters et al. (2009) studied the H I kinematics of 69 late-type dwarfs and could derive rotation curves for 62 objects (90). In contrast, for our sample of 18 starbursting dwarfs, rotation curves could be derived for only 50 of the galaxies, as the other objects have either a kinematically disturbed H I disk or an unsettled H I distribution. This suggests that complex H I kinematics are much more common in BCDs than in typical Irrs. This may be related to the starburst trigger (e.g., interactions/mergers or disk instabilities) and/or be a consequence of feedback from supernovae (SN) and stellar winds.
5 Galaxies with a regularly rotating H I disk
5.1 Derivation of the rotation curves
Nine galaxies in our sample (50) have a regularly rotating H I disk: NGC 1705, NGC 2366, NGC 4068, NGC 4214, NGC 6789, UGC 4483, I Zw 18, I Zw 36, and SBS 1415+437. For these objects, we derived rotation curves following a procedure similar to Swaters et al. (2009). As a first step, we obtained initial estimates of the geometrical parameters and of the rotation curve by fitting a tilted-ring model to the VF (Begeman 1987). These initial estimates were then used as input to build a 3D kinematic model, which was subsequently corrected by trial and error to obtain a model-cube that matches the observations. The model-cubes consider the spatial and spectral resolution of the observations, the observed gas distribution, the velocity dispersion, the disk thickness, and possibly non-circular motions. For I Zw 18 and UGC 4483, the derivation of the rotation curve is described in detail in Lelli et al. (2012a, b). In the following, we briefly describe the derivation of the rotation curves for the remaining galaxies.
The VF was fitted with a tilted-ring model using a ring width of one beam and weighting every point by , where is the azimuthal angle in the plane of the galaxy from the major axis. The parameters of the fit are the kinematical center , the systemic velocity , the position angle PAkin, the inclination , and the rotation velocity . We first left all the parameters free, and determined and by taking the average value within the innermost rings. Then, we fixed and , and determined PAkin and . Finally, we determined at every radius, keeping all the other parameters fixed. The errors on have been estimated by considering the differences in the rotation curves derived from the approaching and receding sides separately (see e.g., Lelli et al. 2012b).
The 3D disk models were built assuming that the H I kinematics is axisymmetric while the H I distribution is clumpy, i.e. the surface density varies with position as in the observed H I map (see Lelli et al. 2012a, b for details). We also assumed that i) the H I disk has an exponential vertical distribution with a constant scale height of pc, and ii) the velocity dispersion is constant with radius. The actual value of does not affect our results, since kinematic models with different scale heights (up to 1 kpc) show no significant differences in their channel maps and PV-diagrams. For the mean velocity dispersion , we estimated values between 8 and 12 km s-1 (see Table 4) by comparing several PV-diagrams obtained from models and observations; values higher than 12 km s-1 are generally ruled out. Possible variations of with radius of 2-3 km s-1 would generally produce no appreciable differences in the model-cubes. An exception is NGC 4214, which seems to have km s-1 for .
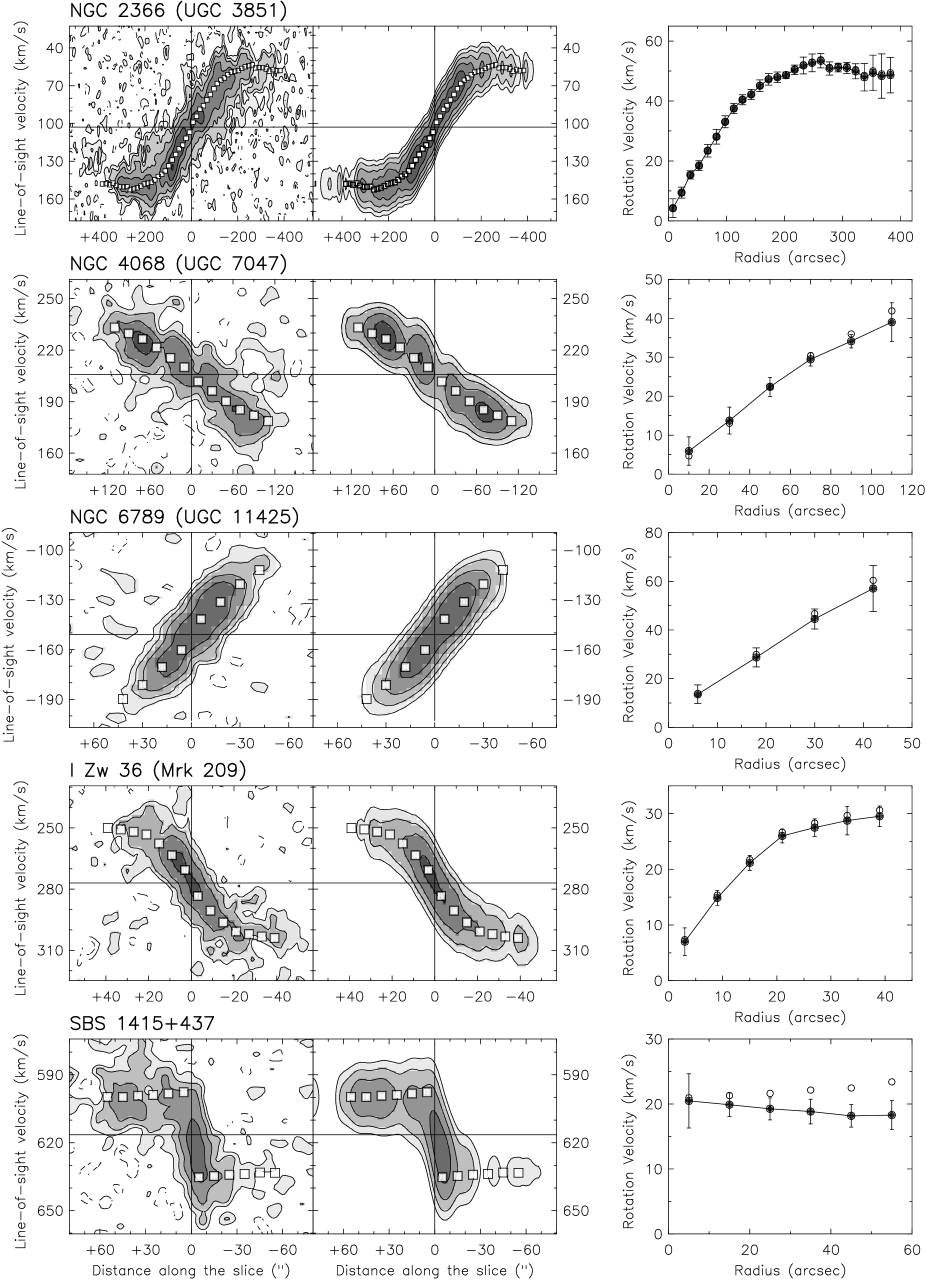
Figs. 3, 4, and 5 compare PV-diagrams obtained from both the observations and the models along the disk major axis. We generally found a good agreement between models and observations when increasing the values of derived with the tilted-ring fit to the VF by 2 to 3 km s-1 at the innermost radii. Exceptions are NGC 4214 and SBS 1415+437, as their inner velocity-points require a correction of 10 km s-1 due to severe beam-smearing effects. For NGC 1705, the corrections to the velocity-points are even larger (20 to 30 km s-1) because the H I disk appears close to edge-on in the outer parts and, thus, the VF only provides a poor representation of the rotation velocities. We also used PV-diagrams at the full resolution (see Table 7) to further check that beam-smearing effects do not significantly affect our rotation curves. In two cases (NGC 4068 and SBS 1415+437), the 3D disk models also suggest that the position of the kinematical center should be shifted by about one beam with respect to the results of the tilted-ring fit to the VF.
The observed PV-diagram of NGC 2366 shows H I emission close to the systemic velocity that cannot be reproduced by our disk model (see Fig. 3). This is likely due to extra-planar H I emission that is rotating at a lower velocity than the disk (a so-called “lagging H I halo”, see e.g., Fraternali et al. 2002), as it is observed in several nearby spiral galaxies (e.g., Sancisi et al. 2008). The modeling of a lagging H I halo is beyond the scope of this paper.
The galaxies NGC 4214 and NGC 1705 deserve special attention, as their H I disks are close to face-on in the inner parts and strongly warped in the outer parts. A tilted-ring fit to the VF, therefore, poses severe limitations when determining the dependence of PAkin and on radius (cf. Begeman 1987). We built a series of disk models assuming different types of warps. In the following, we only discuss our best models (shown in Figs. 4 and 5). For both galaxies, the warp is slightly asymmetric between the approaching and receding sides of the disk, and the actual dependence of on radius remains uncertain.
For NGC 4214, we found that PA and for , in agreement with the optical values within the uncertainties, while at larger radii PA and gradually decreases (see Fig. 4, right panels). This model provides a good match to the observed VF and PV-diagram taken along the line of nodes (see Fig. 4, left panels); minor discrepancies (20 km s-1) are observed, possibly due to non-circular motions caused by the inner stellar bar and/or streaming motions along the prominent H I spiral arms (see the H I map in Appendix C).
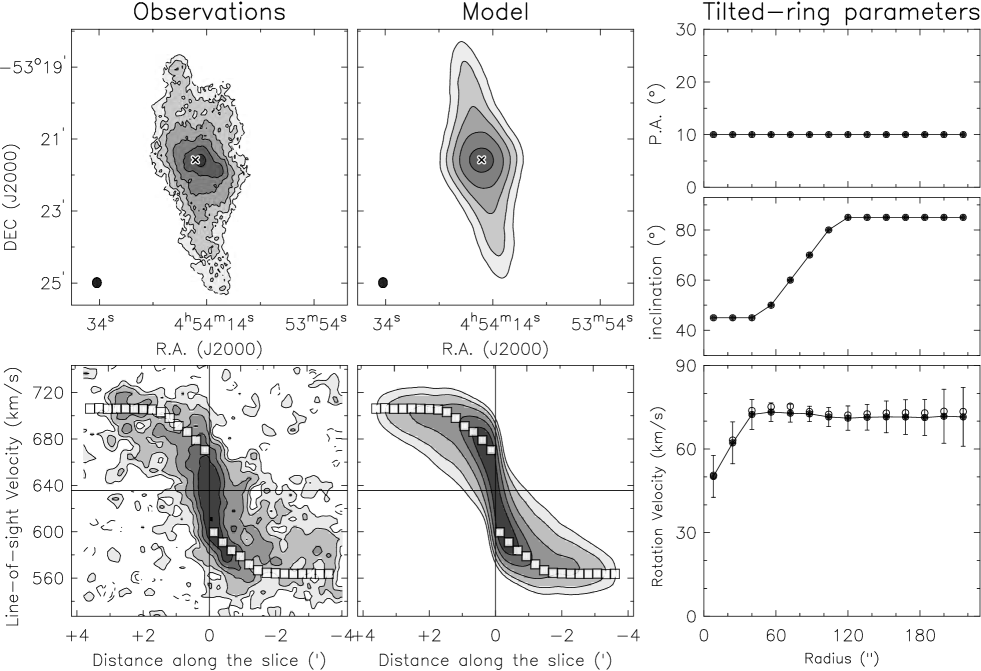
The H I disk of NGC 1705 appears highly inclined in the outer parts, thus the VF does not provide useful information regarding the dependence of on radius. For this galaxy, we built 3D models using an axisymmetric H I distribution in each ring, and determined the values of by comparing total H I maps and PV-diagrams obtained from the observed cube and the model-cubes. Similarly to Elson et al. (2013), we found that PA while abruptly changes at (see Fig. 5, right panels). We adopted, however, a higher value of in the outer parts than Elson et al. (2013) (85∘ instead of 65∘). This is necessary to reproduce the tails of H I emission towards that are clearly visible in PV-diagrams at 20′′ resolution (see Fig. 5, bottom panels). To fully reproduce these broad H I profiles, especially the H I emission in the “forbidden” quadrants of the PV-diagram, we also had to include radial motions of 15 km s-1 (cf. with NGC 2915, Elson et al. 2011). As a consequence of the high value of in the outer parts, the thickness of the H I disk must be pc in order to reproduce the observed total H I map (see Fig. 5, top panels).
5.2 Asymmetric-drift correction
| Galaxy | Funct. | ||||
|---|---|---|---|---|---|
| (M⊙ pc-2) | (kpc) | (kpc) | (km s-1) | ||
| NGC 1705 () | Exp | 24.0 | 0.7 | … | 12 |
| NGC 1705 () | Exp | 1.5 | 2.8 | … | 12 |
| NGC 2366 | Gauss | 9.1 | 0.8 | 6.31 | 10 |
| NGC 4068 | Gauss | 9.0 | 1.0 | 0.92 | 8 |
| NGC 4214 | Exp | 13.6 | 2.5 | … | 10 |
| NGC 6789 | Gauss | 16.4 | 0.0 | 0.37 | 8 |
| I Zw 36 | Exp | 11.9 | 0.7 | … | 9 |
| SBS 1415+357 | Exp | 11.8 | 1.4 | … | 9 |
For several galaxies in our sample, the observed rotation velocity is only a factor 2 or 3 larger than the H I velocity dispersion . In order to trace the underlying mass distribution, the observed rotation curves have to be corrected for pressure support. We calculated the asymmetric-drift correction following Meurer et al. (1996). We assumed that i) the H I kinematics is axisymmetric, ii) the H I velocity dispersion is isotropic, iii) the velocity dispersion and the scale-height of the H I disk are constant with radius, and iv) the H I surface density profile can be approximated either by an exponential function or by a Gaussian function . The circular velocity , corrected for asymmetric-drift, is thus given by
| (2) |
in the case of an exponential surface density profile, and by
| (3) |
in the case of a Gaussian surface density profile. For NGC 1705, the first assumption is not valid because the H I disk is strongly warped with an abrupt change of the inclination by 40∘ (see Fig. 5), thus we calculated the asymmetric-drift correction separately for the inner, face-on disk and for the outer, edge-on disk.
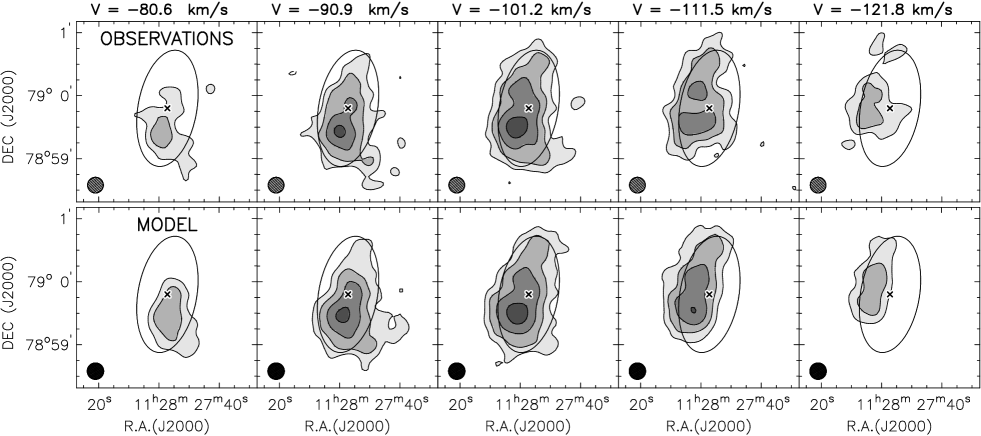
Table 4 provides the values of , derived by building 3D disk models, and the parameters for the exponential/Gaussian functions, obtained by fitting the observed H I surface density profiles. For NGC 1705, we fitted the H I surface density profile with 2 different exponential functions for the inner face-on disk and the outer edge-on disk. The open-circles in Figs. 3, 4, and 5 (right panels) show the asymmetric-drift-corrected rotation curves. The correction is generally smaller than the error bars, except for SBS 1415+437 that is rotating at only 20 km s-1 (see also UGC 4483 in Lelli et al. 2012b).
5.3 Non-circular motions
The PV-diagrams in Figs. 3, 4, and 5 clearly show that the H I kinematics of these galaxies is dominated by rotation. In several cases, however, a simple rotating-disk model cannot reproduce all the features of the observed cube. In Lelli et al. (2012a, b), we showed that the H I disks of I Zw 18 and UGC 4483 likely have radial motions of 15 and 5 km s-1, respectively. We did not find such regular radial motions in the 7 BCDs analyzed here, with the possible exception of NGC 1705 that shows double-peaked H I profiles near the center and may have radial motions of 15 km s-1. Several galaxies, however, do show kinematically-anomalous components that deviate from the main rotation pattern of the disk. We briefly discuss 3 interesting cases: NGC 1705, NGC 2366, and NGC 4214.
NGC 1705 has a H I “spur” to the North-West (see Meurer et al. 1998; Elson et al. 2013), that may be interpreted as an H I outflow associated with the H wind (Meurer et al. 1992). The VF of NGC 2366 shows a strong distortion to the North-West (see Appendix C), that Oh et al. (2008) interpreted as non-circular motions of km s-1 (see their Figure 3). Finally, NGC 4214 shows non-circular motions of 20 to 50 km s-1 (corrected for ) that are visible in several PV-diagrams taken across the disk (not shown here, but some kinematically-anomalous gas can be seen in the bottom panels of Fig. 4); these non-circular motions are likely associated with the H I spiral arms and/or the inner stellar bar.
6 Galaxies with a kinematically disturbed H I disk
Seven galaxies in our sample have a kinematically disturbed H I disk: NGC 625, NGC 1569, NGC 4163, NGC 4449, NGC 5253, UGC 6456, and UGC 9128. For these objects, we used channels maps and PV-diagrams to estimate , , PAkin, and the rotation velocity in the outer parts. For the inclination, we assumed the optical value. The values of the kinematic parameters have been tested by building 3D disk models with constant . These models cannot reproduce the observations in details, but indicate that the observed H I kinematics are consistent with a rotating disk. The resulting values for the kinematic parameters are rather uncertain.
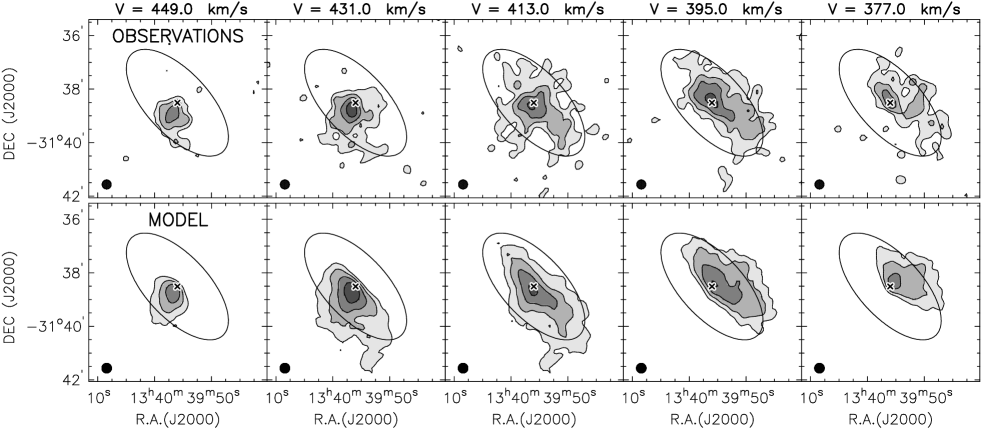
Two galaxies (NGC 5253 and UGC 6456) show a regular velocity gradient approximately along the H I minor axis (see the VFs in Appendix C). Velocity gradients along the H I minor axis have also been observed in other BCDs and interpreted as unusual rotation around the major axis (e.g., Thuan et al. 2004; Bravo-Alfaro et al. 2004). This peculiar kinematic behavior, however, can also be interpeted as a H I disk with strong radial motions (e.g., López-Sánchez et al. 2012). We built 3D disk models assuming the PA suggested by the total H I map (consistent with the optical value within the errors) and tried different combinations of circular and radial motions. Our best-models are shown in Figs 6 and 7. For UGC 6456, the H I emission can be reproduced by a combination of circular and radial motions ( km s-1, see Fig. 6). The case of NGC 5253 is even more extreme, as the radial component is 25 km s-1 while the rotation is constrained to be 5 km s-1 (see Fig. 7). In our opinion, strong radial motions are a more likely interpretation than rotation around the major axis, since gas inflows/outflows are expected in starburst galaxies.
For UGC 6456, it is not possible to distinguish between inflow and outflow, as it is unknown which side of the disk is nearest to the observer. For NGC 5253, instead, shadowing of the X-ray emission suggests that the southern side of the disk is the nearest one (Ott et al. 2005a), implying that the radial motion is an inflow. For both galaxies, the inflow timescale is 100-200 Myr, thus comparable with the starburst duration (see McQuinn et al. 2010b). We also calculated the gas inflow rates (the factor 1.33 takes the contribution of Helium into account) and found that they are about 1 order of magnitude higher than the current SFRs (from McQuinn et al. 2010a): for NGC 5253 M⊙ yr-1 and SFR0.16 M⊙ yr-1, while for UGC 6456 M⊙ yr-1 and SFR0.02 M⊙ yr-1. Similar results can be derived for I Zw 18 and UGC 4483, which show a global radial motion superimposed on a regularly rotating H I disk (Lelli et al. 2012a, b): for I Zw 18 M⊙ yr-1 and SFR0.1 M⊙ yr-1, while for UGC 4483 M⊙ yr-1 and SFR0.01 M⊙ yr-1. If the hypothesis of a radial inflow is correct, these results would imply that only 10 of the inflowing gas is converted into stars, in line with several estimates of the star-formation efficiencies in dwarf galaxies (e.g., Leroy et al. 2008).
7 Mass models
7.1 Preliminary considerations
In Sect. 5 we derived rotation curves for nine BCDs with a regularly rotating H I disk, while in Sect. 6 we estimated the outer rotation velocities of seven BCDs with a kinematically disturbed H I disk. In several cases, we found that the values for the kinematical center, PA, and do not coincide with the optical ones (see Table 8). Non-circular motions are also present in the H I disks of several galaxies. This raises the question as to whether the H I disks are in a fully-stable configuration and the observed rotation velocities are suitable to investigate the mass distributions in these galaxies.
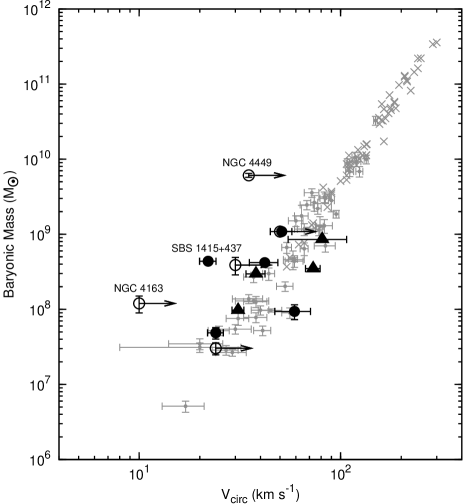

In Fig. 8, we consider the location of the starbursting dwarfs in our sample on the baryonic Tully-Fisher relation (BTFR, McGaugh et al. 2000). We exclude UGC 6456 and NGC 5253 as their H I kinematics seems to be dominated by radial motions (Figs. 6 and 7), and UGCA 290 and UGC 6541 as they have unsettled H I distributions. We use data from McGaugh (2005) for star-dominated galaxies (grey crosses) and McGaugh (2012) for gas-dominated ones (grey dots). Most BCDs with a regularly rotating H I disk have flat rotation curves in the outer parts (Figs. 3, 4, and 5), thus we use the mean value of along the flat part (Verheijen 2001). In two cases (NGC 4068 and NGC 6789), however, the rotation curve does not reach the flat part, thus we use the maximum observed value of . One would expect these galaxies to deviate from the BTFR if keeps rising after the last measured point. For BCDs with a kinematically disturbed H I disk, our estimates of are considered as lower limits in Fig. 8 because i) they may not correspond to the flat part of the rotation curve, and ii) they have not been corrected for pressure support. As in McGaugh (2005, 2012), the total baryonic mass is calculated as ; the possible contributions of molecular and ionized gas are neglected. Note that McGaugh (2005, 2012) estimated using integrated colors and synthetic stellar population models, while our estimate of is based on the HST studies of the resolved stellar populations.
Fig. 8 shows that both BCDs with a regularly rotating H I disk (filled symbols) and BCDs with a kinematically disturbed H I disk (open symbols) follow the BTFR within the uncertainties, except for NGC 4163, NGC 4449, and SBS 1415+437. Thus, for the majority of galaxies in our sample, the observed rotation velocity is a reasonable proxy for the total dynamical mass within the H I radius. The three objects that strongly deviate from the BTFR may be unusual for the following reasons. NGC 4163 has a disturbed H I distribution with tails and plumes; it is unclear whether the observed velocity gradient (of only 10 km s-1) is really due to rotation. NGC 4449 is characterized by two counter-rotating gas systems (see VF in Appendix C and Hunter et al. 1999); we estimated the rotation velocity of the inner H I disk, that possibly does not correspond to the asymptotic velocity along the flat part of the rotation curve. It is unclear whether the outer gas system forms a rotating disk; intriguingly, its inferred circular velocity would be consistent with the BTFR. Finally, SBS 1415+437 has a kinematic center that is strongly off-set (800 pc) with respect to the optical center and to the centroid of the H I distribution; the lopsided H I morphology and kinematics may be explained by a pattern of elliptical orbits viewed almost edge-on (cf. Baldwin et al. 1980). A detailed investigation of these models is beyond the scope of this paper, but it is clear that the observed rotation curve might not be a reliable tracer of the dynamical mass.
Considering the uncertainties involved, we proceed as follows. In Sect. 7.2 we estimate global baryonic fractions within for the 14 objects in Fig. 8, while in Sect. 7.3 we build detailed mass models for four galaxies with a regularly rotating disk (NGC 2366, NGC 6789, NGC 4068, and UGC 4483). In Lelli et al. (2012a, b), we presented similar mass models for I Zw 18 and UGC 4483, respectively. For I Zw 18, the stellar mass from the HST studies is very uncertain, thus we built mass models assuming a maximum-disk. For UGC 4483, instead, we used the HST information on the stellar mass to break the “disk-halo degeneracy” (van Albada & Sancisi 1986); here we extend our previous analysis on UGC 4483 by making different assumptions about the IMF and including the gravitational contribution of molecules. We do not decompose the rotation curves of NGC 1705, I Zw 36, and SBS 1415+437 because the optical and kinematical centers show a strong off-set ( disk scale length), thus it is not possible to calculate the gravitational contributions of stars, gas, and DM using a common dynamical center. We also exclude NGC 4214 because the H I disk is close to face-on and strongly warped.
7.2 Baryonic fractions
As we mentioned in Sect. 2, the HST studies of the resolved stellar populations provide a direct estimate of the total stellar mass of a galaxy. For seven objects, however, these stellar masses are lower limits because either the HST field of view only covers a small portion of the galaxy (NGC 1705, NGC 4214, and NGC 625), or the ancient SFH (1 Gyr) is uncertain due to the limited photometric depth (I Zw 18 and UGCA 290), or both (I Zw 36 and UGC 6541). Moreover, the values of depend on the assumed IMF and on the mass returned to the ISM by stellar ejecta. The stellar masses in Table 1 are calculated assuming a Salpeter IMF from 0.1 to 100 M⊙ and a gas-recycling efficiency of 30; a Kroupa IMF would give stellar masses lower by a factor of 1.6 (McQuinn et al. 2012). In Appendix B (Table 9), we provide three different estimates for the baryonic mass within (in order of increasing mass): i) , where is the stellar mass assuming a Kroupa IMF and is the H I mass within ; ii) , where is the stellar mass assuming a Salpeter IMF; and iii) , where we also include an indirect estimate of the molecular mass .
The molecular content of dwarf galaxies is very uncertain as they usually have low metallicities and the CO-line, which traces the molecular hydrogen, is often undetected (e.g., Taylor et al. 1998). Moreover, even when the CO-line is detected, the conversion factor from CO luminosity to H2 mass is poorly constrained, as it may differ from the Milky-Way value and vary with metallicity and/or other physical conditions (e.g., Boselli et al. 2002). Thus, we chose to indirectly estimate the molecular mass by using the correlation between SFR surface density and H2 surface density (e.g., Bigiel et al. 2008). In particular, we use Eq. 28 of Leroy et al. (2008), which assumes that the star-formation efficiency in dwarf galaxies is the same as in spirals (but see also Roychowdhury et al. 2011). This equation can be written as:
| (4) |
We use the average SFR over the last 10 Myr as obtained by the HST studies, and assume a systematic uncertainty of 30 on . The real uncertainty, however, may be larger as starbursting dwarfs may deviate from the relation.
| Galaxy | |||||||||
|---|---|---|---|---|---|---|---|---|---|
| (10-3 M⊙ pc-3) | (kpc) | ||||||||
| Kroupa | Sal. | Sal.+ Mol. | Kroupa | Sal. | Sal.+ Mol. | Kroupa | Sal. | Sal.+ Mol. | |
| NGC 2366 | 0.5 | 0.6 | 0.6 | 37 | 34 | 31 | 1.2 | 1.3 | 1.3 |
| NGC 4068 | 0.9 | 1.2 | 1.3 | 14 | 7 | 3 | 1.8 | 1.8 | 1.8 |
| NGC 6789 | 0.4 | 0.5 | 0.5 | 450 | 397 | 384 | 0.7 | 0.7 | 0.7 |
| UGC 4483 | 0.6 | 0.7 | 0.9 | 122 | 87 | 15 | 0.3 | 0.4 | 2.0 |
We used the three different estimates of the total baryonic mass to calculate baryonic fractions within . Assuming a spherical mass distribution, the dynamical mass within is given by , where is the asymmetric-drift-corrected circular velocity at . We estimated the errors on considering i) the random errors on due to possible kinematic asymmetries and/or non-circular motions, and ii) the errors on the inclination angle, which would cause a systematic shift of all the velocity-points but preserve the overall shape of the rotation curve (unless the H I disk is warped). Considering that , the error on is thus given by
| (5) |
The resulting dynamical masses and baryonic fractions are listed in Table 9. The errors on have been calculated by propagating the various uncertainties on , , , and . The three galaxies that deviate from the BTFR (NGC 4163, NGC 4449, and SBS 1415+437) have unphysically large baryonic fractions (1), further suggesting that the observed circular velocities are not adequate to trace the dynamical mass. For the remaining 11 objects, we plot against in Fig. 9. We find no clear trend with or with other physical parameters such as , , SFRp, and (see Table 1). The mean baryonic fractions within the stellar component are relatively high: 0.3 for a Kroupa IMF, 0.4 for a Salpeter IMF, and 0.5 for a Salpeter IMF plus molecules. Old stars (with ages 1 Gyr) generally provide the major contribution to these baryonic fractions, except for a few cases where either the atomic gas dominates (NGC 2366) or the molecular gas may be very important (NGC 1705 and UGC 4483, see Table 9).
7.3 Rotation curve decompositions
In this section, we decompose the rotation curves of four galaxies (NGC 2366, NGC 4068, NGC 6789, and UGC 4483), which have a regularly rotating H I disk centered on the stellar component. We follow standard procedures described by Begeman (1987). Similarly to Sect. 7.2, we compute three different mass models which assume i) a Kroupa IMF; ii) a Salpeter IMF; and iii) a Salpeter IMF plus the molecular mass inferred by Eq. 4. These mass models are shown in Fig. 10.

The gravitational contribution of the atomic gas was calculated using the H I surface density profiles and scaled to the total atomic gas mass as . In agreement with the models in Sect. 5.1, we assume that the gaseous disk has an exponential vertical density distribution with a scale height of 100 pc.
The gravitational contribution of the stellar component was calculated using -band surface brightness profiles and assuming that the stars are located in a disk with a vertical density distribution given by (van der Kruit & Searle 1981) with . If one assumes that or 0.4, would change by a few percent in the inner parts (). The amplitude of was scaled to the total stellar mass as (assuming either a Kroupa or a Salpeter IMF). This is equivalent to using a stellar mass-to-light ratio that is constant with radius (see Tab. 1).
To include the possible contribution of molecular gas, we simply assume that molecules are distributed in the same way as the stars and thus scale the amplitude of by . We also tried to estimate the shape of the molecular gas contribution using H and 24m images (from Dale et al. 2009 and Gil de Paz et al. 2003). These images show very clumpy and asymmetric distributions, that are completely dominated by strong star-forming regions and shell-like structures. We thus prefer to include the molecular gas contribution in . We note that -band and UV images may be better tracers of the molecular gas distribution than the -band images used here. However, since the color profiles of BCDs typically show a sharp gradient at small radii and a flat part in the outer regions (e.g., Papaderos et al. 2002; Gil de Paz & Madore 2005), the use of -band or UV surface brightness profiles would lead to appreciable differences in only at the innermost radii and have no significant effects on our general results.
For the DM distribution, we assume a pseudo-isothermal halo described by equation
| (6) |
where the central density and the core radius are the free parameters of the mass model. This is motivated by the fact that observed rotation curves of low-mass galaxies are well-reproduced by cored DM density profiles (e.g., Gentile et al. 2005; Oh et al. 2011b). Since the H I rotation curves are not well sampled (except for NGC 2366), the parameters of the DM halo cannot be determined with high accuracy. In particular, for NGC 6789 and NGC 4068, the core radius is completely unconstrained, thus we assumed . Given these uncertainties, we did not explore other DM density profiles than the pseudo-isothermal one.
A baryonic disk is usually defined to be maximum if at 2.2 disk scale lengths (Sackett 1997; Bershady et al. 2011), where is the contribution to the rotation curve given by the baryons. The BCDs in Fig. 10 have to 0.6, except for NGC 4068 that has for a Kroupa IMF and for a Salpeter IMF (see Table 5). The latter result may suggest that a Salpeter IMF implies an unphysical, over-maximal disk for NGC 4068; however, if one assumes a nearly spherical stellar body with a scale height of 600 pc, a Salpeter IMF would give acceptable results with . The sub-maximal disks of NGC 2366, NGC 6789, and UGC 4483 are in line with the results of the DiskMass survey (e.g., Bershady et al. 2011; Westfall et al. 2011; Martinsson 2011), who measured the stellar velocity dispersions of a sample of spiral galaxies and found that . Note, however, that baryons are still dynamically significant, as to 0.6 correspond to baryonic fractions to 0.4 within 2.2 , in line with the results in Sect. 7.2.
8 Discussion
8.1 Comparison with other dwarf galaxies
In Sect. 4, we compared the H I distribution and kinematics of BCDs and Irrs. In agreement with previous studies (e.g., van Zee et al. 1998, 2001), we found that BCDs have central H I densities a factor of 2 higher than typical Irrs. The average extent of the H I disk with respect to the stellar component, instead, is similar for BCDs, Irrs, and spirals ( with defined as 3.2 exponential scale lengths ). We also found that complex H I kinematics are much more common in BCDs (50) than in typical Irrs (10), likely due to the effects of stellar feedback and/or of the triggering mechanism (interactions/mergers or disk instabilities). In Lelli2014, we present a comparison between the rotation curves of BCDs and those of Irrs, and discuss the link between the starburst, the gas concentration, and the gravitational potential (see also Lelli et al. 2012a, b). Here we compare the baryonic fractions of BCDs with those of gas-rich Irrs and gas-poor spheroidals (Sphs).
For gas-rich Irrs, maximum-disk decompositions of H I rotation curves usually result in high values of the stellar mass-to-light ratio, up to 15 in the -band (e.g., Swaters et al. 2011). These high values of are difficult to explain using stellar population synthesis models (e.g., Zibetti et al. 2009), suggesting that Irrs are dominated by DM at all radii. The detailed baryonic fractions of Irrs, however, remain uncertain because they depend on the assumed value of . For the BCDs in our sample, instead, we can directly calculate the values of using the stellar masses from the HST studies of the resolved stellar populations. Assuming a Salpeter IMF from 0.1 to 100 M⊙ and a gas-recycling efficiency of 30, we find that the mean value of is 1.5 (see Table 1). Photometric studies of BCDs (e.g., Papaderos et al. 1996) suggest that the starburst typically increases the total luminosity by a factor of 2, whereas studies of the SFHs (e.g., McQuinn et al. 2010b) indicate that the burst only produces a small fraction of the total stellar mass (10). Thus, it is reasonable to assume that Irrs have, on average, for a Salpeter IMF and for a Kroupa IMF.
Similarly to Sect. 7.2, we calculated the baryonic fractions of 30 gas-rich dwarfs using the -band luminosities, H I surface density profiles, and H I rotation curves from Swaters et al. (2002, 2009), and assuming . We only considered galaxies with 30∘ and high-quality rotation curves (, see Swaters et al. 2009), that are traced out to 3 and have km s-1 at the last measured point. We also calculated the baryonic fractions of several gas-poor dwarfs using the -band luminosities and dynamical masses from Wolf et al. (2010), and assuming . For the nearby Sphs Sculptor and Fornax, the stellar masses from de Boer et al. (2012a, b) imply, respectively, and (assuming a Kroupa IMF and a gas-recycling efficiency of 30). We only considered nine Sphs that have accurate estimates of the stellar velocity dispersion: the eight “classical” satellites of the Milky Way (Carina, Draco, Fornax, Leo I, Leo II, Sculptor, Sextans, and Ursa Minor) and NGC 185, which is a satellite of M31. For these Sphs, the baryonic fractions are computed at the 3D deprojected half-light radius (for an exponential density profile , see Wolf et al. 2010), thus they may be slightly overestimated with respect to those of Irrs and BCDs (computed at 3.2 ), since the DM contribution is expected to increase at larger radii.
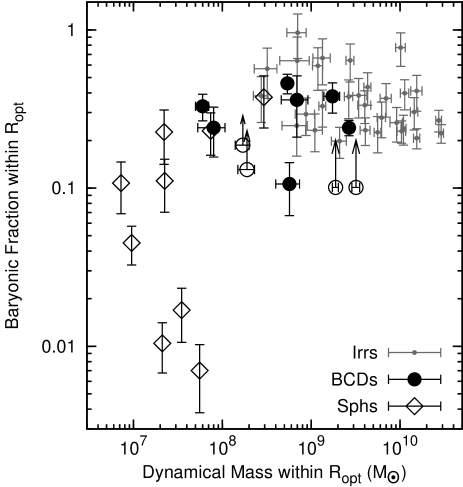
Figure 11 shows that starbursting dwarfs (open and filled circles) have baryonic fractions comparable with those of typical Irrs (grey dots) and of some Sphs (open diamonds). The Sphs with extremely low baryonic fractions () are Carina, Draco, Sextans and Ursa Minor, that are very close to the Milky Way and may have suffered from environmental effects (e.g., Mayer et al. 2006; Gatto et al. 2013). We conclude that the baryonic content of BCDs is similar to that of other types of dwarf galaxies, except for some low-luminosity satellities of the Milky Way.
8.2 Stellar feedback and gas outflows
Simulations of galaxy formation in a CDM cosmology indicate that low-mass galaxies must experience massive gas outflows at high redshifts: this is necessary to reproduce the observed stellar and DM properties of dwarf galaxies at (e.g., Governato et al. 2010, 2012; Sawala et al. 2012) as well as their number density (e.g., Okamoto et al. 2010; Sawala et al. 2013). BCDs in the Local Universe can be considered as good analogues of dwarf galaxies at high redshifts, since they have small potential wells (with km s-1) and are currently experiencing intense star formation, as indicated by their recent SFHs (1 Gyr) and high values of the birthrate parameter (see Table 1 and McQuinn et al. 2010a). Moreover, starbursting dwarfs at have clumpy morphologies that are remarkably similar to those of more massive star-forming galaxies at (see e.g., Fig. 20 of Elmegreen et al. 2009), further suggesting a similarity with high- star-forming objects. While starburst galaxies are common at high redshifts, BCDs are relatively rare in the Local Universe: Lee et al. (2009) analyzed H observations from the 11HUGS survey (Kennicutt et al. 2008) and estimated that BCDs constitute only 6 of the population of star-forming dwarfs at (but see McQuinn et al. 2010a regarding the limitations of H observations to identify starbursting dwarfs). BCDs, therefore, offer us the opportunity to study in detail the actual importance of stellar feedback and gas outflows in low-mass DM halos.
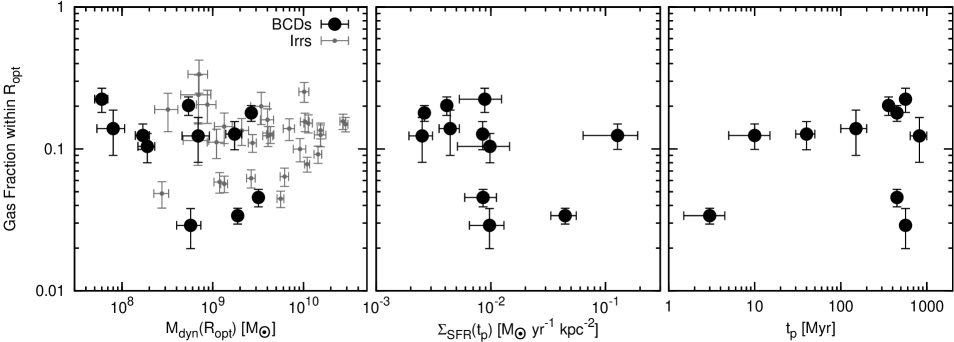
We computed atomic gas fractions within for the 11 BCDs with accurate estimates of (see Sect. 7.1) and for the 30 Irrs considered in Sect. 8.1 (from Swaters et al. 2009). Fig. 12 (left panel) shows that both Irrs and BCDs have relatively high gas fractions (), and only a few objects show gas fractions . Moreover, the gas fractions of BCDs are similar to those of Irrs. This suggests that either i) BCDs did not expell a large amount of gas out of their potential wells, or ii) their gas fractions were much higher at the beginning of the starburst, or iii) the gas expelled has been replenished by gas inflows. These three hypothesis are discussed in the following.
The possibility that massive gas inflows replenish the presumed outflowing gas seems unlikely, as we found evidence for radial motions in only four galaxies (see Sect. 6 and Lelli et al. 2012a, b). We do not know the direction of these radial motions, but if we interpret them as inflows, the inferred gas inflow rates would be only 1 order of magnitude higher than the current SFRs and, thus, consistent with a typical efficiency of 10 in converting gas into stars. Moreover, it is likely that these radial motions are recent and short-lived phenomena, as their typical timescales are comparable with the orbital times (Lelli et al. 2012b). For the other BCDs with a regularly rotating disk, any radial motion must be km s-1, which gives us a firm upper-limit to the mean gas inflow rate of 0.3 yr-1. This seems adequate to feed the current star formation and build up the central concentration of gas observed in BCDs (see Fig. 2), but leave little room for massive gas outflows.
In Fig. 12 (middle panel), we plot versus the SFR surface density , where SFRp is the peak SFR over the past 1 Gyr (see Table 1). The SFHs of five galaxies (NGC 2366, NGC 4068, UGC 4483, UGC 9128, and SBS 1415+437) show two distinct peaks with similar SFRs (consistent within 1). Here we consider the older peak as this is the one that formed more stars, given that the SFR is averaged over a larger time-bin (typically a factor of 4, see McQuinn et al. 2010a). One may expect that BCDs with higher values of expell a higher fraction of gas out of their potential well and, thus, might have lower values of . This is not observed for the 11 objects considered here. However, in some BCDs the starburst started only 10 Myr ago whereas in other ones it started more than 500 Myr ago (see e.g., McQuinn et al. 2010a). In Fig. 12 (right panel), we also plot versus the look-back time at SFRp, which can be considered as the typical “age” of the starburst. There is also no clear correlation between these two quantities. Similarly, we found no clear correlation between and the product or other parameters that quantify the relative strength of the burst, such as SFR, SFR, and the birthrate parameter (see Table 1). The lack of any significant trend between and the starburst properties suggests that BCDs did not eject a large quantity of gas out of their potential wells.
To further investigate the possible effects of outflows, we estimated the gas masses that might have been expelled from the potential wells of BCDs by using i) the escape velocities derived from the H I kinematics, ii) the burst energies derived from the observed SFHs, and iii) the feedback efficiencies derived by Mac Low & Ferrara (1999) and Ferrara & Tolstoy (2000) using both analytical calculations and high-resolution hydrodynamical simulations. Adopting Eq. 28 of Ferrara & Tolstoy (2000), the mass-loss rate due to stellar feedback is given by
| (7) |
where and are parameters related to the feedback efficiency, is the energy produced by supernovae and stellar winds, is the energy production rate, and is the velocity of the outflowing gas that must be higher than the escape velocity . The parameter represents the fraction of injected energy that is converted into kinetic energy; for radiative bubbles (Koo & McKee 1992; Ferrara & Tolstoy 2000). Since part of the kinetic energy accelerates material in the equatorial plane of the bubble, the parameter corresponds to the fraction of gas that is expelled from the galaxy almost perpendicular to the disk. Using hydrodynamical simulations, Mac Low & Ferrara (1999) found that is usually 7. Following Ferrara & Tolstoy (2000), we here assume that and , but we warn that the actual values of these parameters are uncertain. Maximum mass-loss rates occur when . Assuming that does not significantly change during the burst, the maximum mass that can be expelled from the galaxy is given by
| (8) |
where and are the initial and final times of the burst, and is the total energy created during the burst. In Table 5, we list for seven galaxies in our sample that have both good estimates of and . We adopt the values of calculated by McQuinn et al. (2010b) using the observed SFHs and the evolutionary synthesis code STARBURST99, which can simulate the energy produced by supernovae and stellar winds for a given SFR. We calculate as at the optical radius. Table 5 shows that, for , is very small, less than 10 of the current atomic gas mass. Exceptions are UGC 4483 and UGC 9128, which are among the lowest mass galaxies in our sample, with rotation velocities of only 20 km s-1. Only if one assumes that is a few times , the starbursting dwarfs in our sample could have expelled a gas mass comparable to the current, atomic gas mass.
| Galaxy | / | |||
|---|---|---|---|---|
| (erg) | (106 M⊙) | (M⊙ yr-1) | ||
| NGC 625 | 56.0 | 11.21.9 | 0.025 | 0.09 |
| NGC 1569 | 56.6 | 16.01.6 | 0.036 | 0.04 |
| NGC 2366 | 56.5 | 12.20.5 | 0.027 | 0.01 |
| NGC 4068 | 56.0 | 7.80.4 | 0.017 | 0.04 |
| NGC 4214 | 56.7 | 8.10.4 | 0.010 | 0.01 |
| NGC 6789 | 55.5 | 0.90.1 | 0.002 | 0.04 |
| UGC 4483 | 55.4 | 5.70.5 | 0.007 | 0.14 |
| UGC 9128 | 55.5 | 5.50.9 | 0.004 | 0.32 |
Relatively low values of are in line with the results of both optical and X-ray observations. Studies of the H kinematics have shown that galactic winds are common in BCDs, but the velocities of the H gas are usually smaller than the escape velocities (Martin 1996, 1998; van Eymeren et al. 2009a, b, 2010), implying that the ionized gas is gravitationally bound to the galaxy. Similar results have been found by studies of the Na D absorption doublet (Schwartz & Martin 2004). X-ray observations have revealed that several starbursting dwarfs have a diffuse coronae of hot gas at K, which are likely due to outflows but have low masses, 1 of the current H I mass (Ott et al. 2005a, b). The observational evidence, therefore, suggests that galactic winds are common in nearby dwarf galaxies, but they do not expell a significant fraction of the gas mass out of the potential well.
9 Summary and conclusions
We presented a systematic study of the H I content of 18 starbursting dwarf galaxies, using both new and archival observations. We only selected nearby galaxies that have been resolved into single stars by HST, thus providing information on their total stellar masses. According to their H I distribution and kinematics, we classified starbursting dwarfs into three main families: i) galaxies with a regularly rotating H I disk (50), ii) galaxies with a kinematically disturbed H I disk (40), and iii) galaxies with unsettled H I distributions (10). For galaxies with a regularly rotating H I disk, we derived rotation curves by building 3D kinematic models. For galaxies with a kinematically disturbed H I disk, we obtained estimates of the rotation velocities in the outer parts. Our main results can be summarized as follows:
-
1.
We firmly establish that the H I surface density profiles of starbursting dwarfs are different from those of typical Irrs. On average, starbursting dwarfs have central H I densities a factor of 2 higher than typical Irrs.
-
2.
The average ratio of the H I radius to the optical radius (defined as 3.2 exponential scale lengths) is 1.70.5, similar to the values found for gas-rich spiral and irregular galaxies.
-
3.
Disturbed H I kinematics are much more common in starbursting dwarfs (50) than in typical Irrs (10, see Swaters et al. 2009). This may be related to stellar feedback and/or to the starburst trigger (interactions/mergers or disk instabilities).
-
4.
Two galaxies (NGC 5253 and UGC 6456) show a velocity gradient along the H I minor axis. We modelled the H I emission by a disk dominated by radial motions and derived inflow/outflow timescales of 100-200 Myr. For NGC 5253, the radial motions appear to be an inflow and would imply a gas inflow rate 1 order of magnitude higher than the current SFR.
-
5.
For 11 galaxies with accurate estimates of the circular velocities, we calculated the baryonic fraction within the optical radius, using the stellar masses from the HST studies of the resolved stellar populations. We found that, on average, for a Kroupa IMF and for a Salpeter IMF. If molecular gas is also taken into account, the mean baryonic fraction may increase up to 0.5.
-
6.
For four galaxies with a regularly rotating H I disk centered on the stellar component, we decomposed the rotation curves into mass components. We found that baryons (both stars and gas) are generally not sufficient to explain the inner rise of the rotation curve, although they constitute of the total mass at 2.2 exponential scale lengths.
-
7.
Despite the star formation having injected 1056 ergs into the ISM in the last 500 Myr (McQuinn et al. 2010b), these starbursting dwarfs have gas fractions comparable with those of typical Irrs. This suggests that either starbursting dwarfs do not expell a large amount of gas out of their potential wells, or their gas fractions must have been much higher at the beginning of the burst. The lack of any correlation between the observed gas fractions and the starburst properties favors the former scenario.
Acknowledgements.
We are grateful to Renzo Sancisi for sharing insights and ideas that fueled this work. We thank Eline Tolstoy for stimulating discussions. We also thank Ed Elson and Angel R. Lopez-Sanchez for providing us with the H I datacubes of NGC 1705 and NGC 5253, respectively, and Polychronis Papaderos for the H-subtracted HST image of I Zw 18. We finally thank the members of the WHISP, THINGS, and LITTLE-THINGS projects for having made the H I datacubes publicly available. FL acknowledges the Ubbo Emmius bursary program of the University of Groningen and the Leids Kerkhoven-Bosscha Fund. FF acknowledges financial support from PRIN MIUR 2010-2011, project “The Chemical and Dynamical Evolution of the Milky Way and Local Group Galaxies”, prot. 2010LY5N2T.Appendix A Notes on individual galaxies
A.1 Galaxies with a regularly rotating H I disk
NGC 1705 has a strongly warped H I disk. Our rotation curve rises
more steeply than those of Meurer et al. (1998) and Elson et al. (2013)
because we applied a beam-smearing correction to the inner velocity-points
using 3D disk models (see Fig. 5). Meurer et al. (1998) and
Elson et al. (2013) decomposed their rotation curves into mass components
and found that DM dominates the gravitational potential at all radii.
We did not build a detailed mass model because the optical
and kinematic centers differ by 550 pc, while PAopt
and PAkin differ by 45∘.
NGC 2366 has an extended H I disk with a strong kinematic distortion
to the North-West (see its velocity field in Appendix C). Our
rotation curve is in overall agreement with previous results (Hunter et al. 2001; Thuan et al. 2004; Oh et al. 2008; Swaters et al. 2009; van Eymeren et al. 2009a), but we do not confirm the
declining part of the rotation curve found by Hunter et al. (2001) and
van Eymeren et al. (2009a) at . This latter result appears to be
caused by an anomalous H I cloud that lies at
km s-1 along the major axis ( from the galaxy center to the
North, see the PV-diagram in Fig. 3 and Appendix C).
NGC 4068 has a H I distribution characterized by a central depression and
several shell-like structures. The H I kinematics is slightly lopsided. Our rotation
curve agrees with the one of Swaters et al. (2009) within the errors.
NGC 4214 has a H I disk with multiple spiral arms. Intriguingly, the optical
and H I spiral arms wind in opposite directions (clockwise and counter-clockwise,
respectively). The H I disk is close to face-on and strongly warped, thus the
rotation curve is uncertain. In the inner parts, our rotation curve rises more
steeply than the one derived by Swaters et al. (2009); the difference seems to be
due to a different choice of the dynamical center (see the PV-diagram in
Swaters et al. 2009).
NGC 6789 has a compact H I disk that extends out to only 3.5 optical
scale lengths. The inclination is uncertain: we derived
using 3D disk models.
UGC 4483 has been studied in Lelli et al. (2012b).
I Zw 18 has been studied in Lelli et al. (2012a).
I Zw 36 has an extended and asymmetric H I distribution (see Ashley et al. 2013),
but in the central parts the H I forms a compact, rotating disk. The optical and
kinematic centers are offset by 12′′ (340 pc), while PAopt
and PAkin differ by 36∘.
SBS 1415+437 is a prototype “cometary” BCD, as the starburst region
is located at the edge of an elongated stellar body. Remarkably, the kinematic
center does not coincide with the optical one but with the starburst region to
the South (see Appendix C; the object at R.A.14h
17m 00s and Dec.43∘ 29′ 45′′ is a foreground
star). The lopsided H I distribution and kinematics may be due to a pattern
of elliptical orbits centered on the starburst region (cf. Baldwin et al. 1980).
A.2 Galaxies with a kinematically disturbed H I disk
NGC 625 has been previously studied by Côté et al. (2000) and Cannon et al. (2004).
Côté et al. (2000) suggested that the complex H I kinematics is due to an interaction/merger,
whereas Cannon et al. (2004) argued that it is best described by a gaseous outflow
superimposed on a rotating disk. We find it difficult to distinguish between these
two possibilities. It is clear, however, that the galaxy has a inner, rotating
disk with km s-1 (see PV-diagram in Appendix C).
NGC 1569 has been previously studied by Stil & Israel (2002) and Johnson et al. (2012).
Both studies derived a rotation curve by fitting the H I velocity field with a tilted-ring
model. The PV-diagram along the major axis, however, does not show any sign of rotation
in the inner parts (R1′, see Appendix C). Moreover, the H I line-profiles are very broad and asymmetric, likely due to strong non-circular motions.
For these reasons, we restrict our analysis to the rotation velocity in the outer parts
(50 km s-1).
NGC 4163 shows a very small velocity gradient of 10 km s-1. The
complex H I kinematics may be due to the low ratio. The
PA of the stellar body and of the H I disk significantly differ by 40∘.
NGC 4449 has been previously studied by Hunter et al. (1998, 1999), who
found that the H I distribution forms 2 counter-rotating systems. For the inner H I disk, we find a rotation velocity of 35 km s-1. It is unclear whether the
outer gas system is really a counter-rotating disk or is formed by two or three H I tails wrapping around the inner disk (similarly to I Zw 18, see Lelli et al. 2012a).
NGC 5253 has been previously studied by Kobulnicky & Skillman (2008) and
López-Sánchez et al. (2012), who discussed the possibility of gas inflows/outflows
along the minor axis of the galaxy. The data are, indeed, consistent with a H I disk with km s-1 and km s-1
(see Fig. 7). Shadowing of the X-ray emission indicates that the
southern side of the galaxy is the nearest one to the observer (Ott et al. 2005a),
suggesting that the radial motions are an inflow.
UGC 6456 has been previously studied by Thuan et al. (2004) and Simpson et al. (2011).
Simpson et al. (2011) derived a rotation curve using low-resolution (C+D array)
observations. They assumed different values of the PA for the approaching and
receding sides, which would imply an unusual, asymmetric warp starting within
the stellar component (see their Fig. 13). Our 3D models show that the H I kinematics may be simply explained by a disk with km s-1 (see Fig 6).
UGC 9128 has a H I disk that rotates at 25 km s-1, but
the VF is very irregular and the H I line profiles are broad and asymmetric,
possibly due to non-circular motions. The optical and kinematic PA differ
by 30∘.
A.3 Galaxies with unsettled H I distribution
UGC 6541 has a very asymmetric H I distribution. Gas emission is
detected only in the northern half of the galaxy. This may be the remnant
of a disrupted disk.
UGCA 290 has a H I distribution that is offset with respect to the
stellar component. The kinematics is irregular and dominated by a few distinct
H I clouds.
Appendix B Tables
| Name | Telescope | Original Beam | Original V | Final Beam | Final V | /beam | Rms Noise | Source | ||
|---|---|---|---|---|---|---|---|---|---|---|
| (asecasec) | (pcpc) | (km s-1) | (asecasec) | (pcpc) | (km s-1) | (mJy/beam) | ||||
| (1) | (2) | (3) | (4) | (5) | (6) | (7) | (8) | (9) | (10) | (11) |
| NGC 625 | VLA | 18.911.7 | 357221 | 2.6 | 30.030.0 | 567567 | 5.2 | 4.6 | 1.80 | a |
| NGC 1569 | VLA | 5.85.0 | 9682 | 2.6 | 10.010.0 | 165165 | 5.2 | 23.6 | 0.46 | b |
| NGC 1705 | ATCA | 16.714.5 | 413358 | 4.0 | 16.714.5 | 413358 | 7.0 | 5.5 | 0.40 | c |
| NGC 2366 | VLA | 6.95.9 | 10791 | 2.6 | 15.015.0 | 233233 | 5.2 | 29.2 | 0.66 | b |
| NGC 4068 | WSRT | 14.811.5 | 308240 | 2.5 | 20.020.0 | 417417 | 6.1 | 7.4 | 2.00 | d |
| NGC 4163 | VLA | 9.75.9 | 14186 | 1.3 | 10.010.0 | 145145 | 5.2 | 7.6 | 0.43 | b |
| NGC 4214 | VLA | 7.66.4 | 9984 | 1.3 | 30.030.0 | 393393 | 5.2 | 14.0 | 2.20 | b |
| NGC 4449 | VLA | 13.712.5 | 279254 | 5.2 | 20.020.0 | 407407 | 10.4 | 21.9 | 0.80 | e |
| NGC 5253 | ATCA | 13.67.5 | 231127 | 4.0 | 20.020.0 | 339339 | 9.0 | 9.1 | 0.95 | f |
| NGC 6789 | WSRT | 13.712.7 | 239222 | 2.5 | 13.712.7 | 239222 | 6.1 | 4.3 | 0.75 | a |
| UGC 4483 | VLA | 5.74.5 | 8870 | 2.6 | 10.010.0 | 155155 | 5.2 | 9.0 | 0.66 | g |
| UGC 6456 | VLA | 5.74.8 | 119100 | 2.6 | 15.015.0 | 313313 | 5.2 | 5.7 | 0.90 | a |
| UGC 6541 | VLA | 6.25.5 | 126112 | 1.3 | 10.010.0 | 204204 | 5.2 | … | 0.44 | b |
| UGC 9128 | VLA | 6.25.5 | 6659 | 2.6 | 15.015.0 | 160160 | 5.2 | 5.6 | 0.80 | b |
| UGCA 290 | VLA | 5.44.2 | 175136 | 1.9 | 10.010.0 | 325325 | 4.9 | … | 0.56 | a |
| I Zw 18 | VLA | 1.51.4 | 132123 | 1.3 | 5.05.0 | 441441 | 5.2 | 7.5 | 0.16 | h |
| I Zw 36 | VLA | 6.85.5 | 194157 | 2.6 | 6.85.5 | 194157 | 5.2 | 10.9 | 0.34 | b |
| SBS 1415+437 | VLA | 4.64.3 | 303283 | 1.9 | 10.010.0 | 659659 | 4.9 | 6.5 | 0.60 | a |
| Name | RAopt | Decopt | PAopt | RAkin | Deckin | PAkin | |||||
|---|---|---|---|---|---|---|---|---|---|---|---|
| (J2000) | (J2000) | (∘) | (∘) | (J2000) | (J2000) | (km s-1) | (∘) | (∘) | (pc) | ||
| (1) | (2) | (3) | (4) | (5) | (6) | (7) | (8) | (9) | (10) | (11) | (12) |
| Galaxies with a regularly rotating H I disk | |||||||||||
| NGC 1705 | 04 54 13.9 | -53 21 25 | 0.28 | 472 | 553 | 04 54 16.1 | -53 21 35 | 6352 | 45:85 | 105 | 552164 |
| NGC 2366 | 07 28 51.9 | +69 12 34 | 0.66 | 802 | 294 | 07 28 53.3 | +69 12 43 | 1031 | 685 | 422 | 15099 |
| NGC 4068 | 12 04 02.7 | +52 35 28 | 0.38 | 564 | 314 | 12 04 03.0 | +52 35 30 | 2062 | 446 | 243 | 0 |
| NGC 4214 | 12 15 38.8 | +36 19 39 | 0.09 | 265 | 4020 | 12 15 36.9 | +36 19 59 | 2911 | 30: | 65:84 | 393167 |
| NGC 6789 | 19 16 41.9 | +63 58 17 | 0.15 | 342 | 864 | 19 16 41.9 | +63 58 17 | -1512 | 437 | 825 | 0 |
| UGC 4483 | 08 37 03.4 | +69 46 31 | 0.47 | 633 | -135 | 08 37 03.4 | +69 46 31 | 1582 | 583 | 05 | 0 |
| I Zw 18 | 09 34 02.0 | +55 14 25 | 0.50 | 655 | 1351 | 09 34 02.0 | +55 14 25 | 7674 | 704 | 1455 | 0 |
| I Zw 36 | 12 26 16.8 | +48 29 39 | 0.30 | 492 | 803 | 12 26 18.0 | +48 29 41 | 2772 | 673 | 443 | 34074 |
| SBS 1415+437 | 14 17 02.1 | +43 30 19 | 0.66 | 803 | 305 | 14 17 01.7 | +43 30 07 | 6162 | 663 | 233 | 824280 |
| Galaxies with a kinematically disturbed H I disk | |||||||||||
| NGC 625 | 01 35 04.3 | -41 26 15 | 0.64 | 782 | 941 | 01 35 06.3 | -41 26 17 | 3986 | … | 12010 | 0 |
| NGC 1569 | 04 30 49.0 | +64 50 53 | 0.54 | 692 | 1183 | 04 30 51.9 | +64 50 56 | -8010 | … | 11510 | 31070 |
| NGC 4163 | 12 12 09.0 | +36 10 11 | 0.30 | 492 | 142 | 12 12 09.0 | +36 10 16 | 1584 | … | -2510 | 7262 |
| NGC 4449 | 12 28 10.8 | +44 05 37 | 0.40 | 573 | 553 | 12 28 11.3 | +44 05 58 | 2105 | … | 605 | 444173 |
| NGC 5253 | 13 39 56.0 | -31 38 31 | 0.53 | 682 | 432 | 13 39 56.0 | -31 38 31 | 41010 | … | 405 | 0 |
| UGC 6456 | 11 27 57.2 | +78 59 48 | 0.50 | 655 | -105 | 11 27 58.8 | +78 59 51 | -1024 | … | 05 | 0 |
| UGC 9128 | 14 15 56.8 | +23 03 22 | 0.28 | 476 | 336 | 14 15 57.6 | +23 03 08 | 1504 | … | 010 | 18168 |
| Galaxies with unsettled H I distribution | |||||||||||
| UGC 6541 | 11 33 28.9 | +49 14 22 | 0.50 | 654 | 1292 | … | … | 2502 | … | … | … |
| UGCA 290 | 12 37 22.1 | +38 44 41 | 0.50 | 653 | 473 | … | … | 4685 | … | … | … |
| Name | |||||||||||
|---|---|---|---|---|---|---|---|---|---|---|---|
| ——————————– (107 M⊙) ——————————– | (km s-1) | (107 M⊙) | |||||||||
| (1) | (2) | (3) | (4) | (5) | (6) | (7) | (8) | (9) | (10) | (11) | (12) |
| Galaxies with a regularly rotating H I disk | |||||||||||
| NGC 1705 | 20 | 6018 | 4.80.5 | 19 | 26 | 86 | 733 | 18536 | 0.10 | 0.14 | 0.47 |
| NGC 2366 | 263 | 82 | 364 | 645 | 746 | 826 | 512 | 26328 | 0.240.03 | 0.280.04 | 0.310.04 |
| NGC 4068 | 223 | 5.91.8 | 8.20.8 | 252 | 333 | 394 | 362 | 5413 | 0.460.12 | 0.610.16 | 0.720.19 |
| NGC 4214 | 28 | 124 | 111 | 32 | 42 | 54 | 794 | 325104 | 0.10 | 0.13 | 0.17 |
| NGC 6789 | 72 | 0.60.2 | 1.20.1 | 6.01.3 | 8.62.0 | 9.22.0 | 599 | 6024 | 0.100.05 | 0.140.07 | 0.150.07 |
| UGC 4483 | 1.00.2 | 2.10.6 | 1.00.1 | 2.00.2 | 2.30.2 | 4.40.6 | 212 | 6.61.3 | 0.300.07 | 0.360.08 | 0.680.17 |
| I Zw 18 | 1.7 | 72 | 1.60.2 | 3.2 | 3.8 | 11 | 384 | 163 | 0.20 | 0.24 | 0.67 |
| I Zw 36 | 0.8 | 4.71.4 | 1.50.1 | 2.5 | 2.8 | 7.5 | 303 | 194 | 0.13 | 0.14 | 0.38 |
| SBS 1415+437 | 173 | 7.62.3 | 6.80.7 | 202 | 263 | 344 | 222 | 275 | 0.740.16 | 0.980.22 | 1.260.28 |
| Galaxies with a kinematically disturbed H I disk | |||||||||||
| NGC 625 | 2610 | 0.80.2 | 6.40.6 | 256 | 3410 | 3510 | 305 | 7023 | 0.360.15 | 0.500.22 | 0.510.22 |
| NGC 1569 | 707 | 155 | 172 | 665 | 927 | 1079 | 505 | 17736 | 0.370.08 | 0.520.11 | 0.610.13 |
| NGC 4163 | 103 | 1.00.3 | 1.10.1 | 82 | 113 | 123 | 104 | 2.41.9 | 3.32.7 | 4.84.1 | 5.24.4 |
| NGC 4449 | 21035 | 18455 | 323 | 17422 | 25235 | 43665 | 355 | 9428 | 1.90.6 | 2.70.9 | 4.61.5 |
| NGC 5253 | 15421 | 319 | 6.80.7 | 10613 | 16321 | 19423 | 5 | … | … | … | … |
| UGC 6456 | 52 | 4.31.3 | 2.60.3 | 6.61.3 | 8.52.0 | 132 | 105 | … | … | … | … |
| UGC 9128 | 1.30.2 | 0.130.04 | 0.80.1 | 2.00.2 | 2.40.2 | 2.50.2 | 244 | 7.73.0 | 0.250.10 | 0.310.12 | 0.330.13 |
| Galaxies with unsettled H I distribution | |||||||||||
| UGC 6541 | 0.8 | 0.60.2 | 1.20.1 | 2.1 | 2.4 | 2.7 | … | … | … | … | … |
| UGCA 290 | 1 | 2.10.6 | 1.40.2 | 2.5 | 2.9 | 4.9 | … | … | … | … | … |
B.1 Properties of the H I datacubes
Column (1) gives the galaxy name, following the ordering NGC, UGC, UGCA, Zwicky, SBS.
Column (2) gives the radio interferometer used for the 21cm-line observations.
Column (3), (4), and (5) give the spatial and spectral resolutions of the original
cube. This cube is typically obtained using a Robust parameter .
Column (6), (7), and (8) give the spatial and spectral resolutions of the cube
after Gaussian smoothing.
Column (9) gives the ratio of the H I radius (given in
Table 3) to the final H I beam.
Column (10) gives the noise in the final cube.
Column (11) provides the reference for the original cube.
B.2 Optical and H I orientation parameters
Column (1) gives the galaxy name.
Column (2), (3), (4), (5) and (6) give the optical center, ellipticity,
inclination, and position angle. These values are derived by interactively
fitting ellipses to the outer isophotes. The inclination is calculated
assuming an oblate spheroid with intrinsic thickness .
Column (7), (8), (9), (10) and (11) give the kinematical center,
systemic velocity, inclination, and position angle. These values are
derived using H I velocity fields, channel maps, PV-diagrams, and
building 3D disk models.
Column (12) gives the projected offset between the optical
and kinematical centers. This is calculated as ,
assuming the galaxy distance given in Table 1. The error
is estimated as FWHM/2.35, where FWHM is the beam of the smoothed H I datacube (see Table 7). Projected distances smaller than
FWHM/2.35 are assumed to be zero.
B.3 Mass budget within the optical radius.
Column (1) gives the galaxy name.
Column (2) gives the stellar mass. This is calculated by integrating the galaxy SFH
and assuming a gas-recycling efficiency of 30. The SFHs were derived by fitting the CMDs
of the resolved stellar populations and assuming a Salpeter IMF from 0.1 to 100 M⊙.
Column (3) gives the molecular mass. This is indirectly estimated using Eq. 4,
which assumes that the star-formation efficiency in dwarfs is the same as in spirals.
Column (4) gives the H I mass within .
Column (5), (6), and (7) give the baryonic mass within assuming, respectively,
a Kroupa IMF, a Salpeter IMF, and a Salpeter IMF plus the possible contribution of molecules.
Column (8) gives the circular velocity at .
Column (9) gives the dynamical mass within calculated as
.
Column (10, 11, 12) gives the baryonic fraction within assuming,
respectively, a Kroupa IMF, a Salpeter IMF, and a Salpeter IMF plus molecules.
Italics indicate unphysical values 1.
Appendix C Atlas
In the following, we present overview figures for the 18 starbursting dwarfs in our sample.
For each galaxy, we show six panels including both optical and H I data.
Top-left: a sky-subtracted optical image in the or band.
The cross shows the optical center.
Bottom-left: an isophotal map (black contours) overlaid with a set of concentric
ellipses (white contours). The value of the outermost isophote is given
in the note; the isophotes increase in steps of 1 mag arcsec-2. The orientation
parameters for the ellipses ( and PAopt) are given in
Table 8. The cross shows the optical center. For I Zw 18, the isophotal
map was derived from a -band HST image after the subtraction of the H emission,
as the nebular emission dominates the galaxy morphology (see Papaderos et al. 2002).
Top-middle: the total H I map. The contour levels are at 1, 2, 4, 8, …
, where is the pseudo-3 contour, calculated
following Verheijen & Sancisi (2001). The value of is given in the note.
The cross shows the optical center. The ellipse shows the beam.
Bottom-middle: the H I surface density profile, derived by azimuthally averaging
over the entire H I disk (black line) and over the approaching and receding sides separately
(filled and open circles, respectively). In UGC 6541 and UGCA 290, H I emission is detected
only on one side of the galaxy, thus the H I surface density profile was derived using
the optical orientation parameters and averaging over a single side.
Top-right: the H I velocity field. Light and dark shading indicate approaching
and receding velocities, respectively. The thick, black line shows the systemic velocity.
The velocity interval between approaching (black) and receding (white) contours is given
in the note. The cross shows the optical center, while the circle shows the kinematic center.
The dashed line indicates the kinematic position angle. The ellipse shows the beam.
Bottom-right: Position-Velocity diagram taken through the kinematic center and along
the kinematic major axis. Contours are at -3, -1.5 (dashed), 1.5, 3, 6, 12, … .
The value of is given in Table 7. The vertical and horizontal lines
show the kinematic center and the systemic velocity, respectively. For galaxies with a
regularly rotating H I disk, squares show the rotation curve as derived in Sect. 5.1,
projected along the line of sight. For galaxies with a kinematically disturbed H I disk,
arrows show the estimated value of , projected along the line of sight.
References
- Annibali et al. (2013) Annibali, F., Cignoni, M., Tosi, M., et al. 2013, ArXiv e-prints
- Annibali et al. (2003) Annibali, F., Greggio, L., Tosi, M., Aloisi, A., & Leitherer, C. 2003, AJ, 126, 2752
- Ashley et al. (2013) Ashley, T., Simpson, C. E., & Elmegreen, B. G. 2013, AJ, 146, 42
- Baldwin et al. (1980) Baldwin, J. E., Lynden-Bell, D., & Sancisi, R. 1980, MNRAS, 193, 313
- Begeman (1987) Begeman, K. G. 1987, PhD thesis, , Kapteyn Institute, (1987)
- Berg et al. (2012) Berg, D. A., Skillman, E. D., Marble, A. R., et al. 2012, ApJ, 754, 98
- Bershady et al. (2011) Bershady, M. A., Martinsson, T. P. K., Verheijen, M. A. W., et al. 2011, ApJ, 739, L47
- Bigiel et al. (2008) Bigiel, F., Leroy, A., Walter, F., et al. 2008, AJ, 136, 2846
- Binggeli & Popescu (1995) Binggeli, B. & Popescu, C. C. 1995, A&A, 298, 63
- Boselli et al. (2002) Boselli, A., Lequeux, J., & Gavazzi, G. 2002, A&A, 384, 33
- Bravo-Alfaro et al. (2004) Bravo-Alfaro, H., Brinks, E., Baker, A. J., Walter, F., & Kunth, D. 2004, AJ, 127, 264
- Briggs (1995) Briggs, D. S. 1995, in Bulletin of the American Astronomical Society, Vol. 27, Bulletin of the American Astronomical Society, 1444–+
- Broeils & Rhee (1997) Broeils, A. H. & Rhee, M.-H. 1997, A&A, 324, 877
- Brook et al. (2011) Brook, C. B., Governato, F., Roškar, R., et al. 2011, MNRAS, 415, 1051
- Cannon et al. (2004) Cannon, J. M., McClure-Griffiths, N. M., Skillman, E. D., & Côté, S. 2004, ApJ, 607, 274
- Cannon et al. (2011) Cannon, J. M., Most, H. P., Skillman, E. D., et al. 2011, ApJ, 735, 36
- Côté et al. (2000) Côté, S., Carignan, C., & Freeman, K. C. 2000, AJ, 120, 3027
- Crone et al. (2002) Crone, M. M., Schulte-Ladbeck, R. E., Greggio, L., & Hopp, U. 2002, ApJ, 567, 258
- Dale et al. (2009) Dale, D. A., Cohen, S. A., Johnson, L. C., et al. 2009, ApJ, 703, 517
- de Boer et al. (2012a) de Boer, T. J. L., Tolstoy, E., Hill, V., et al. 2012a, A&A, 539, A103
- de Boer et al. (2012b) de Boer, T. J. L., Tolstoy, E., Hill, V., et al. 2012b, A&A, 544, A73
- Elmegreen et al. (2009) Elmegreen, D. M., Elmegreen, B. G., Marcus, M. T., et al. 2009, ApJ, 701, 306
- Elson et al. (2010) Elson, E. C., de Blok, W. J. G., & Kraan-Korteweg, R. C. 2010, MNRAS, 404, 2061
- Elson et al. (2011) Elson, E. C., de Blok, W. J. G., & Kraan-Korteweg, R. C. 2011, MNRAS, 415, 323
- Elson et al. (2013) Elson, E. C., de Blok, W. J. G., & Kraan-Korteweg, R. C. 2013, MNRAS, 429, 2550
- Ferrara & Tolstoy (2000) Ferrara, A. & Tolstoy, E. 2000, MNRAS, 313, 291
- Fraternali et al. (2002) Fraternali, F., van Moorsel, G., Sancisi, R., & Oosterloo, T. 2002, AJ, 123, 3124
- Freeman (1970) Freeman, K. C. 1970, ApJ, 160, 811
- Gallagher & Hunter (1987) Gallagher, III, J. S. & Hunter, D. A. 1987, AJ, 94, 43
- Gatto et al. (2013) Gatto, A., Fraternali, F., Read, J. I., et al. 2013, MNRAS, 433, 2749
- Gentile et al. (2005) Gentile, G., Burkert, A., Salucci, P., Klein, U., & Walter, F. 2005, ApJ, 634, L145
- Gil de Paz & Madore (2005) Gil de Paz, A. & Madore, B. F. 2005, ApJS, 156, 345
- Gil de Paz et al. (2003) Gil de Paz, A., Madore, B. F., & Pevunova, O. 2003, ApJS, 147, 29
- Governato et al. (2010) Governato, F., Brook, C., Mayer, L., et al. 2010, Nature, 463, 203
- Governato et al. (2012) Governato, F., Zolotov, A., Pontzen, A., et al. 2012, MNRAS, 422, 1231
- Guseva et al. (2003) Guseva, N. G., Papaderos, P., Izotov, Y. I., et al. 2003, A&A, 407, 105
- Högbom (1974) Högbom, J. A. 1974, A&AS, 15, 417
- Hunter & Elmegreen (2006) Hunter, D. A. & Elmegreen, B. G. 2006, ApJS, 162, 49
- Hunter et al. (2001) Hunter, D. A., Elmegreen, B. G., & van Woerden, H. 2001, ApJ, 556, 773
- Hunter et al. (2012) Hunter, D. A., Ficut-Vicas, D., Ashley, T., et al. 2012, AJ, 144, 134
- Hunter et al. (1999) Hunter, D. A., van Woerden, H., & Gallagher, J. S. 1999, AJ, 118, 2184
- Hunter et al. (1996) Hunter, D. A., van Woerden, H., & Gallagher, III, J. S. 1996, ApJS, 107, 739
- Hunter et al. (1998) Hunter, D. A., Wilcots, E. M., van Woerden, H., Gallagher, J. S., & Kohle, S. 1998, ApJ, 495, L47
- Izotov & Thuan (1999) Izotov, Y. I. & Thuan, T. X. 1999, ApJ, 511, 639
- Johnson et al. (2012) Johnson, M., Hunter, D. A., Oh, S.-H., et al. 2012, AJ, 144, 152
- Kennicutt (1998) Kennicutt, Jr., R. C. 1998, ARA&A, 36, 189
- Kennicutt et al. (2008) Kennicutt, Jr., R. C., Lee, J. C., Funes, José G., S. J., Sakai, S., & Akiyama, S. 2008, ApJS, 178, 247
- Kobulnicky & Skillman (1997) Kobulnicky, H. A. & Skillman, E. D. 1997, ApJ, 489, 636
- Kobulnicky & Skillman (2008) Kobulnicky, H. A. & Skillman, E. D. 2008, AJ, 135, 527
- Koo & McKee (1992) Koo, B.-C. & McKee, C. F. 1992, ApJ, 388, 93
- Kuchinski et al. (2000) Kuchinski, L. E., Freedman, W. L., Madore, B. F., et al. 2000, ApJS, 131, 441
- Lauberts & Valentijn (1989) Lauberts, A. & Valentijn, E. A. 1989, The surface photometry catalogue of the ESO-Uppsala galaxies
- Lee et al. (2009) Lee, J. C., Kennicutt, Jr., R. C., Funes, S. J. J. G., Sakai, S., & Akiyama, S. 2009, ApJ, 692, 1305
- Lelli et al. (2012a) Lelli, F., Verheijen, M., Fraternali, F., & Sancisi, R. 2012a, A&A, 537, A72
- Lelli et al. (2012b) Lelli, F., Verheijen, M., Fraternali, F., & Sancisi, R. 2012b, A&A, 544, A145
- Leroy et al. (2008) Leroy, A. K., Walter, F., Brinks, E., et al. 2008, AJ, 136, 2782
- López-Sánchez et al. (2012) López-Sánchez, Á. R., Koribalski, B. S., van Eymeren, J., et al. 2012, MNRAS, 419, 1051
- Mac Low & Ferrara (1999) Mac Low, M. & Ferrara, A. 1999, ApJ, 513, 142
- Marlowe et al. (1999) Marlowe, A. T., Meurer, G. R., & Heckman, T. M. 1999, ApJ, 522, 183
- Martin (1996) Martin, C. L. 1996, ApJ, 465, 680
- Martin (1998) Martin, C. L. 1998, ApJ, 506, 222
- Martinsson (2011) Martinsson, T. P. K. 2011, PhD thesis, University of Groningen
- Matthews & Uson (2008) Matthews, L. D. & Uson, J. M. 2008, AJ, 135, 291
- Mayer et al. (2006) Mayer, L., Mastropietro, C., Wadsley, J., Stadel, J., & Moore, B. 2006, MNRAS, 369, 1021
- McGaugh (2005) McGaugh, S. S. 2005, ApJ, 632, 859
- McGaugh (2011) McGaugh, S. S. 2011, Physical Review Letters, 106, 121303
- McGaugh (2012) McGaugh, S. S. 2012, AJ, 143, 40
- McGaugh et al. (2000) McGaugh, S. S., Schombert, J. M., Bothun, G. D., & de Blok, W. J. G. 2000, ApJ, 533, L99
- McQuinn et al. (2010a) McQuinn, K. B. W., Skillman, E. D., Cannon, J. M., et al. 2010a, ApJ, 721, 297
- McQuinn et al. (2010b) McQuinn, K. B. W., Skillman, E. D., Cannon, J. M., et al. 2010b, ApJ, 724, 49
- McQuinn et al. (2012) McQuinn, K. B. W., Skillman, E. D., Dalcanton, J. J., et al. 2012, ApJ, 751, 127
- Meurer et al. (1996) Meurer, G. R., Carignan, C., Beaulieu, S. F., & Freeman, K. C. 1996, AJ, 111, 1551
- Meurer et al. (1992) Meurer, G. R., Freeman, K. C., Dopita, M. A., & Cacciari, C. 1992, AJ, 103, 60
- Meurer et al. (2006) Meurer, G. R., Hanish, D. J., Ferguson, H. C., et al. 2006, ApJS, 165, 307
- Meurer et al. (1998) Meurer, G. R., Staveley-Smith, L., & Killeen, N. E. B. 1998, MNRAS, 300, 705
- Oh et al. (2008) Oh, S., de Blok, W. J. G., Walter, F., Brinks, E., & Kennicutt, R. C. 2008, AJ, 136, 2761
- Oh et al. (2011a) Oh, S.-H., Brook, C., Governato, F., et al. 2011a, AJ, 142, 24
- Oh et al. (2011b) Oh, S.-H., de Blok, W. J. G., Brinks, E., Walter, F., & Kennicutt, Jr., R. C. 2011b, AJ, 141, 193
- Okamoto et al. (2010) Okamoto, T., Frenk, C. S., Jenkins, A., & Theuns, T. 2010, MNRAS, 406, 208
- Ott et al. (2005a) Ott, J., Walter, F., & Brinks, E. 2005a, MNRAS, 358, 1423
- Ott et al. (2005b) Ott, J., Walter, F., & Brinks, E. 2005b, MNRAS, 358, 1453
- Papaderos et al. (2002) Papaderos, P., Izotov, Y. I., Thuan, T. X., et al. 2002, A&A, 393, 461
- Papaderos et al. (1996) Papaderos, P., Loose, H., Fricke, K. J., & Thuan, T. X. 1996, A&A, 314, 59
- Ramya et al. (2011) Ramya, S., Kantharia, N. G., & Prabhu, T. P. 2011, ApJ, 728, 124
- Recchi et al. (2004) Recchi, S., Matteucci, F., D’Ercole, A., & Tosi, M. 2004, A&A, 426, 37
- Romano et al. (2006) Romano, D., Tosi, M., & Matteucci, F. 2006, MNRAS, 365, 759
- Roychowdhury et al. (2011) Roychowdhury, S., Chengalur, J. N., Kaisin, S. S., Begum, A., & Karachentsev, I. D. 2011, MNRAS, 414, L55
- Sackett (1997) Sackett, P. D. 1997, ApJ, 483, 103
- Sánchez-Janssen et al. (2010) Sánchez-Janssen, R., Méndez-Abreu, J., & Aguerri, J. A. L. 2010, MNRAS, 406, L65
- Sancisi et al. (2008) Sancisi, R., Fraternali, F., Oosterloo, T., & van der Hulst, T. 2008, A&A Rev., 15, 189
- Sawala et al. (2013) Sawala, T., Frenk, C. S., Crain, R. A., et al. 2013, MNRAS, 431, 1366
- Sawala et al. (2012) Sawala, T., Scannapieco, C., & White, S. 2012, MNRAS, 420, 1714
- Schulte-Ladbeck et al. (2000) Schulte-Ladbeck, R. E., Hopp, U., Greggio, L., & Crone, M. M. 2000, AJ, 120, 1713
- Schulte-Ladbeck et al. (2001) Schulte-Ladbeck, R. E., Hopp, U., Greggio, L., Crone, M. M., & Drozdovsky, I. O. 2001, AJ, 121, 3007
- Schwartz & Martin (2004) Schwartz, C. M. & Martin, C. L. 2004, ApJ, 610, 201
- Simpson & Gottesman (2000) Simpson, C. E. & Gottesman, S. T. 2000, AJ, 120, 2975
- Simpson et al. (2011) Simpson, C. E., Hunter, D. A., Nordgren, T. E., et al. 2011, AJ, 142, 82
- Stil & Israel (2002) Stil, J. M. & Israel, F. P. 2002, A&A, 392, 473
- Stringer et al. (2012) Stringer, M. J., Bower, R. G., Cole, S., Frenk, C. S., & Theuns, T. 2012, MNRAS, 423, 1596
- Swaters & Balcells (2002) Swaters, R. A. & Balcells, M. 2002, A&A, 390, 863
- Swaters et al. (2009) Swaters, R. A., Sancisi, R., van Albada, T. S., & van der Hulst, J. M. 2009, A&A, 493, 871
- Swaters et al. (2011) Swaters, R. A., Sancisi, R., van Albada, T. S., & van der Hulst, J. M. 2011, ApJ, 729, 118
- Swaters et al. (2002) Swaters, R. A., van Albada, T. S., van der Hulst, J. M., & Sancisi, R. 2002, A&A, 390, 829
- Taylor et al. (1995) Taylor, C. L., Brinks, E., Grashuis, R. M., & Skillman, E. D. 1995, ApJS, 99, 427
- Taylor et al. (1994) Taylor, C. L., Brinks, E., Pogge, R. W., & Skillman, E. D. 1994, AJ, 107, 971
- Taylor et al. (1998) Taylor, C. L., Kobulnicky, H. A., & Skillman, E. D. 1998, AJ, 116, 2746
- Taylor et al. (2005) Taylor, V. A., Jansen, R. A., Windhorst, R. A., Odewahn, S. C., & Hibbard, J. E. 2005, ApJ, 630, 784
- Terlevich et al. (1991) Terlevich, R., Melnick, J., Masegosa, J., Moles, M., & Copetti, M. V. F. 1991, A&AS, 91, 285
- Thuan et al. (2004) Thuan, T. X., Hibbard, J. E., & Lévrier, F. 2004, AJ, 128, 617
- Thuan & Izotov (2005) Thuan, T. X. & Izotov, Y. I. 2005, ApJS, 161, 240
- van Albada & Sancisi (1986) van Albada, T. S. & Sancisi, R. 1986, Royal Society of London Philosophical Transactions Series A, 320, 447
- van der Hulst et al. (1992) van der Hulst, J., Terlouw, J., Begeman, K., Zwitser, W., & Roelfsema, P. 1992, in ASP Conf. Ser. 25, ed. D. M. Worall, C. Biemesderfer, & J. Barnes, San Francisco: ASP, 131
- van der Kruit & Searle (1981) van der Kruit, P. C. & Searle, L. 1981, A&A, 95, 105
- van Eymeren et al. (2010) van Eymeren, J., Koribalski, B. S., López-Sánchez, Á. R., Dettmar, R.-J., & Bomans, D. J. 2010, MNRAS, 407, 113
- van Eymeren et al. (2009a) van Eymeren, J., Marcelin, M., Koribalski, B., et al. 2009a, A&A, 493, 511
- van Eymeren et al. (2009b) van Eymeren, J., Marcelin, M., Koribalski, B. S., et al. 2009b, A&A, 505, 105
- van Zee et al. (2001) van Zee, L., Salzer, J. J., & Skillman, E. D. 2001, AJ, 122, 121
- van Zee et al. (1998) van Zee, L., Skillman, E. D., & Salzer, J. J. 1998, AJ, 116, 1186
- Verheijen & Sancisi (2001) Verheijen, M. & Sancisi, R. 2001, A&A, 370, 765
- Verheijen (2001) Verheijen, M. A. W. 2001, ApJ, 563, 694
- Viallefond & Thuan (1983) Viallefond, F. & Thuan, T. X. 1983, ApJ, 269, 444
- Walter et al. (2008) Walter, F., Brinks, E., de Blok, W. J. G., et al. 2008, AJ, 136, 2563
- Walter et al. (1997) Walter, F., Brinks, E., Duric, N., & Klein, U. 1997, AJ, 113, 2031
- Westfall et al. (2011) Westfall, K. B., Bershady, M. A., Verheijen, M. A. W., et al. 2011, ApJ, 742, 18
- Wilcots & Miller (1998) Wilcots, E. M. & Miller, B. W. 1998, AJ, 116, 2363
- Wolf et al. (2010) Wolf, J., Martinez, G. D., Bullock, J. S., et al. 2010, MNRAS, 406, 1220
- Zibetti et al. (2009) Zibetti, S., Charlot, S., & Rix, H.-W. 2009, MNRAS, 400, 1181