Quantum Criticality in Electron-doped BaFe2-xNixAs2
††preprint: APS/123-QEDA quantum critical point (QCP) is a point in a system’s phase diagram at which an order is completely suppressed at absolute zero temperature (). The presence of a quantum critical point manifests itself in the finite- physical properties, and often gives rise to new states of matter. Superconductivity in the cuprates and in heavy fermion materials is believed by many to be mediated by fluctuations associated with a quantum critical point. In the recently-discovered iron-pnictide high temperature superconductors, it is unknown whether a QCP exists or not in a carrier-doped system. Here we report transport and nuclear magnetic resonance (NMR) measurements on BaFe2-xNixAs2 (0 0.17). We find two critical points at = 0.10 and = 0.14. The electrical resistivity follows , with = 1 around and another minimal = 1.1 at . By NMR measurements, we identity to be a magnetic QCP and suggest that is a new type of QCP associated with a nematic structural phase transition. Our results suggest that the superconductivity in carrier-doped pnictides is closely linked to the quantum criticality.
In cuprate high temperature superconductors LSCO and heavy fermion CePd2Si2 compounds, the superconductivity is accompanied by the normal-state properties deviated from a Landau-Fermi liquid. Such deviation has been ascribed to the quantum critical fluctuations associated with a QCP Gegenwart_np ; Coleman_nat , whose relationship to the occurrence of superconductivity has been one of the central issues in condensed-matter physics in the last decades. In iron-pnictide high temperature superconductors Hosono ; 122-1 , searching for magnetic fluctuations has also become an important subject Oka .
Quantum critical fluctuations of order parameters take place not only in spatial domain, but also in imaginary time domain Hertz ; Chacravarty . The correlation time and correlation length are scaled to each other, through a dynamical exponent , . Several physical quantities, such as the electrical resistivity and spin-lattice relaxation rate (1/), can be used to probe the quantum critical phenomena. For the quasiparticles scattering dominated by the quantum critical fluctuations, the resistivity scales as . For a two-dimensional (2D) antiferromagnetic spin-density-wave (SDW) QCP, the exponent = 1 is often observed LSCO ; CePd2Si2 ; Kasahara0 . On the other hand, for a 2D order with = (0,0) where = 3, = at the QCP Moriya_SCR ; Xu . Around a QCP, 1/ also shows a characteristic -scaling Moriya_SCR .
BaFe2-xNixAs2 is an electron-doped system XuZA where every Ni donates two electrons in contrast to Co doping that contributes only one electron Safet . Therefore, Ni doping suffers less from disorder which is usually harmful for a QCP to exist. In this work, we find two critical points at = 0.10 and = 0.14, respectively. By NMR measurements, we identify to be a magnetic QCP and suggest that is a QCP associated with the Tetragonal-to-Orthorhombic structural phase transition. The highest is found around , which suggests that the superconductivity in the carrier-doped BaFe2As2 is more closely tied to the magnetic QCP, while the unusual quantum criticality associated with the structural transition deserves further investigation.
Results
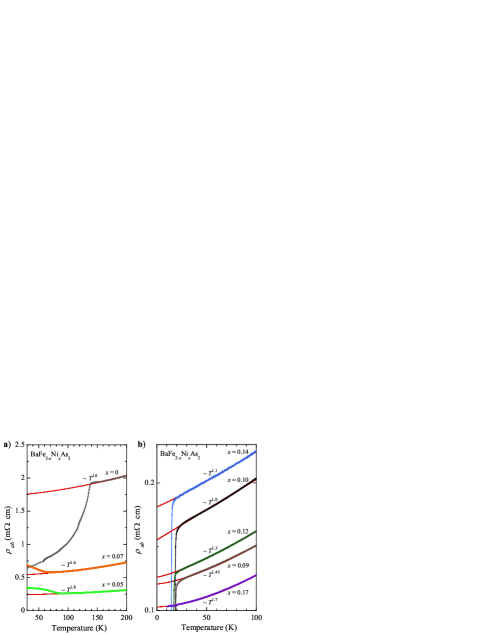
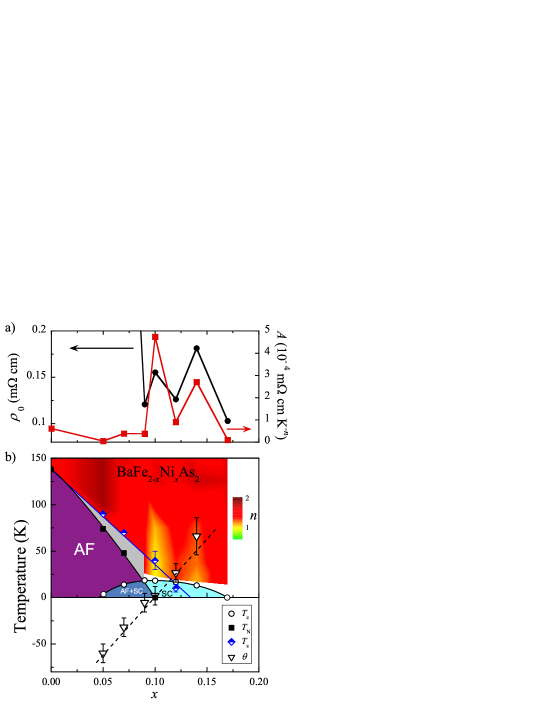
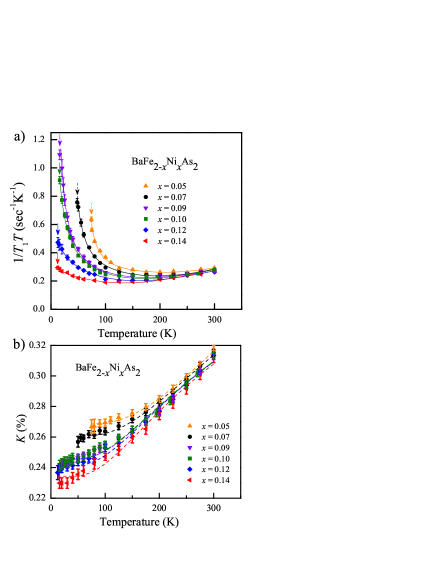
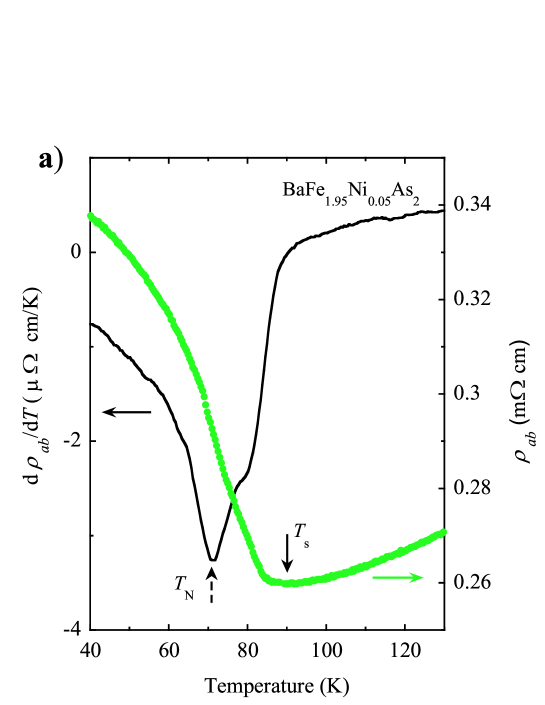
Electrical Resistivity measurements. Figure 1 shows the in-plane electrical resistivity data in BaFe2-xNixAs2 for various , which are fitted by the equation (for data over the whole temperature range, see Supplementary Figure S1 and Supplementary Note). For a conventional metal described by the Fermi liquid theory, the exponent = 2 is expected. However, we find 1.5 for . This is a notable feature of non-Fermi liquid behavior. Most remarkably, a -linear behavior ( = 1) is observed for = 0.10 and persists up to = 100 K. Another minimal = 1.1 is found for = 0.14, which is in good agreement with a previous transport measurement mu_B_NC . An equally interesting feature is that both the residual resistivity and the coefficient show a maximum at and as seen in Fig. 2 (a). The evolution of the exponent with Ni content is shown in Fig. 2 (b).
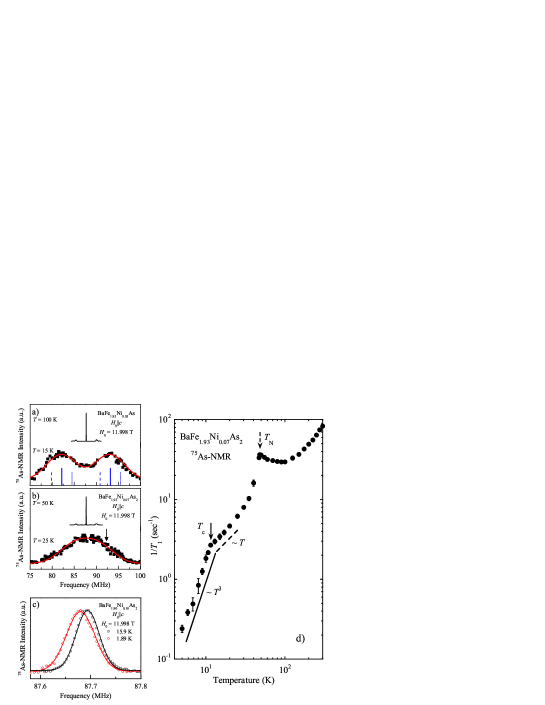
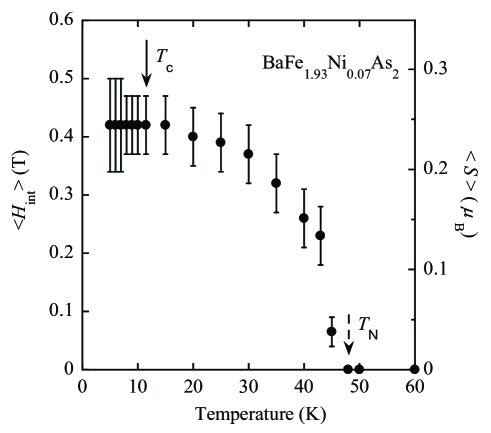
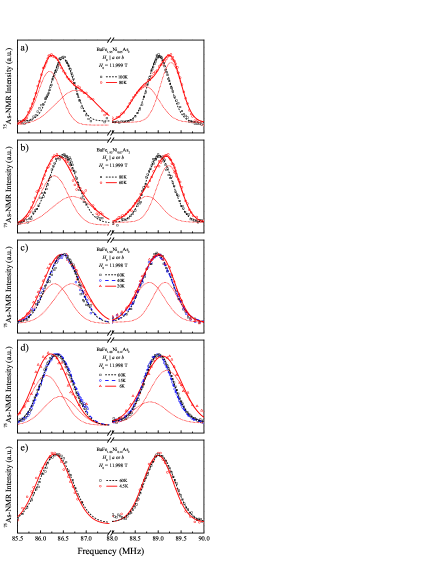
Nuclear magnetic resonance measurements. We use NMR to investigate the nature of and . We identify to be a SDW QCP and suggest that is a Tetragonal-to-Orthorhombic structural phase transition QCP. Figure 3 (a) and (b) display the frequency-swept spectra of 75As NMR for = 0.05 and 0.07, respectively. The very narrow central transition peak above the antiferromagnetic transition temperature testifies a good quality of the samples. When a magnetic order sets in, the spectra will split into two pairs as labeled in Fig. 3 (a), due to the development of an internal magnetic field . For = 0.05, we observed two split broad peaks below = 74 K. This is due to a distribution of , which results in a broadening of each pair of the peaks. Upon further doping, is reduced and its distribution becomes larger, so that only one broad peak can be seen below = 48 K for = 0.07. Similar broadening of the spectra was also observed previously in a very lightly-doped sample BaFe1.934Ni0.066As2 Ni-NMR . For both , the spectra can be reproduced by assuming a Gaussian distribution of as shown by the red curves. We obtain the averaged internal field = 0.75 T at =15 K for = 0.05, and = 0.39 T at = 25 K for = 0.07. By using a hyperfine coupling constant of 1.88 T/ obtained in the undoped parent compound Kitagawa_BaFe2As2 , the averaged ordered magnetic moment is deduced. As seen in Fig. 4, the ordered magnetic moment develops continuously below , being consistent with the second-order nature of the phase transition. It saturates to 0.43 for = 0.05, and 0.24 for = 0.07, respectively. The ordered moment is smaller than that in the hole-doped Ba1-xKxFe2As2 Li-AF+SC , which is probably due to the fact that Ni goes directly into the Fe site and is more effective in suppressing the magnetic order. Upon further doping, at = 0.09 and = 0.10, however, no antiferromagnetic transition was found, as demonstrated in Fig. 3 (c) which shows no splitting or broadening ascribable to a magnetic ordering.
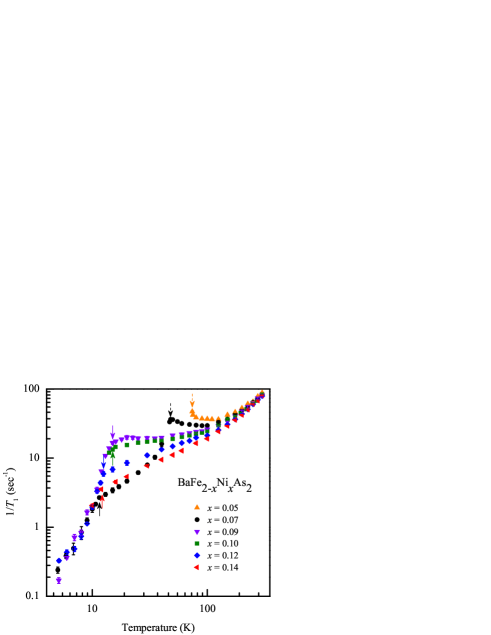
The onset of the magnetic order in the underdoped regime is also clearly seen in the spin-lattice relaxation. Figure 3 (d) shows for = 0.07, which was measured at the position indicated by the arrow in Fig. 3 (b), in order to avoid any influence from possible remnant paramagnetic phase, if any. As seen in Fig. 3 (d), a clear peak is found at = 48 K due to a critical slowing down of the magnetic moments. Below , decreases down to . Most remarkably, shows a further rapid decrease below , exhibiting a behavior down to = 5 K. Such a significant decrease of just below is due to the superconducting gap opening in the antiferromagnetically ordered state. This is clear and direct evidence for a microscopic coexistence of superconductivity and antiferromagnetism, since the nuclei being measured experience an internal magnetic field yet the relaxation rate is suppressed rapidly below . For = 0.10, as mentioned already, no antiferromagnetic transition was found. Namely = 0. This is consistent with the extrapolation of the vs relation that gives a critical point that coincides with = 0.10, which is further supported by the spin dynamics as elaborated below.
Figure 5 (a) shows the quantity for . The decreases with increasing down to around 150 K, but starts to increase towards or . The increase at low is due to the antiferromagnetic spin fluctuation () , and the decrease at high is due to an intraband effect (). Namely, . A similar behavior was also seen in Ba(Fe1-xCox)2As2 Co-NMR-prl_Ning . We analyze the ()AF part by the self-consistent renormalization (SCR) theory for a 2D itinerant electron system near a QCP Moriya_SCR , which predicts that is proportional to the staggered magnetic susceptibility . Since follows a Curie-Weiss law Moriya_SCR , one has . The intraband contribution is due to the density of state (DOS) at the Fermi level, which is related to the spin Knight shift () through the Korringa relation = constant Korringa . The Knight shift was found to follow a -dependence of as seen in Fig. 5 (b), where is -independent, while the second is due to the band that sinks below the Fermi level Ikeda ; Tabuchi . Correspondingly, we can write . The resulting is plotted in Fig. 2 (b). Note that is almost zero at = 0.10, which yields a constant above as seen in Fig. 6. The result of = 0 means that the staggered magnetic susceptibility diverges at =0, indicating that = 0.10 is a magnetic QCP. Therefore, the exponent =1 in the resistivity is due to the magnetic QCP(Generally speaking, scatterings due to the magnetic hot spots give a -linear resistivity Moriya_SCR , but those by other parts of the Fermi surface will not Rice ; Fujimoto . In real materials, however, there always exist some extent of impurity scatterings that can connect the magnetic hot spots and other parts of the Fermi surface as to restore the =1 behavior at a magnetic QCP).
Next, we use 75As NMR to study the structural phase transition. A Tetragonal-to-Orthorhombic structural transition was found in the parent compound Huang , but no direct evidence for such structural transition was obtained in the doped BaFe2-xNixAs2 thus far. In BaFe2-xCoxAs2, a structural transition was detected in the low-doping region Pratt , but it is unclear how the transition temperature would evolve as doping level increases. The 75As nucleus has a nuclear quadrupole moment that couples to the electric field-gradient (EFG) (). Therefore, the 75As NMR spectrum is sensitive to a structural phase transition, since below the EFG will change appreciably. Such change was indeed confirmed in the parent compounds BaFe2As2 Kitagawa_BaFe2As2 and LaFeAsO Imai . When a magnetic field is applied in the plane, the NMR resonance frequency is expressed by
| (1) |
where = 3/2, 1/2 and -1/2, is the angle between and the -axis, is the nuclear quadrupole resonance frequency which is proportional to the EFG, and . For a tetragonal crystal structure, . For an orthorhombic structure, however, the -axis and -axis are not identical, which results in an asymmetric EFG so that . Therefore, for a twined single crystal, the field configurations of -axis ( = ) and -axis ( = ) will give a different , leading to a splitting of a pair of the satellite peaks into two. The above argument also applies to the case of electronic nematic phase transition such as orbital ordering, since the EFG is also sensitive to a change in the occupation of the on-site electronic orbits.
As shown in Fig. 7 (a) and (b), only one pair of satellite peaks is observed at high temperature for both = 0.05 and 0.07. Below certain temperature, , however, we observed a splitting of the satellite peaks. This is strong microscopic evidence for a structural transition occurring in the underdoped samples, where the NMR spectra split owing to the formation of the twinned orthorhombic domains. In fact, each satellite peak can be well reproduced by assuming two split peaks. The obtained = 90 K for = 0.05 and = 70 K for = 0.07 agrees well with the resistivity data where an upturn at is observed, see Fig. 8. This feature in the spectra persists to the higher dopings = 0.10 and 0.12. For the optimal doping = 0.10, the spectrum is nearly unchanged for 40 K 60 K, but suddenly changes at 20 K. This indicates that a structural transition takes place below 40 K for this doping composition. For = 0.12, the two satellite peaks do not change at high temperatures, but shift to the opposite direction below = 10 K. Each broadened peak at = 6 K can be well fitted by a superposition of two peaks. This is the first observation that a structural phase transition takes place below . For = 0.14, however, no broadening of the spectra was found down to = 4.5 K; the spectrum shift to the same direction is due to a reduction of the Knight shift in the superconducting state. This indicates that = 0 around = 0.14. The results obtained by NMR are summarized in the phase diagram as shown in Fig. 2 (b).
Therefore, the minimal =1.1 of the resistivity exponent around implies quantum critical fluctuations associated with the structural QCP. We hope that our work will stimulate more experimental measurements such as elastic constant which is also sensitive to such critical fluctuations Yoshizawa . It should be emphasized here that the exponent = 1.1 is smaller than = expected for the fluctuations dominated by = (0,0) Xu . Our result suggests that the fluctuation associated with is local (namely, all wave vectors contribute to the quasiparticles scattering), which would lead to an = 1 Miyake .
Discussion
The mechanism for the superconductivity in iron-pnictides has been discussed in relation to magnetic fluctuations Mazin ; Kuroki ; Scalapino as well as structural/orbital fluctuations Kontani . In this context, it is worthwhile noting that is the highest around . This suggests that the superconductivity in BaFe2-xNixAs2 is more closely related to the antiferromagnetic QCP rather than the structural QCP. Also, previous results suggestive of a magnetic QCP was reported for BaFe2(As1-xPx)2P_PRL_Ishida ; Kasahara , but isovalent P substitution for As does not add carriers there. In the present case, Ni directly donates electrons into the system (chemical doping), so the tuning parameter is totally different here. Thus, our work demonstrates that BaFe2-xNixAs2 is a new material that provides a unique opportunity to study the issues of quantum criticality. In particular, our result suggests that is a new type of QCP at which the exponent cannot be explained by existing theories. Although the importance of the Tetragonal-to-Orthorhombic structural transition, which is often associated with electronic nematicity Chu ; Shen , has been pointed out in the pnictides Fernandes ; Kontani ; Ono , the physics of a QCP associated with it is a much less-explored frontier, which deserves more investigations in the future.
Methods
Sample preparation and characterization: The single crystal samples of BaFe2-xNixAs2 used for the measurements were grown by the self-flux method crystal grow . Here, the Ni content was determined by energy-dispersive x-ray spectroscopy (EDX). The was determined by DC susceptibility measured by a superconducting quantum interference device with the applied field 50 Oe parallel to the plane. The is 3.5, 14, 18.5, 18.2, 16.8 and 13.1 K for = 0.05, 0.07, 0.09, 0.10, 0.12 and 0.14, respectively.
The resistivity measurements: Resistivity measurements were performed in Quantum Design physical properties measurement system (PPMS) by a standard dc four-probe method. Here we have used the same single crystals used in the NMR measurements. The electrical resistance is measured upon both warming and cooling processes in order to ensure no temperature effect from the electrodes on the samples. Both the warming and the cooling speed is 2 K/min.
Measurements of NMR spectra and : The NMR spectra were obtained by integrating the spin echo as a function of the RF frequency at a constant external magnetic field = 11.998 T. The nucleus 75As has a nuclear spin = 3/2 and the nuclear spin Hamiltonian can be expressed as
| (2) | ||||
where is the gyromagnetic ratio of 75As, is Planck constant, is the internal magnetic field at the As nuclear spin site resulting from the hyperfine coupling to the neighboring Fe electrons. The was determined by using the saturation-recovery method, and the nuclear magnetization is fitted to , where is the nuclear magnetization at time after the saturation pulse method_T1 . The curve is fitted very well and is of single component.
Simulation of the spectra: In order to reproduce the spectra, we assume that the distribution of the internal magnetic field is Gaussian as,
| (3) |
where is the intensity of the spectra, is the distribution of the internal magnetic field , and is the nuclear quadrupole resonance (NQR) frequency tensor along the -axis. Then the spectrum is fitted by convoluting Eq. 3 with a Gaussian broadening function that already exists above . For = 0 (central transition), = 1 and is the full width at half maximum (FWHM) of the central peak above . For = (satellites), and is the FWHM of satellite lines above . The red solid curve in Fig. 3 (a) is a fit with = 0.37 T, = 0.03 MHz, and = 0.38 MHz which was taken from the spectrum at = 100 K. The red solid curve in Fig. 3 (b) is a fit with = 0.04 MHz and = 0.5 MHz which was taken from the spectrum at = 50 K.
References
- (1) Cooper, R. A. et al. Anomalous criticality in the electrical resistivity of La2-xSrxCuO4. Science 323, 603-607 (2009).
- (2) Mathur, N. D. et al. Magnetically mediated superconductivity in heavy fermion compounds. Nature 394, 39-43 (1998).
- (3) Gegenwart, P., Si, Q. Steglich, F.. Quantum criticality in heavy-fermion metals. Nature Phys. 4, 186-197 (2008).
- (4) Coleman, P. Schofield, A. J.. Quantum criticality. Nature 433, 226-229 (2005).
- (5) Kamihara, Y., Watanabe, T., Hirano, M. Hosono, H.. Iron-based layered superconductor La[O1-xFx]FeAs ( = 0.05-0.12) with = 26 K. J. Am. Chem. Soc. 103, 3296-3297 (2008).
- (6) Rotter, M., Tegel, M. Johrendt, D.. Superconductivity at 38 K in the iron arsenide (Ba1-xKx)Fe2As2. Phys. Rev. Lett. 101, 107006 (2008).
- (7) Oka, T. et al. Antiferromagnetic Spin Fluctuations above the Dome-Shaped and Full-Gap Superconducting States of LaFeAsO1-xFx Revealed by 75As-Nuclear Quadrupole Resonance. Phys. Rev. Lett. 108, 047001 (2012).
- (8) Hertz, J. A.. Quantum critical phenomena. Phys. Rev. B 14, 1165-1184 (1976).
- (9) Chakravarty, S., Halperin, B. I. Nelson, D. R.. Two-dimensional quantum Heisenberg antiferromagnet at low temperatures. Phys. Rev. B 39, 2344-2371 (1989).
- (10) Kasahara, S. et al. Evolution from non-Fermi- to Fermi-liquid transport via isovalent doping in BaFe2(As1-xPx)2 superconductors. Phys. Rev. B 81, 184519 (2010).
- (11) Moriya, T.. Theory of itinerant electron magnetism. J. Mag. Mag. Mat. 100, 261-271 (1991).
- (12) Xu, C., Muller, M. Sachdev, S.. Ising and spin orders in the iron-based superconductors. Phys. Rev. B 78, 020501 (2008).
- (13) Li, L. J. et al. Superconductivity induced by Ni doping in BaFe2As2 single crystals. New J. Phys. 11, 025008 (2009).
- (14) Sefat, A. S. et al. Superconductivity at 22 K in Co-Doped BaFe2As2 Crystals. Phys. Rev. Lett. 101, 117004 (2008).
- (15) Luo, H. Q. et al. Coexistence and competition of the short-range incommensurate antiferromagnetic order with the superconducting state of BaFe2-xNixAs2. Phys. Rev. Lett. 108, 247002 (2012).
- (16) Dioguardi, A. P. et al.Local magnetic inhomogeneities in Ba(Fe1-xNix)2As2 as seen via 75As NMR. Phys. Rev. B 82, 140411 (2010).
- (17) Kitagawa, K., Katayama, N., Ohgushi, K., Yoshida, M. Takigawa, M.. Commensurate itinerant antiferromagnetism in BaFe2As2: 75As-NMR studies on a self-flux grown single crystal. J. Phys. Soc. Jpn. 77, 114709 (2008).
- (18) Li, Z. et al. Microscopic coexistence of antiferromagnetic order and superconductivity in Ba0.77K0.23Fe2As2. Phys. Rev. B 86, 180501 (2012).
- (19) Ning, F. L. et al. Contrasting spin dynamics between underdoped and overdoped Ba(Fe1-xCox)2As2. Phys. Rev. Lett. 104, 037001 (2010).
- (20) Korringa, J.. Nuclear magnetic relaxation and resonnance line shift in metals. Physica 16 (7-8), 601-610 (1950).
- (21) Ikeda, H.. Pseudogap and superconductivity in iron-based layered superconductor studied by fluctuation-exchange approximation. J. Phys. Soc. Jpn. 77, 123707 (2008) .
- (22) Tabuchi, T. et al. Evidence for a full energy gap in the nickel pnictide supercon-ductor LaNiAsO1-xFx from 75As nuclear quadrupole resonance. Phys. Rev. B 81, 140509 (2010).
- (23) Hlubina, R. Rice, T. M.. Resistivity as a function of temperature for models with hot spots on the Fermi surface. Phys. Rev. B 51, 9253-9261 (1995).
- (24) Fujimoto, S., Kohno, H. Yamada, K.. Temperature dependence of electrical resistivity in two-dimension Fermi systems. J. Phys. Soc. Jpn. 60, 2724-2728 (1991).
- (25) Huang, Q. et al. Neutron-Diffraction Measurements of Magnetic Order and a Structural Transition in the Parent BaFe2As2 Compound of FeAs-Based High-Temperature Superconductors. Phys. Rev. Lett. 101, 257003 (2008).
- (26) Pratt, D. K. et al. Coexistence of competing antiferromagnetic and superconducting phases in the underdoped Ba(Fe0.953Co0.047)2As2 compound using X-ray and neutron scattering techniques. Phys. Rev. Lett. 103, 087001 (2009).
- (27) Fu, M. et al. NMR Search for the Spin Nematic State in LaFeAsO Single Crystal. Phys. Rev. Lett. 109, 247001 (2012).
- (28) Yoshizawa, H. et al., Structural Quantum Criticality and Superconductivity in Iron-Based Superconductor Ba(Fe1-xCox)2As2. J. Phys. Soc. Jpn. 81, 024604 (2012).
- (29) Watanabe, S. Miyake, K.. Quantum valence criticality as an origin of unconventional critical phenomena. Phys. Rev. Lett. 105, 186403 (2010).
- (30) Mazin, I. I., Singh, D. J., Johannes, M. D. Du, M. H.. Unconventional sign-reversing superconductivity in LaFeAsO1-xFx. Phys. Rev. Lett. 101, 057003 (2008).
- (31) Kuroki, K. et al. Unconventional pairing originating from the disconnected Fermi surfaces of superconducting LaFeAsO1-xFx. Phys. Rev. Lett. 101, 087004 (2008).
- (32) Graser, S. et al. Spin fluctuations and superconductivity in a three-dimensional tight-binding model for BaFe2As2. Phys. Rev. B 81, 214503 (2010).
- (33) Kontani, H. Onari, S.. Orbital-Fluctuation-Mediated Superconductivity in Iron Pnictides: Analysis of the Five-Orbital Hubbard-Holstein Model. Phys. Rev. Lett. 104, 157001 (2010).
- (34) Nakai, Y. et al. Unconventional superconductivity and antiferromagnetic quantum critical behavior in the isovalent-doped BaFe2(As1-xPx)2. Phys. Rev. Lett. 105, 107003 (2010).
- (35) Hashimoto, K. et al. A Sharp Peak of the Zero-Temperature Penetration Depth at Optimal Composition in BaFe2(As1-xPx)2. Science 336, 1554-1557 (2012).
- (36) Chu, J.-H. et al. In-Plane Resistivity Anisotropy in an Underdoped Iron Arsenide Superconductor. Science 329, 824-826 (2010).
- (37) Yi, M. et al. Symmetry breaking orbital anisotropy on detwinned Ba(Fe1-xCox)2As2 above the spin density wave transition. Proc. Nat. Acad. Sci. 108, 6878-6883 (2011).
- (38) Fernandes, R. M., Chubukov, A. V., Knolle, J., Eremin, I. Schmalian, J.. Preemptive nematic order, pseudogap, and orbital order in the iron pnictides. Phys. Rev. B 85, 024534 (2012).
- (39) Yanagi, Y., Yamakawa, Y., Adachi, N. Ono, Y.. Cooperative effects of Coulomb and electron-phonon interactions in the two-dimensional 16-band - model for iron-based superconductors. Phys. Rev. B 82, 064518 (2010).
- (40) Sun, D. L., Liu, Y., Park, J. T. Lin, C. T.. Growth of large single crystals of BaFe1.87Co0.13As2 using a nucleation pole. Supercond. Sci. Technol. 22, 105006 (2009).
- (41) Narath, A.. Nuclear Spin-Lattice Relaxation in Hexagonal Transition Metals: Titanium. Phys. Rev. 162, 320-332 (1967).
Acknowledgments We thank Q. Si, K. Miyake, K. Kuroki, T. Takimoto, Y. Yanase, R. Fernandes, T. Xiang and S. Fujimoto for helpful discussion. This work was partially supported by National Basic Research Program of China (973 Program), Nos. 2011CBA00100 2011CBA00109, and by CAS.
Author contributions The single crystals were grown by D.L.S and C.T.L. The NMR measurements were performed by R.Z., Z.L., J.Y and G.Q.Z. The electrical resistivity was measured by R.Z., Z.L., and J.Y. G.Q.Z coordinated the whole work and wrote the manuscript, which was supplemented by R.Z. All authors have discussed the results and the interpretation.
Additional information Supplementary information is available in the online version of the paper. Correspondence and requests for materials should be addressed to G.Q.Z.
Competing financial interests The authors declare no competing financial interests.
Supplementary Figure
![[Uncaptioned image]](/html/1308.3539/assets/x9.png)
Supplementary Figure S1: The electrical resistivity in the whole temperature region. The in-plane electrical resistivity /(300 K) for the whole temperature region of BaFe2-xNixAs2 at zero field. Except for the sample = 0.17, data were offset vertically by a number shown in the figure. The arrows indicate the structural phase transition temperature of = 0.05 and 0.07.
Supplementary Note: Electrical resistivity
Supplementary Figure S1 shows the in-plane electrical resistivity up to = 300 K. In our studies, we find that the -linear dependence of the resistivity can only be observed at = 0.10. Therefore, even for a nominal sample with = 0.10, if a sample is inhomogeneous, the electrical resistivity will be easily influenced by other compositions and will not show a -linear behavior. This is probably the reason why the -linear behavior of electrical resistivity has never been observed before for the BaFe2-xNixAs2 systemmu_B_NC .
The residual resistivity is larger than that in Ba1-xKxFe2As2 or BaFe2(As1-xPx)2. For example, = 15.5 cm in Ba0.68K0.32Fe2As2[42], and = 33 cm in BaFe2(As0.67P0.33)2Kasahara0 . In comparison, in the Ni-doped samples is larger by more than three times. This is a result that Ni goes directly into the Fe site, which has a stronger disorder effect compared to Ba-site or As-site substitutions. However, since the term is quite large, it has little effect on the fitting to obtain the exponent .
Supplementary References
[42] Gasparova, V. A., Wolff-Fabrisb, F., Sun, D. L., Lin, C. T. Wosnitzab, J.. Electron Transport and
Anisotropy of the Upper Critical Magnetic Field in Ba0.68K0.32Fe2As2 Single Crystals. JETP Letters
93, 26-30 (2011).