VHE Emission from PSR B1259-63/LS 2883 around 2010/2011 Periastron Passage observed with H.E.S.S.
Abstract
PSR B1259-63/LS 2883 is a binary system consisting of a 48 ms pulsar orbitting around a Be star with an orbital period of years. The system was detected at very high energies (VHE; GeV) by the High Energy Stereoscopic System (H.E.S.S.) during its periastron passages in 2004 and 2007. Here we present new H.E.S.S. observations corresponding to its last periastron passage, which occurred on December 15th 2010. These new observations partially overlap with the beginning of a spectacular gamma-ray flare reported by the Fermi-LAT. The H.E.S.S. observations show both flux and spectral properties similar to those reported in previous periastron passages, without any signature of the emission enhancement seen at GeV energies. A careful statistical study based on the Fermi and H.E.S.S. lightcurves leads to the conclusion that the GeV and TeV emission during the flare have a different physical origin. This conlusion, in turn, allows to use Fermi-LAT measurements of the GeV flux as upper limits for the modeling of the VHE emission.
I Introduction
The class of very high energy (VHE; GeV) -ray binaries comprises only a handful of known objects in our Galaxy: LS 5039 (Aharonian et al., 2005a), LS I +61 303 (Albert et al., 2006), PSR B1259-63/LS 2883 (Aharonian et al., 2005b) and HESS J0632+057 (Aharonian et al., 2007), the first binary primarily discovered at TeV energies. Only for the source presented in this paper, PSR B1259-63/LS 2883, the compact companion is clearly identified as a pulsar, making it a unique object for the study of the interaction between pulsar and stellar winds and the emission mechanisms in such systems.
It consists of a rapidly rotating pulsar with a spin period of ms and a spin-down luminosity of erg/s in a highly eccentric () orbit around a massive Be star (Johnston et al., 1992a, b). The pulsar moves around the companion with a period years (1237 days). The luminosity of the companion star LS 2883 is erg s-1 (Negueruela et al., 2011). Because of its fast rotation, the star is oblate with an equatorial radius of and a polar radius of . This leads to a strong gradient of the surface temperature from at the equator to at the poles. The optical observations also suggest that the system is located at the same distance as the star association Cen OB1 at kpc (Negueruela et al., 2011). The companion Be star features an equatorial disk that is believed to be inclined with respect to the pulsar’s orbital plane (Johnston et al., 1992a; Melatos et al., 1995; Negueruela et al., 2011) in a way that the pulsar crosses the disk twice in each orbit just before ( days) and just after ( days) the periastron.
Since its discovery in 1992, PSR B1259-63/LS 2883 is constantly monitored by various instruments at all energy bands. The properties of the radio emission differ depending on the distance between the pulsar and the star. Radio observations (Johnston et al., 1999; Connors et al., 2002; Johnston et al., 2005) show that when the pulsar is far from the periastron, the observed radio emission consists only of the pulsed component, whose intensity is almost independent of the orbital position. But closer to the periastron, starting at about d, where is the time of periastron, the intensity starts to decrease up to the complete disappearance approximately at d. This is followed by an eclipse of the pulsed emission for about 35-40 days when the pulsar is behind the disk. In contrast, a transient unpulsed component appears and sharply rises to a level more than ten times higher than the flux density of the pulsed emission far from the periastron. After the disk crossing the unpulsed emission shows a slight decrease with another increase around d at the second crossing of the disk.
PSR B1259-63/LS 2883 is very well covered by X-ray observations carried out with various instruments such as ROSAT (Cominsky et al., 1994), ASCA (Kaspi et al., 1995; Hirayama et al., 1999), INTEGRAL (Shaw et al., 2004), Suzaku, Swift, Chandra (Chernyakova et al., 2009), and XMM-Newton (Chernyakova et al., 2006, 2009). X-ray observations did not show any X-ray pulsed emission from the pulsar. Unpulsed non-thermal radiation from the source varies with orbital phase in both flux and spectral index. Similarly to radio measurements, the enhancement of the flux occurs shortly before and shortly after the periastron. Unambiguously, the enhancement of the non-thermal emission results from the interactions of the pulsar wind with the circumstellar disk close to the periastron passage.
PSR B1259-63/LS 2883 was observed by H.E.S.S. around the periastron passages in 2004 (Aharonian et al., 2005b) and 2007 (Aharonian et al., 2009), leading to a firm detection on both occasions. In 2004, PSR B1259-63/LS 2883 was observed mostly after the periastron, in 2007 mostly before it. Therefore, the repetitive behaviour of the source, i.e. the recurrent appearance of the source near periastron at the same orbital phase, with the same flux level and spectral shape of the emission, was not precisely confirmed, since the observations covered different orbital phases. However, the similar dependence of the flux on the separation distance between the pulsar and the star for both periastron passages provides a strong indication for the repetitive behaviour (Kerschhaggl, 2011). PSR B1259-63/LS 2883 was not detected in observations performed far from periastron in 2005 and 2006, which comprised h and h of exposure, respectively.
Observations around the 2004 and 2007 periastron passages showed a variable behaviour of the source flux with time. A combined light curve of those two periastron passages indicates two asymmetrical peaks around periastron with a significant decrease of the flux at the periastron itself. Peaks of the TeV emission roughly coincide with the flux enhancement observed in other wavebands as well as with the eclipse of the pulsed radio emission, which indicates the position of the circumstellar disk. This coincidence suggests that the TeV emission from PSR B1259-63/LS 2883 may be connected to the interaction of the pulsar with the disk.
II Multiwavelength Observations around the 2010 Periastron Passage
H.E.S.S. observations around the most recent periastron passage which took place on 15th of December 2010 were performed as part of an extended multiwavelength (MWL) campaign including also radio, optical, X-ray and high energy (HE; MeV) observations. A joint MWL paper is in preparation.
The first results of the radio and X-ray monitoring of the source can be found in Abdo et al. (2011). The pulsed radio emission was monitored with Parkes telescope revealing an eclipse of the pulsed signal lasting from d to 15 d. Radio emission from PSR B1259-63 at frequencies between 1.1 and 10 GHz was observed using the ATCA array in the period from d to d. The detected unpulsed emission around the periastron passage showed a behaviour similar to the one observed during previous observations. The X-ray energy band was covered by three instruments: Swift, Suzaku and XMM-Newton. Observations confirmed the 1-10 keV lightcurve shape obtained in previous periastron observations, showing a rapid X-ray brightening starting at about d with a subsequent decrease closer to periastron and a second increase of the X-ray flux after periastron (Abdo et al., 2011).
Observations of the binary system PSR B1259-63/LS 2883 at HEs were performed using the Large Area Telescope (LAT) on board of Fermi. The data taken around the periastron passage were analysed by two independent working groups (Abdo et al., 2011; Tam et al., 2011), yielding similar results for the flaring period (see below), although there are some discrepancies related to the first detection period close to the periastron passage. Those differences do not affect however the conclusions drawn in this paper. The source was detected close to periastron with a very low photon flux above 100 MeV of about cm-2 s-1. After the initial detection, the flux decreased and the source was below the detection threshold until 14th of January, d, when a spectacular flare was detected which lasted for about 7 weeks with an average flux times higher than the flux detected close to the periastron (Abdo et al., 2011). The highest day-averaged flux during the flare almost reached the estimate of the spin-down luminosity of the pulsar. The HE emission around the periastron as a function of time significantly differs from the two-peak lightcurves observed in other wavebands. The flare is not coincident with the post-periastron peak in radio, X-rays, and VHE -rays. It is also much brighter in comparison to the first detection of GeV emission close to the periastron passage (Abdo et al., 2011; Tam et al., 2011).
III H.E.S.S. Observations around 2010/2011 Periastron Passage
III.1 H.E.S.S. Observations Results
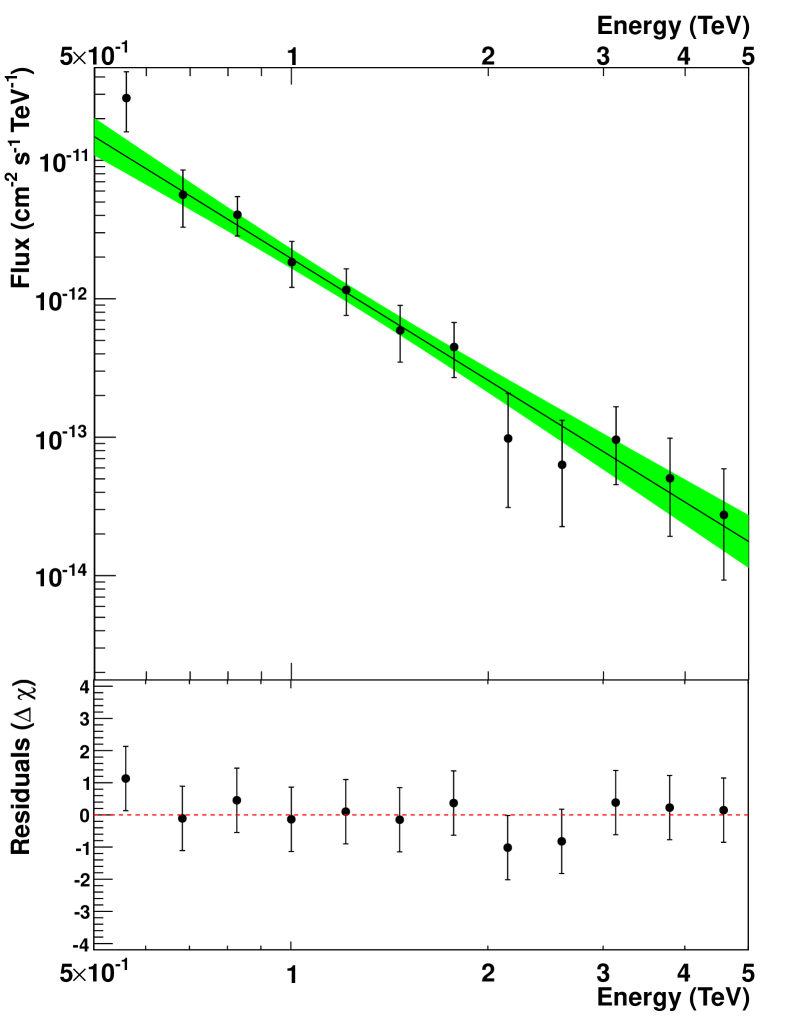
PSR B1259-63/LS 2883 observations were taken in five nights, namely January 9/10, 10/11, 13/14, 14/15 and 15/16, resulting in 6.2 h of data (H.E.S.S. Collaboration et al., 2013). The source was detected at an 11.5 level. A spectral analysis of the detected excess events shows that the differential energy spectrum of photons is consistent with a simple power law with a flux normalisation at 1 TeV of and a spectral index (see Fig. 1) with a fit probability of 0.64. The integral flux above 1 TeV averaged over the whole observation period is cm-2 s-1 (H.E.S.S. Collaboration et al., 2013).
[b]
| Dataset | Livetime [h] | Significance [] | [] | Flux( TeV) | |
|---|---|---|---|---|---|
| [ cm-2 s-1] | |||||
| Pre-flare | 2.65 | 7.4 | |||
| Flare | 3.59 | 8.5 |
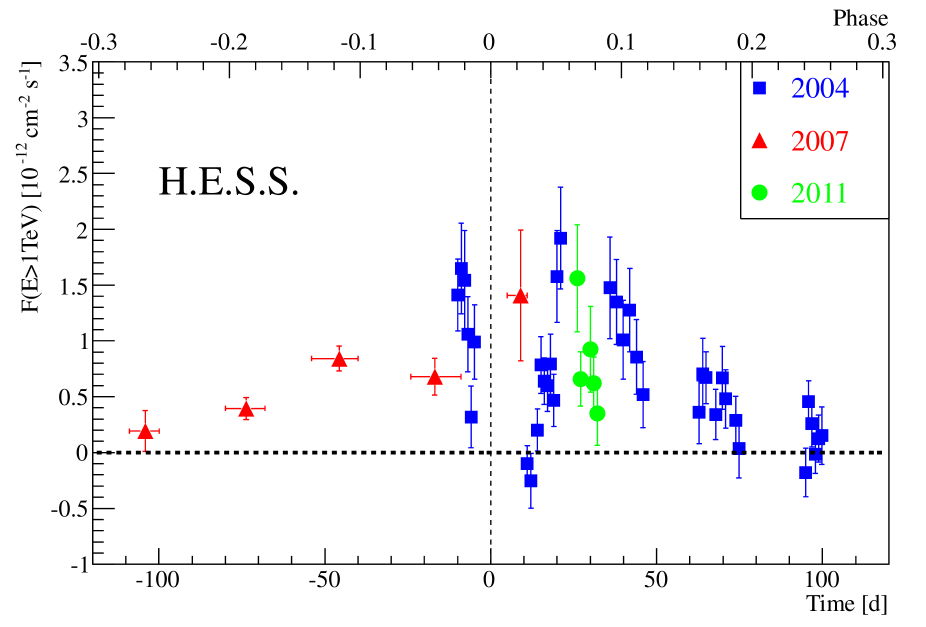
In Fig. 2, the integrated photon flux above 1 TeV as a function of time with respect to periastron (indicated by the dashed vertical line) is shown. The light curve compiles the data from all three periastron observation campaigns spanning from 100 days before to 100 days after the periastron. The observed flux from the 2010/2011 observation campaign (in green on Fig. 2) is compatible with the flux detected in 2004 at the similar orbital phases. Although the 2011 observations do not exactly overlap with the orbital phases of previous studies, they cover the gap in the 2004 data post-periastron light curve and the integrated flux follows the shape of the light curve, yielding a stronger evidence for the repetitive behaviour of the source. Moreover, the spectral shape of the VHE -ray emission from PSR B1259-63/LS 2883 around the 2010/2011 periastron passage is similar to what was observed during previous periastron passages. The photon index of inferred from the 2011 data is well compatible with previous results (H.E.S.S. Collaboration et al., 2013).
III.2 Search for the GeV Flare Counterpart at VHEs
The absence of the flux enhancement during the GeV flare at radio and X-ray wavebands indicates that the GeV flare may be created by physical processes different from those responsible for the emission at other wavelengths. If one assumes that HE and VHE emission are created according to the same scenario, i.e. the same acceleration and radiation processes and sites, then a flux enhancement of the same magnitude as observed at HEs should be also seen at VHEs. The VHE post-periastron data obtained with H.E.S.S. around the 2004 periastron passage do not show any evidence of a flux outburst at orbital phases at which the GeV flare is observed. However, the H.E.S.S. observations around the 2004 periastron passage do not comprise the orbital phase when the GeV flare starts. Moreover, to compare H.E.S.S. 2004 data with the GeV flare observed after the 2010 periastron passage, one has to assume that the GeV flare is a periodic phenomenon, which may not be the case.
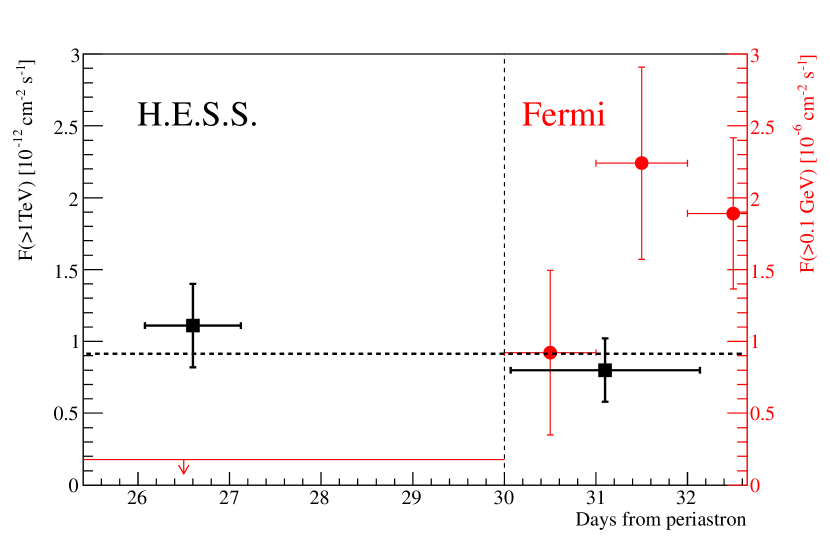
The H.E.S.S. data taken between 9th and 16th of January in 2011 provide a three-day overlap in time with the GeV flare. Therefore, it is possible to directly study any flux enhancement in the VHE band on the time scale of the HE flare. To improve the sensitivity of the variability search the whole period of the H.E.S.S observations was divided into two time periods of almost equal length: ”pre-flare” ( d to d; before the HE flare) and ”flare” ( d to d; during the HE flare). These two datasets were analysed independently and revealed similar fluxes and significance levels (see Table 1). A spectral analysis of the two datasets shows that both spectra are consistent with a simple power law, yielding similar values of the spectral index (see Table 1). The two spectral indices are consistent with the one obtained for the total dataset (H.E.S.S. Collaboration et al., 2013).
A fit of the flux as a function of time with a constant showed no indication of the flux variability. The fit resulted in a mean flux of cm-2 s-1 (black horizontal dashed line in Fig. 3 top) and a -to-NDF ratio of , which corresponds to a probability of 0.39 (H.E.S.S. Collaboration et al., 2013).
To firmly reject the hypothesis of the GeV flare counterpart at VHEs, i.e. the flux enhancement of the same magnitude as GeV flare, the flare coefficient was introduced as the ratio of the fluxes during the flare period and the pre-flare period (H.E.S.S. Collaboration et al., 2013). The ratio of the HE ( GeV) flux averaged over the three-day interval between and to the upper limit on the HE pre-flare emission (see Fig. 3 (Top)) yields a lower limit on the HE emission flare coefficient . The 99.7 % confidence level (equivalent of 3) upper limit on the VHE flare coefficient was estimated using the profile likelihood method (see H.E.S.S. Collaboration et al. (2013) for details). The obtained upper limit of is lower than the observed lower limit on . This result suggests that the HE flare emission has a different nature than the VHE emission.
IV Modeling of the VHE Emission
Several models have been proposed to explain the VHE emission from the source. In a hadronic scenario, the VHE -ray emission could be produced by the interaction of the ultrarelativistic pulsar wind particles with the dense equatorial disk outflow with subsequent production of pions and hence VHE -rays (Kawachi et al., 2004; Neronov and Chernyakova, 2007). However, the detection of the source before the expected disk passage in 2007 casts doubts on the hadronic scenario, suggesting that the VHE emission should be created at least partly by leptonic processes (Aharonian et al., 2009). Within the leptonic scenario, VHE emission from PSR B1259-63/LS 2883 is explained by the inverse Compton (IC) scattering of shock-accelerated electrons on stellar photons (Tavani and Arons, 1997; Kirk et al., 1999; Dubus, 2006a; Khangulyan et al., 2007).
In this paper for the modeling of the VHE emission the leptonic scenario is considered. Since the flaring HE emission was produced in a different scenario than the VHE emission, the HE flux measured by Fermi-LAT can be used to constrain parameters which describe the electron population. Few possible explanations for the nature of the HE flare are discussed in the literature (Khangulyan et al., 2012; Bogovalov et al., 2008; Dubus et al., 2010; Kong et al., 2012), but their discussion is beyond the scope of this paper.
Since at VHE the system was observed for a short period and the lightcurve does not show any variability on this time scale, the time dependence can be neglected, and thus, one population of electrons can be assumed. The energy distribution of the electron density is assumed to follow a power-law with an exponential cut-off
| (1) |
where is the electron spectral index, is the normalisation parameter with , and is the electron cut-off energy. It is further assumed that this distribution of electrons already accounts for all kinds of energy losses and that these losses are not important on the considered time scale. The absorption due to the pair production of the individual -rays is not taken into account in the calculation of the resulting -ray flux, as it does not play an important role in the post-periastron phase (Dubus, 2006b). The electrons are assumed to be distributed isotropically at the spherical termination shock. The stellar radiation at the location of the pulsar wind termination shock plays the role of target photons. The target photon field has then a Planckian distribution with a temperature and an energy density of 1 erg cm-3, which corresponds to the distance between the star and the shock at the observed orbital phase, assuming that the distance from the pulsar to the shock is much smaller than the distance from the star to the shock. Although the model is rather simple and does not account for a number of different processes which take place in the system in the vicinity of the emission region, it can still give an understanding of the population of electrons required to produce the observed VHE -ray flux.
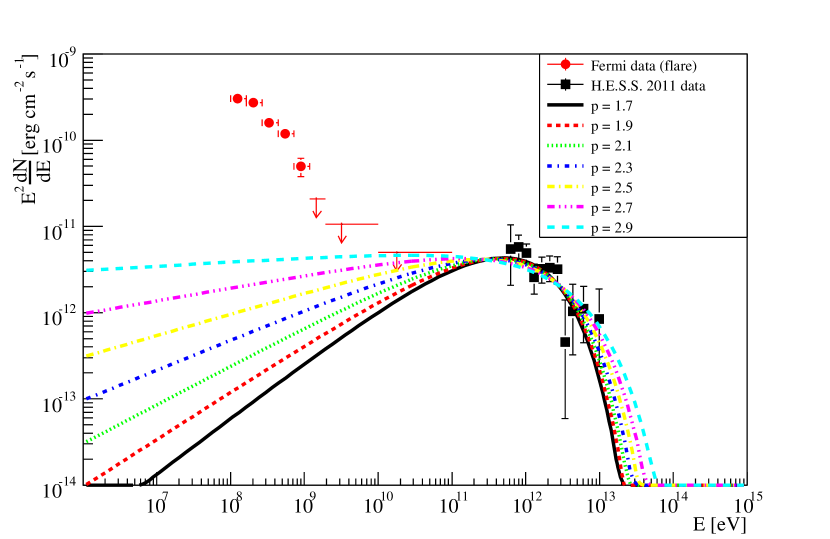
To constrain the IC flux the Fermi upper limit value at 100 GeV is used. If one assumes that GeV is far from the cut-off energy, the IC emission at this energy would depend only on two parameters, and . Therefore, for each assumed , one can calculate the upper limit on . Then, for each pair of and one can estimate by fitting the IC emission to the H.E.S.S. data (Fig. 4). In Table 2, upper limits on and corresponding obtained from the fit of the H.E.S.S. data are shown for different values of the spectral index. The fit probability is also given in the table and is for all studied spectral indices. Based on the obtained parameters of the electron distribution an upper limit on the total energy in electrons which is needed to produce the VHE emission not exceeding the HE emission upper limit can be calculated. It is calculated assuming the minimum energy of the electron GeV. Depending on the assumed spectral index it varies from erg for to erg for . Assuming that the spin-down luminosity of the pulsar, which is about erg/s, is transferred to the electron acceleration with the 100% efficiency a lower limit on time required to accumulate can be derived. The lower limit on time ranges between 1.5 y for to 674 y for . For the range of spectral indices from 1.7 to 1.9 the lower limit on time is less than 3.4 y, i.e. the orbital period of the pulsar. This would mean that electrons accelerated at the shock during one orbital period may lose all their energy producing IC emission close to periastron and this process may repeat every 3.4 y. A possible extension of the electron spectrum down to energies lower than 1 GeV would not change results significantly for .
| , cm-2 | , TeV | Fit prob. | , erg | |
|---|---|---|---|---|
| 1.7 | 6.2 | 0.72 | ||
| 1.9 | 7.1 | 0.70 | ||
| 2.1 | 8.4 | 0.68 | ||
| 2.3 | 10.1 | 0.65 | ||
| 2.5 | 12.8 | 0.61 | ||
| 2.7 | 17.3 | 0.56 | ||
| 2.9 | 26.1 | 0.50 |
V Summary
The binary system PSR B1259-63/LS 2883 was monitored by H.E.S.S. around the periastron passage on 15th of December 2010. The observed flux and spectral shape agree well with what was measured during previous periastron passages. The observations were performed at similar orbital phases as around the 2004 periastron passage, strengthening the evidence for the repetitive behaviour of the source at VHEs.
H.E.S.S. observations were part of a joint MWL campaign that also included radio, optical, X-ray, and HE observations. A spectacular flare observed at HEs with Fermi LAT overlapped in time with the H.E.S.S. observations. A careful statistical study showed that the HE flare does not have a counterpart at VHEs, indicating that the HE and VHE emissions are produced in different physical scenarios. The measured HE flux is then used to constrain the emission produced through the inverse Compton scattering of shocked relativistic electrons of stellar photons which is responsible for the VHE flux. It is shown that for the range of assumed electron spectral indices from 1.7 to 1.9 the lower limit on time is less than the orbital period of the pulsar.
References
- Aharonian et al. (2005a) F. Aharonian, A. G. Akhperjanian, K.-M. Aye, A. R. Bazer-Bachi, M. Beilicke, W. Benbow, D. Berge, P. Berghaus, K. Bernlöhr, C. Boisson, et al., Science 309, 746 (2005a), eprint arXiv:astro-ph/0508298.
- Albert et al. (2006) J. Albert, E. Aliu, H. Anderhub, P. Antoranz, A. Armada, M. Asensio, C. Baixeras, J. A. Barrio, M. Bartelt, H. Bartko, et al., Science 312, 1771 (2006), eprint arXiv:astro-ph/0605549.
- Aharonian et al. (2005b) F. Aharonian, A. G. Akhperjanian, K.-M. Aye, A. R. Bazer-Bachi, M. Beilicke, W. Benbow, D. Berge, P. Berghaus, K. Bernlöhr, C. Boisson, et al., A&A 442, 1 (2005b), eprint arXiv:astro-ph/0506280.
- Aharonian et al. (2007) F. A. Aharonian, A. G. Akhperjanian, A. R. Bazer-Bachi, B. Behera, M. Beilicke, W. Benbow, D. Berge, K. Bernlöhr, C. Boisson, O. Bolz, et al., A&A 469, L1 (2007), eprint 0704.0171.
- Johnston et al. (1992a) S. Johnston, A. G. Lyne, R. N. Manchester, D. A. Kniffen, N. D’Amico, J. Lim, and M. Ashworth, MNRAS 255, 401 (1992a).
- Johnston et al. (1992b) S. Johnston, R. N. Manchester, A. G. Lyne, M. Bailes, V. M. Kaspi, G. Qiao, and N. D’Amico, ApJL 387, L37 (1992b).
- Negueruela et al. (2011) I. Negueruela, M. Ribó, A. Herrero, J. Lorenzo, D. Khangulyan, and F. A. Aharonian, ApJL 732, L11 (2011), eprint 1103.4636.
- Melatos et al. (1995) A. Melatos, S. Johnston, and D. B. Melrose, MNRAS 275, 381 (1995).
- Johnston et al. (1999) S. Johnston, R. N. Manchester, D. McConnell, and D. Campbell-Wilson, MNRAS 302, 277 (1999).
- Connors et al. (2002) T. W. Connors, S. Johnston, R. N. Manchester, and D. McConnell, MNRAS 336, 1201 (2002), eprint arXiv:astro-ph/0207302.
- Johnston et al. (2005) S. Johnston, L. Ball, N. Wang, and R. N. Manchester, MNRAS 358, 1069 (2005), eprint arXiv:astro-ph/0501660.
- Cominsky et al. (1994) L. Cominsky, M. Roberts, and S. Johnston, Astrophys. J. 427, 978 (1994).
- Kaspi et al. (1995) V. M. Kaspi, M. Tavani, F. Nagase, M. Hirayama, M. Hoshino, T. Aoki, N. Kawai, and J. Arons, Astrophys. J. 453, 424 (1995).
- Hirayama et al. (1999) M. Hirayama, L. R. Cominsky, V. M. Kaspi, F. Nagase, M. Tavani, N. Kawai, and J. E. Grove, Astrophys. J. 521, 718 (1999), eprint arXiv:astro-ph/9905172.
- Shaw et al. (2004) S. E. Shaw, M. Chernyakova, J. Rodriguez, R. Walter, P. Kretschmar, and S. Mereghetti, A&A 426, L33 (2004), eprint arXiv:astro-ph/0409253.
- Chernyakova et al. (2009) M. Chernyakova, A. Neronov, F. Aharonian, Y. Uchiyama, and T. Takahashi, MNRAS 397, 2123 (2009).
- Chernyakova et al. (2006) M. Chernyakova, A. Neronov, A. Lutovinov, J. Rodriguez, and S. Johnston, MNRAS 367, 1201 (2006), eprint arXiv:astro-ph/0601241.
- Aharonian et al. (2009) F. Aharonian, A. G. Akhperjanian, G. Anton, U. Barres de Almeida, A. R. Bazer-Bachi, Y. Becherini, B. Behera, K. Bernlöhr, A. Bochow, C. Boisson, et al., A&A 507, 389 (2009).
- Kerschhaggl (2011) M. Kerschhaggl, A&A 525, A80 (2011), eprint 1009.5307.
- Abdo et al. (2011) A. A. Abdo, M. Ackermann, M. Ajello, A. Allafort, J. Ballet, G. Barbiellini, D. Bastieri, K. Bechtol, R. Bellazzini, B. Berenji, et al., ApJL 736, L11 (2011), eprint 1103.4108.
- Tam et al. (2011) P. H. T. Tam, R. H. H. Huang, J. Takata, C. Y. Hui, A. K. H. Kong, and K. S. Cheng, ApJL 736, L10 (2011), eprint 1103.3129.
- H.E.S.S. Collaboration et al. (2013) H.E.S.S. Collaboration, A. Abramowski, F. Acero, F. Aharonian, A. G. Akhperjanian, G. Anton, S. Balenderan, A. Balzer, A. Barnacka, Y. Becherini, et al., A&A 551, A94 (2013), eprint 1301.3930.
- Kawachi et al. (2004) A. Kawachi, T. Naito, J. R. Patterson, P. G. Edwards, A. Asahara, G. V. Bicknell, R. W. Clay, R. Enomoto, S. Gunji, S. Hara, et al., Astrophys. J. 607, 949 (2004), eprint arXiv:astro-ph/0402214.
- Neronov and Chernyakova (2007) A. Neronov and M. Chernyakova, Astrophys. Space Sci. 309, 253 (2007), eprint arXiv:astro-ph/0610139.
- Tavani and Arons (1997) M. Tavani and J. Arons, Astrophys. J. 477, 439 (1997), eprint arXiv:astro-ph/9609086.
- Kirk et al. (1999) J. G. Kirk, L. Ball, and O. Skjaeraasen, Astroparticle Physics 10, 31 (1999), eprint arXiv:astro-ph/9808112.
- Dubus (2006a) G. Dubus, A&A 456, 801 (2006a), eprint arXiv:astro-ph/0605287.
- Khangulyan et al. (2007) D. Khangulyan, S. Hnatic, F. Aharonian, and S. Bogovalov, MNRAS 380, 320 (2007), eprint arXiv:astro-ph/0605663.
- Khangulyan et al. (2012) D. Khangulyan, F. A. Aharonian, S. V. Bogovalov, and M. Ribó, ApJL 752, L17 (2012), eprint 1107.4833.
- Bogovalov et al. (2008) S. V. Bogovalov, D. V. Khangulyan, A. V. Koldoba, G. V. Ustyugova, and F. A. Aharonian, MNRAS 387, 63 (2008), eprint 0710.1961.
- Dubus et al. (2010) G. Dubus, B. Cerutti, and G. Henri, A&A 516, A18 (2010), eprint 1004.0511.
- Kong et al. (2012) S. W. Kong, K. S. Cheng, and Y. F. Huang, Astrophys. J. 753, 127 (2012), eprint 1205.2147.
- Dubus (2006b) G. Dubus, A&A 451, 9 (2006b), eprint arXiv:astro-ph/0509633.