Radio confirmation of Galactic supernova remnant G308.3–1.4
Abstract
We present radio-continuum observations of the Galactic supernova remnant (SNR) candidate, G308.3–1.4, made with the Australia Telescope Compact Array, Molonglo Observatory Synthesis Telescope and the Parkes radio-telescope. Our results combined with Chandra X-ray images confirm that G308.3–1.4 is a bona fide SNR with a shell morphology. The SNR has average diameter of pc, radio spectral index of and linear polarisation of ; We estimate the SNR magnetic field . Employing a relation, we estimate a distance to G308.3–1.4 of . The radio morphology, although complex, suggests a smaller size for the SNR than previously implied in an X-Ray study. These results imply that G308.3–1.4 is a young to middle-aged SNR in the early adiabatic phase of evolution.
keywords:
ISM: individual: G308.3–1.4 – supernova remnants – supernovae general – radio continuum.1 Introduction
The chemical and physical state of the interstellar medium (ISM) is significantly influenced by supernovae (SNe) and their resulting supernova remnants (SNRs). SNe and SNRs are important drivers of Galactic evolution (Tammann et al., 1994; Nomoto et al., 2006) as they can induce star formation by accelerating cosmic rays, heating and compressing nearby clouds and injecting heavy elements into the ISM. According to the continuously updated, online catalogue created by Green (2009), some 274 SNRs are identified in our Galaxy. Understanding the SNR population and its effects on the structure of our Galaxy requires as complete a sample of confirmed SNRs as possible.
G308.3–1.4 was initially classified as a SNR candidate amongst others by Busser (1998), when conducting a search for extended and unidentified X-ray sources in the ROSAT All-Sky Survey (RASS) database. Schaudel et al. (2002) narrowed these to 14 likely SNR candidates of which G308.3–1.4 was one. They noted that G308.3–1.4 exhibited a complex radio morphology but that it coincided with the RASS Position Sensitive Proportional Counter hard X-ray data suggesting more strongly the SNR status of G308.3–1.4.
G308.3–1.4 appears in the source catalogue (Wright et al., 1994, p.223) of the PMN survey at RA(J2000)=037, Dec(J2000)= with a flux density of 89 mJy. It also appears111incorrectly listed as G308.4-1.4 in the MOST SNR catalogue (MSC) (Whiteoak & Green, 1996) with a flux density of mJy, dimensions 144 arcmins and surface brightness . The MSC comments on the possible SNR having several arcs, suggesting a double-ring morphology.
Here, we present a new analysis of unpublished archival radio-continuum observations of the SNR candidate G308.3–1.4 made with the Parkes radio telescope, the Australia Telescope Compact Array (ATCA) and the Molonglo Observatory Synthesis Telescope (MOST) at wavelengths cm. Our work confirms the status of G308.3–1.4 as a bona fide SNR and suggest a different interpretation of its morphology to that of Hui et al. (2012) that also identify G308.3–1.4 as an SNR from an analysis of the X-ray emission. We make the first estimate of its distance, polarisation, measurement of its spectral index and estimate its integrated flux density.
2 Observations and Data reduction
2.1 Australia Telescope Compact Array
From the Australia Telescope Online Archive222http://atoa.atnf.csiro.au (ATOA) we extracted ATCA observational data of G308.3–1.4 (Project C992; PI W. Becker). These radio data are re-reduced and published here for the first time. G308.3–1.4 was observed at 13 cm and 20 cm in 128 MHz continuum mode: 32 full-polarisation 4 MHz channels are spread over 128 MHz intervals centred on 2496 MHz and 1384 MHz respectively. The first observation took 4.26 hours on 1-2 September 2001 in the 6B configuration (baselines from 214 to 5969 m), but these data were adversely affected by storms and covered only a narrow range of parallactic angle. The second observation took place on 11th January 2002. The source was observed for 9.18 hours over a total of 11.36 hours in the 750A configuration (baselines from 77 to 3750 m). In both cases, PKS 1934-638 was observed for flux density and bandpass calibration and PKS 1329-665 for phase calibration.
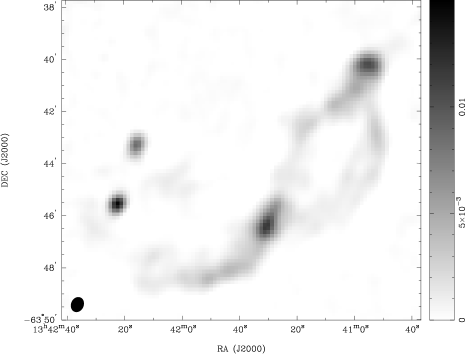
The miriad (Sault et al., 1995) and karma (Gooch, 2006) software packages were used for data reduction and analysis. The 6B data were not used: Combining them with the 750A data yielded no improvement of the final image, due to their poor parallactic angle coverage and contamination by severe interference. The images were constructed using a natural weighting scheme, and the sixth antenna was removed to obtain the best signal to noise ratio, since the array was in a compact arrangement. The final 20 cm image (Fig. 1) has an estimated r.m.s noise level of 0.70 mJy beam-1, and the final 13 cm image (Fig 2) has an estimated r.m.s noise of 0.22 mJy beam-1. These images suffer from missing short spacings and incomplete hour angle coverage, resulting in the highly negative regions seen enclosing the SNR emission. However, they are the highest-resolution images of this object currently available in the radio-continuum.
2.2 Ancillary Data
The MOST image we used was obtained from the Sydney University Molonglo Sky Survey (SUMSS) Postage Stamp Server (release 0.2)333http://www.astrop.physics.usyd.edu.au/cgi-bin/postage.pl. SUMSS is a deep radio survey of the sky south of , covering square degrees. The catalogue (Mauch et al., 2003) contains sources down to a flux density limit of 10 mJy beam-1 (5). Each observation is a 12 hour synthesis, with a synthesised beamshape of at position angle .
The Parkes FITS image of G308.3–1.4 used in this project was obtained from the Parkes-MIT-NRAO (PMN) 4850 MHz survey, downloaded from the ATNF database444http://www.parkes.atnf.csiro.au/observing/databases/pmn/pmn.html. This survey, which was conducted in June and November of 1990, detected 36 640 sources (see Griffith & Wright (1993) for the data reduction details). The final images have a 5′ beam.
The Chandra satellite (Weisskopf et al., 1996) observed G308.3–1.4 on 26 June 2010 for 17 ks (observation ID 11249), and we extracted these data products from the Chandra Data Archive (CDA)555http://cxc.harvard.edu/cda/.
3 Results
3.1 Morphology
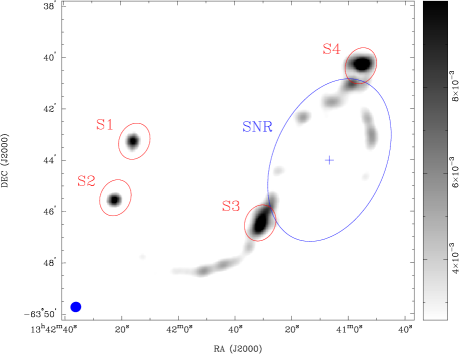
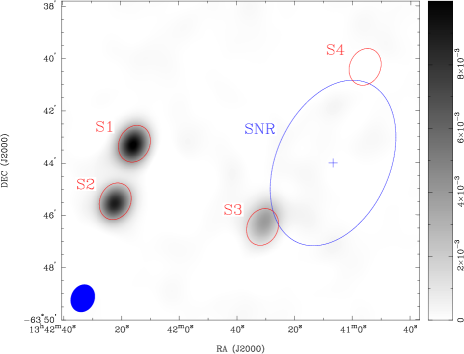
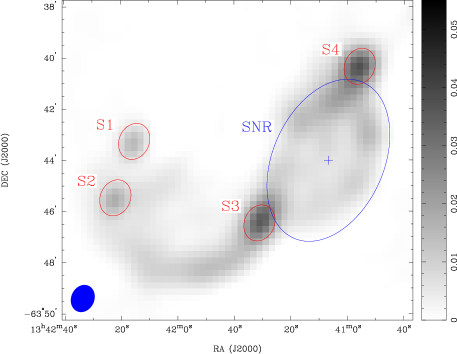
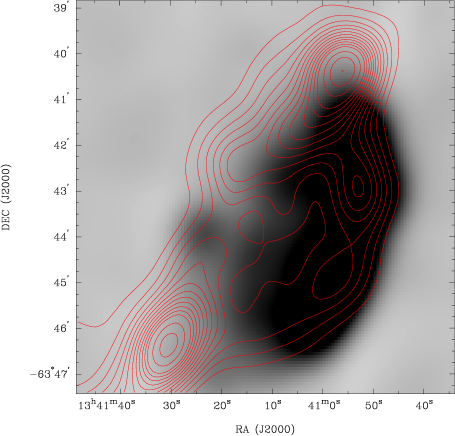
Figure 1 shows the elliptical region that we contend corresponds to SNR G308.3–1.4. We define the SNR centre to be RA(J2000)=0672, Dec(J2000)= (indicated by the cross in Fig. 1), which corresponds to the mid point of this elliptical region.
In considering the complex radio-continuum emission shown in Fig. 1 we need to determine how likely the point like emission is associated to the extended emission. The emission will be either intrinsic to G308.3–1.4 or from unassociated foreground or background sources.
The bright regions on the north-west and south-east edges of this ellipse (S4 and S3 in Figs. 1 & 3), in addition to the two sources seen east of the remnant (S1 and S2 in Figs. 1, 3 & 4) do not have X-ray counterparts. We argue that these sources are not likely to be associated with the SNR in any way, and are most likely to be background sources (radio galaxy or AGN), or unresolved foreground sources. To confirm this we created a 20 cm image (Fig 3) including all baselines, ie. with the sixth antenna included, and with the Brigg’s visibility weighting robustness parameter set to 0.5 in order to achieve the best balance between sidelobe suppression and signal to noise ratio. In this image S1 and S2 appear clearly as point sources, elongated at the position angle of the beam and with similar dimensions. Furthermore, S2 has an Infrared counterpart given in the InfraRed Astronomy Satellite (IRAS) Point Source Catalog as IRAS 13388-6330. The source labelled S3 is a pointlike source with what appear to be radio jets coming out of either side of the centre to the north-west and south-east. To further test the pointlike properties of these sources another 20 cm image (Fig 4) was created using only the longest baselines, i.e. those from antenna 6 to the other elements. S1, S2 and S3 retain their pointlike appearance, which further strengthens the case for them being background sources and not part of the SNR. We calculated 3-point spectral indices, 666Spectral index defined as , at wavelengths = 36, 20 and 13 cm for sources S1 to S4 to be respectively: ; , and . The flat spectral index of S2 might indicate that it is a Galactic or foreground source, such as a compact HII region. However, we do not believe it to be associated with G308.3–1.4, as it is well outside the shock fronts. Although source S4 and the SNR are resolved out in Fig. 4 (using the 5969 m ATCA baseline), S4 is still likely to be a radio galaxy or possibly an AGN, because of its localised flux density (Fig. 3) and steep spectral index.
The Chandra image (Fig. 5) shows a strong correlation with the west side of the proposed SNR region. Such a one-sided, asymmetric morphology suggests a type II, Ib or Ic SN progenitor. If this were the case, then the east side of the ‘shell’ seen in the image might be a radio jet emitting out of the opposite side of S3. However, despite there appearing to be no shock front X-ray emission on the eastern side of the SNR shell, the centre of the remnant still contains emission, appearing relatively brighter than the background noise. Additionally, no evidence can be found for an associated pulsar wind nebula or neutron star that would be expected from a type II, Ib or Ic SN progenitor. Prinz & Becker (in prep.) consider the possibility of the X-ray emission originating from a galaxy cluster, but conclude that its X-ray spectral properties strongly favour an SNR nature. Given all this, and taking into account the likelihood of the different SNRs morphologies (Gaensler, 1999), we determine that this object is a shell SNR, slightly elongated in the north-south direction.
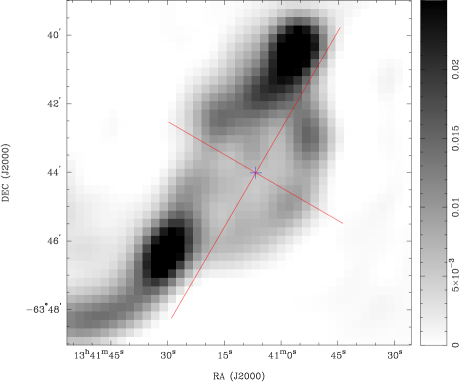
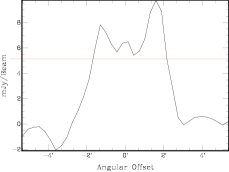
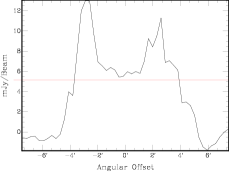
3.1.1 Angular Diameter
Profile plots of intensity against position, for the minor and major axes of the object (shown in Fig. 6) are shown in Fig. 7. From these, we determine the angular size of the SNR to be and the shell thickness (width of the peaks above ) to be . This gives a volume filling factor of .
3.2 Integrated Flux Density
Table LABEL:Tab1 lists the estimated integrated flux density at the different frequencies. The integrated flux densities were estimated by including all the flux measurements corresponding to the remnant (i.e. within our SNR region as seen in Fig. 1.), which was determined by a contour at the level. The Parkes image suffers from confusion and the flux density measured includes the background sources. Additionally, it should be noted that the flux density at 13 cm was calculated based on an image constructed with a -range up to 4 k. We estimate that the error in flux densities is no more than .
| Radio | Beam Size | ||||
|---|---|---|---|---|---|
| Telescope | (MHz) | (cm) | (mJy beam-1) | (arcsec) | (mJy) |
| MOST | 843 | 36 | 1.5 | 257 | |
| ATCA | 1384 | 20 | 0.7 | 215 | |
| ATCA | 2496 | 13 | 0.5 | 124 | |
| arkes | 4850 | 6 | 15.0 | 84 |
3.3 Spectral Index
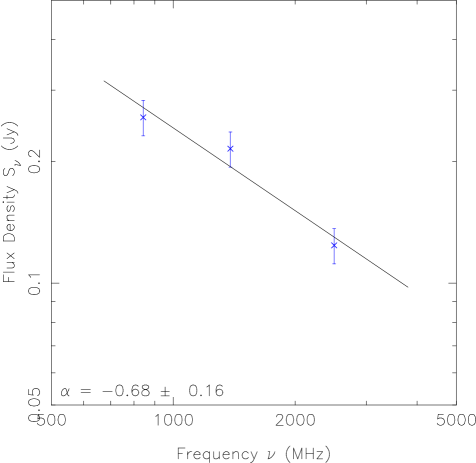
By fitting a power law to the measured integrated flux densities at wavelengths = 36, 20 and 13 cm we created a three-point spectral index plot (Fig. 8). The estimated spectral index is , indicating that the radio emission from G308.3–1.4 is mostly non-thermal synchrotron radiation. This spectral index is consistent with a typical SNR spectrum, with < < (Filipović et al., 1998). Given this trend for the integrated flux density as a function of frequency, we estimate the flux density at 1 GHz to be mJy.
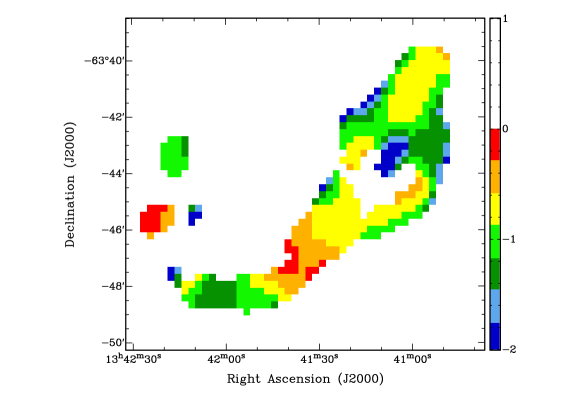
In a similar fashion, we constructed the three-point spectral distribution map (36, 20 and 13 cm), shown in Fig. 9. The map shows the region corresponding to the SNR having a spectral index ranging primarily between 0.5 < < 1.5. The spectral index is quite steep at the edge of the shell of the SNR but becomes shallower toward the centre of the remnant. This distribution would be expected from a young to middle-aged SNR which accelerates particles efficiently at the strong shock front, producing strong synchrotron radiation.
3.4 Distance Estimate
Although controversial, the relation (Shklovsky, 1960; Case & Bhattacharya, 1998; Arbutina et al., 2004; Urošević et al., 2005, 2010) is the only method that can be used to estimate a distance from our data. It states that the surface brightness is related to the diameter by , where is a constant dependent on the characteristics of the SN’s initial explosion and the surrounding ISM, while is almost entirely independent of these. The theory surrounding the relation has evolved greatly since it was originally proposed, now incorporating many SNR cases, including that of bremsstrahlung radiation (Urošević & Pannuti, 2005). G308.3–1.4 exhibits features typical of a SNR in the adiabatic stage, such as bright X-ray emission, a negative spectral index and significant linear polarisation. Since precise details about the local environment of G308.3–1.4 are unknown, we estimated a distance to the SNR using the new Galactic relation (Pavlović et al., 2012 submitted) which is calibrated with 50 Galactic shell-like SNRs with independently determined distances using the orthogonal fitting procedure.
We estimate the surface brightness at 1 GHz to be = 1.110-21 W m-2 Hz-1 sr-1 which gives an average diameter of 19 pc and thus an average distance of , which would indicate that G308.3–1.4 is on the far side of the Galaxy. This average distance comes from the average of the major and minor axes, while the uncertainties arise from the upper and lower limits for . At this distance, G308.3–1.4 would lie pc above the Galactic plane, with linear dimensions of and shell thickness pc.
Placing G308.3–1.4 on the Berezhko & Völk (2004) surface brightness-diameter diagram (at 1 GHz) suggests that G308.3–1.4 is in the early adiabatic phase of evolution, expanding into an extremely low-density environment with an initial energy somewhat lower than the canonical SN energy of ergs. The suggested low-density environment is consistent with our estimated position of the SNR, 0.5 kpc out of the Galactic plane.
3.5 Polarimetry
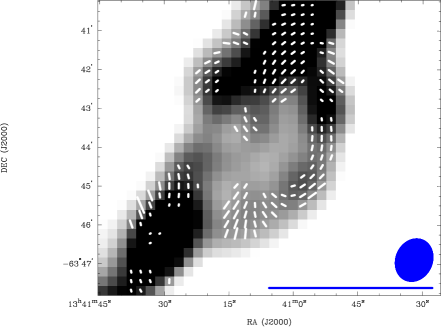
Since the ATCA observations recorded Stokes parameters , and , in addition to total intensity , we were able to determine the polarisation of the SNR at 20 cm. Fig. 10 shows the regions polarised above a level of 3. The electric field vectors are parallel with the shell of the SNR around most of the circumference of the SNR, particularly along its western side. This arrangement is expected as the SNR’s particles are experiencing the greatest acceleration and most efficiently producing synchrotron radiation. The maximum fractional polarisation is is estimated to be P=10. The polarisation vectors overlaying background source S4 are probably unreliable, due to possible confusion between the SNR and background source. No reliable polarisation was detected at 13 cm. This might indicate significant depolarisation in the remnant, but the polarimetric response of the ATCA is poor at 13 cm.
We used the new equipartion formula derived by Arbutina et al. (2012) based on the diffusive shock acceleration (DSA) theory of Bell (1978) to estimate a magnetic field strength: This formula is particularly relevant to magnetic field estimation in SNRs, and yields magnetic field strengths between those given by the classical equipartition (Pacholczyk, 1970) and revised equipartition (Beck & Krause, 2005) methods. We estimate the magnetic field strength, , and the minimum total energy of the synchrotron radiation, (see Arbutina et al. (2012); and corresponding online “calculator” 777http://poincare.matf.bg.ac.rs/arbo/eqp/).
The value of 29 G indicates that this SNR’s magnetic field is not only influenced by the compression of the ISM magnetic field (1 G in a low density environment), but is also (moderately) amplified by DSA effects (see Bell (2004)). The relatively young estimated age of this SNR, somewhat steep spectral index (Bell et al. (2011)), and moderately amplified magnetic field, constitute the standard description of an SNR in the early Sedov phase of evolution.
4 Conclusions
Analysis of our new radio-continuum images of the galactic radio source G308.3–1.4, produced from from 20 and 13 cm ATCA archival data confirms that the object is indeed a bona fide SNR. The overall spectral index of G308.3–1.4 is , with the emission 10 linearly polarised. These properties indicate that it is likely to be young to middle-aged, with the majority of its radio emission being non-thermal, due to the strong shock wave driving the shell and accelerating particles creating synchrotron radiation. We suggest G308.3–1.4 is in the early adiabatic expansion stage, due to its significant X-ray brightness, steep non-thermal spectral index and linear polarisation. We estimate the magnetic field strength, , which is consistent with the SNR being at this evolutionary stage.
Taking these new ATCA radio-continuum images in conjunction with the high resolution Chandra X-ray image, we find that G308.3–1.4 is likely to be of an elongated shell-like morphology, with the X-ray emission appearing stronger on the western side of the shell. No evidence for an associated compact central object was found.
We have used the new Galactic relation of Pavlović et al. (2012 submitted) to estimate the dimensions of the source and thus its distance: G308.3–1.4 was found to have an average diameter of 3419 pc and a distance of 1911 kpc.
Our radio images could be greatly improved by further ATCA observations with better parallactic angle coverage and higher resolution. Additional X-ray spectral observations with the XMM-Newton satellite would also yield new insights into the elemental abundances and energies of G308.3–1.4.
5 Acknowledgments
We used the karma software package developed by the ATNF. The Australia Telescope Compact Array and Parkes radio telescope are part of the Australia Telescope National Facility which is funded by the Commonwealth of Australia for operation as a National Facility managed by CSIRO. This paper includes archived data obtained through the Australia Telescope Online Archive (http://atoa.atnf.csiro.au). This research is supported by the Ministry of Education and Science of the Republic of Serbia through project No. 176005.
References
- Arbutina et al. (2012) Arbutina B., Urosević D., Andjelić M. M., Pavlović M. Z., Vukotić B., 2012, ApJ, 746, 79
- Arbutina et al. (2004) Arbutina B., Urošević D., Stanković M., Tešić L., 2004, MNRAS, 350, 346
- Beck & Krause (2005) Beck R., Krause M., 2005, Astronomische Nachrichten, 326, 414
- Bell (1978) Bell A. R., 1978, MNRAS, 182, 443
- Bell (2004) Bell A. R., 2004, MNRAS, 353, 550
- Bell et al. (2011) Bell A. R., Schure K. M., Reville B., 2011, MNRAS, 418, 1208
- Berezhko & Völk (2004) Berezhko E. G., Völk H. J., 2004, A&A, 427, 525
- Busser (1998) Busser J.-U., 1998, PhD thesis, Munich
- Case & Bhattacharya (1998) Case G. L., Bhattacharya D., 1998, ApJ, 504, 761
- Filipović et al. (1998) Filipović M. D., Haynes R. F., White G. L., Jones P. A., 1998, A&AS, 130, 421
- Gaensler (1999) Gaensler B. M., 1999, PhD thesis, University of Sydney
- Gooch (2006) Gooch R., 2006, Karma Users Manual. Australia Telescope National Facility
- Green (2009) Green D. A., 2009, Bulletin of the Astronomical Society of India, 37, 45
- Griffith & Wright (1993) Griffith M. R., Wright A. E., 1993, AJ, 105, 1666
- Hui et al. (2012) Hui C. Y., Seo K. A., Huang R. H. H., Trepl L., Woo Y. J., Lu T.-N., Kong A. K. H., Walter F. M., 2012, ApJ, 750, 7
- Mauch et al. (2003) Mauch T., Murphy T., Buttery H. J., Curran J., Hunstead R. W., Piestrzynski B., Robertson J. G., Sadler E. M., 2003, MNRAS, 342, 1117
- Nomoto et al. (2006) Nomoto K., Tominaga N., Umeda H., Kobayashi C., Maeda K., 2006, Nuclear Physics A, 777, 424
- Pacholczyk (1970) Pacholczyk A. G., 1970, Radio astrophysics. Nonthermal processes in galactic and extragalactic sources, Pacholczyk, A. G., ed. Freeman, San Francisco
- Pavlović et al. (2012 submitted) Pavlović M., Urošević D., Vukotić B., Arbutina B., Göker Ü., 2012 submitted, ApJS
- Sault et al. (1995) Sault R. J., Teuben P. J., Wright M. C. H., 1995, in Astronomical Society of the Pacific Conference Series, Vol. 77, Astronomical Data Analysis Software and Systems IV, R. A. Shaw, H. E. Payne, & J. J. E. Hayes, ed., p. 433
- Schaudel et al. (2002) Schaudel D., Becker W., Voges W., Aschenbach B., Reich W., Weisskopf M., 2002, in Astronomical Society of the Pacific Conference Series, Vol. 271, Neutron Stars in Supernova Remnants, P. O. Slane & B. M. Gaensler, ed., pp. 391–+
- Shklovsky (1960) Shklovsky I., 1960, Astron. Zh.
- Tammann et al. (1994) Tammann G. A., Loeffler W., Schroeder A., 1994, ApJS, 92, 487
- Urošević & Pannuti (2005) Urošević D., Pannuti T. G., 2005, Astroparticle Physics, 23, 577
- Urošević et al. (2005) Urošević D., Pannuti T. G., Duric N., Theodorou A., 2005, A&A, 435, 437
- Urošević et al. (2010) Urošević D., Vukotić B., Arbutina B., Sarevska M., 2010, ApJ, 719, 950
- Weisskopf et al. (1996) Weisskopf M. C., O’dell S. L., van Speybroeck L. P., 1996, in SPIE Conference Series, Vol. 2805, , pp. 2–7
- Whiteoak & Green (1996) Whiteoak J. B. Z., Green A. J., 1996, A&AS, 118, 329
- Wright et al. (1994) Wright A. E., Griffith M. R., Burke B. F., Ekers R. D., 1994, ApJS, 91, 111