In science “there is no bad publicity”: Papers criticized in comments have high scientific impact
Abstract
Comments are special types of publications whose aim is to correct or criticize previously published papers. For this reason, comments are believed to make commented papers less worthy or trusty to the eyes of the scientific community, and thus predestined to have low scientific impact. Here, we show that such belief is not supported by empirical evidence. We consider thirteen major publication outlets in science, and perform systematic comparisons between the citations accumulated by commented and non commented articles. We find that (i) commented papers are, on average, much more cited than non commented papers, and (ii) commented papers are more likely to be among the most cited papers of a journal. Since comments are published soon after criticized papers, comments should be viewed as early indicators of the future impact of criticized papers.
I Introduction
In , Nikolaus Copernicus proposed a heliocentric model that will have revolutionized the human view of the universe Kuhn (1957). The paradigm shift proposed by the new ideas of Copernicus caused an unavoidable controversy in the scientific community of his era, still anchored to the geocentrism. The dispute involved some of the brightest brains of the period –including Galilei, Kepler and Netwon– and lasted for more than two centuries before the complete acceptance of the heliocentric model for the the description of the solar system. The controversy behind the Copernican revolution is just one of the most popular examples of scientific controversies that are part of the history of science. Other well known examples are the controversy which followed the publication of the theory of evolution by Darwin Vorzimmer (1972), the Bohr-Einstein debate about the fundamentals of quantum mechanics Schilpp (1949), and the dispute originated by Wegener with his theory of continental drift Jacoby (1981). In the course of the history of science, however, not all scientific disputes have been resolved in favor of the original idea that caused the controversy: the observation of -rays Klotz (1980), the theory of cold fusion Lewenstein (1992) and the finding of water memory Davenas et al. (1988); Hirst et al. (1993) are all examples of theories or experimental results, associated to fervent scientific controversies, that have been at the end rejected or disregarded by the scientific community.
Either resolving in favor
or against the scientific findings that
originated the disputes, scientific controversies are
thought to be necessary for scientific
progress Engelhardt and Caplan (1987); Machamer et al. (2000).
Even if not all the greatest achievements
in science have passed through a dispute,
as for example the unification of electricity
and magnetism by Maxwell, many major steps in
science have been controversial.
Revolutionary changes
are per se controversial because they
reverse previous scientific paradigms, and thus
necessarily encounter some resistance
before getting accepted. Scientific disputes,
however, are not only associated to revolutionary
discoveries, but they are also part of the
process of scientific production: science
is, in fact, simultaneously
a cooperative and antagonistic enterprise,
where scientists both collaborate,
with the interchange of information, and compete,
through the exchange of criticisms.
While the structure of collaboration
networks Newman (2004)
and the importance of teams
for the creation of scientific
knowledge Guimerà et al. (2005); Wuchty et al. (2007) have been
empirically analyzed, no much
is quantitatively known about
scientific disputes. Scientific controversies are
usually studied in philosophy of science,
but only through the analysis of popular case
examples and never in quantitative
terms Engelhardt and Caplan (1987); Machamer et al. (2000).
Here for the first time, we provide a quantitative and
large-scale study of scientific controversies.
We focus our attention on modern scientific disputes identifiable with
the publication of formal comments.
We systematically study the difference
between the citations accumulated
by commented and non commented papers, and show
that comments
can be statistically interpreted
as early signs of the future impact of criticized
papers.
II Results
Comments are short publications whose purpose is to address
core arguments, theories or experimental
results of recently published research
papers. The name of this type of publications
varies from journal to journal. For example, in Nature they are
called “Brief Communications Arising”, in Science
“Technical Comments”, in Physical Review Letters
“Comments”, in
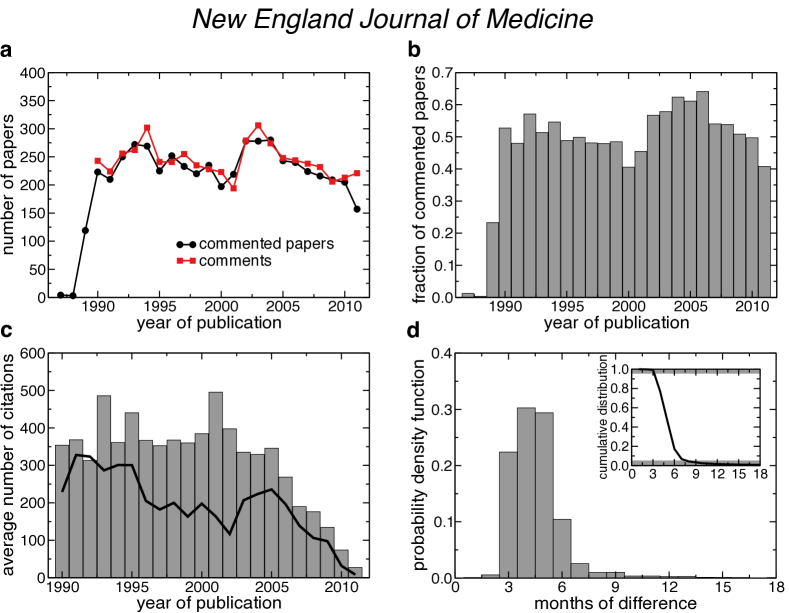
New England Journal of Medicine “Letters to the Editor”, etc.
When submitted, comments are considered by journal
editors in a similar way as normal articles:
in order to be published, they need to satisfy strict requirements of
broad interest, and have to pass the scrutiny
of peer-review.
The vast majority of comments represent formal criticisms to
the content of commented papers.
Irrespectively of
the journal of publication, editorial policies are,
in this regard, very explicit:
just to cite an example, in Physical Review Letters “a comment
corrects or criticizes a specific Letter” and
“is not meant to be a vehicle for addenda”
(forms.aps.org/author/comments-prl.pdf).
In addition, a comment is generally followed by a so-called “reply”
or “response”, written by the same authors of the criticized paper,
with the purpose of defending their own paper
from the criticisms of the comment. Comments and replies are
published one after the other in the same issue of the journal,
and thus provide a fair way to give
birth to a scientific dispute, where both parts present
and defend their own opinions.
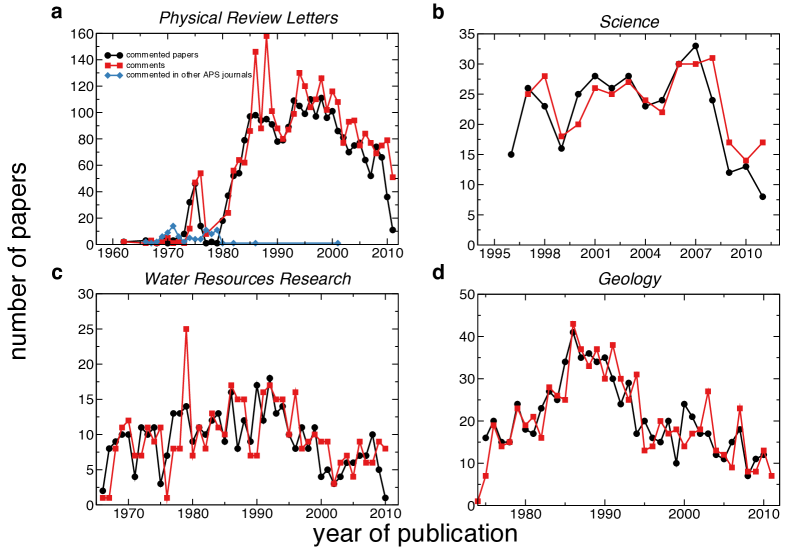
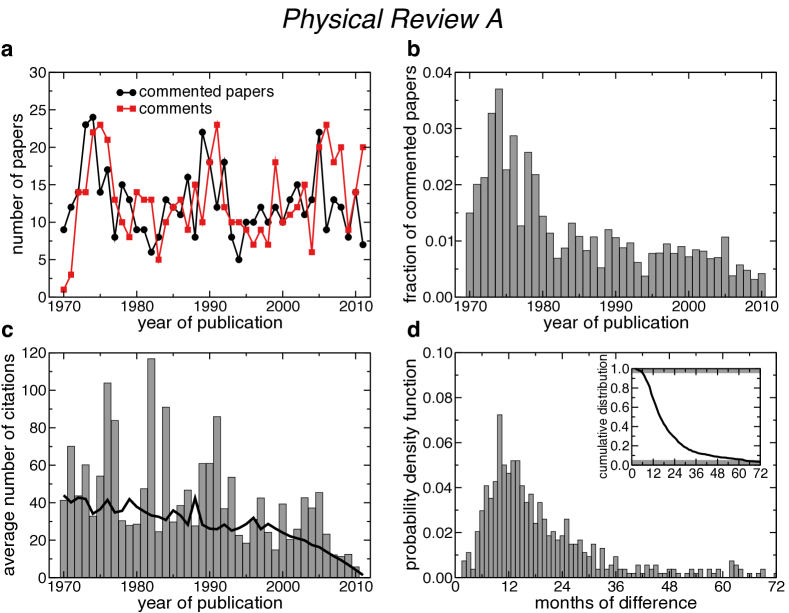
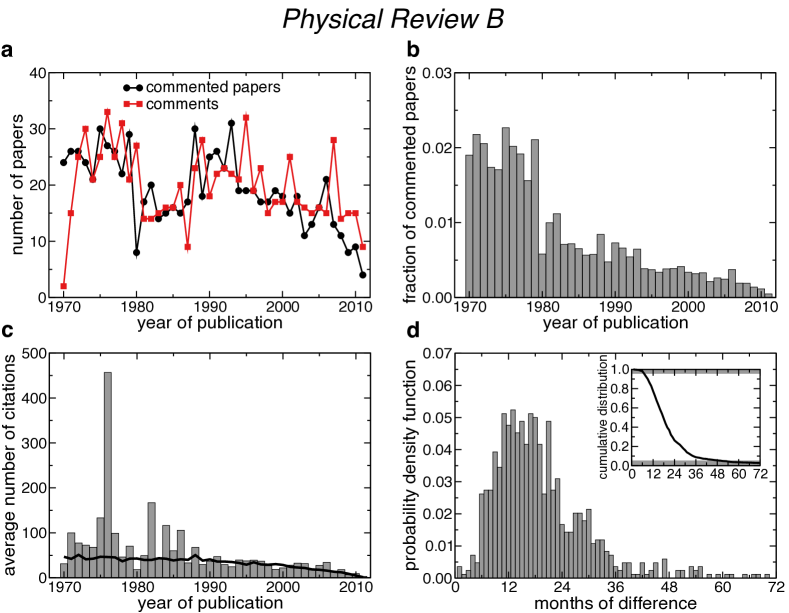
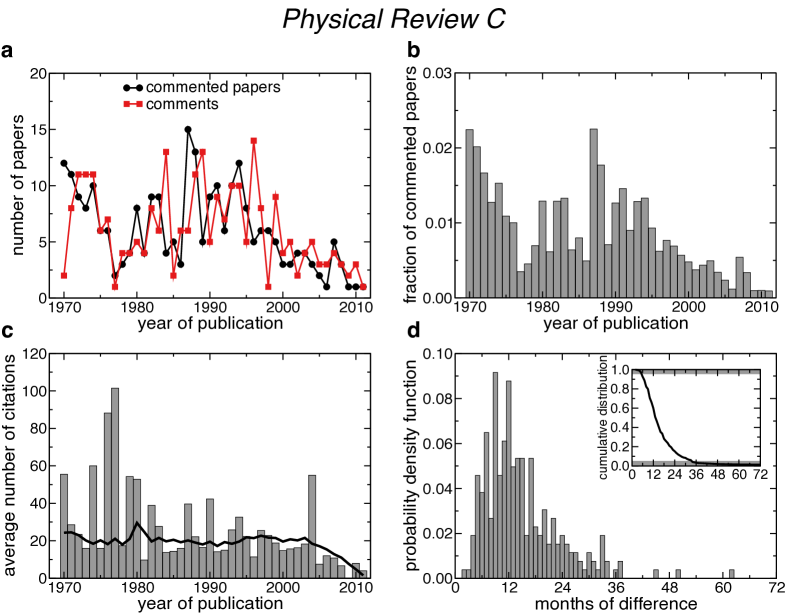
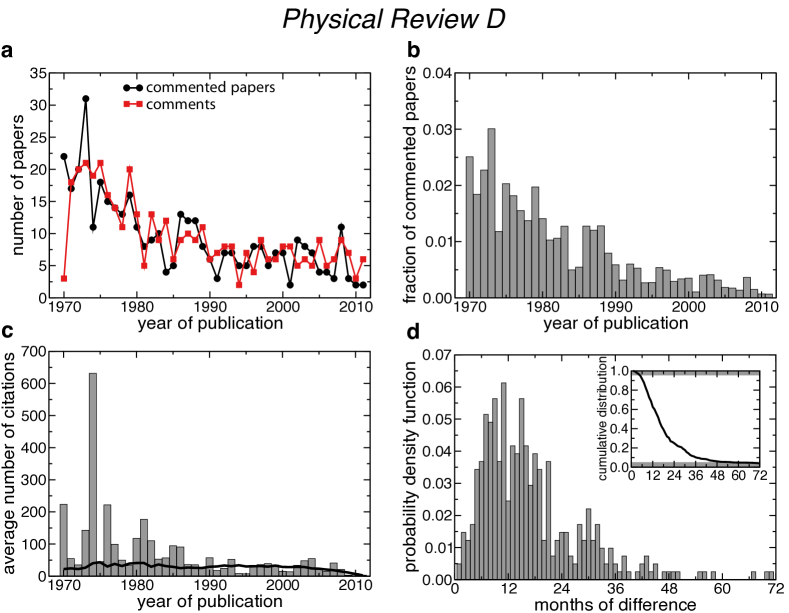
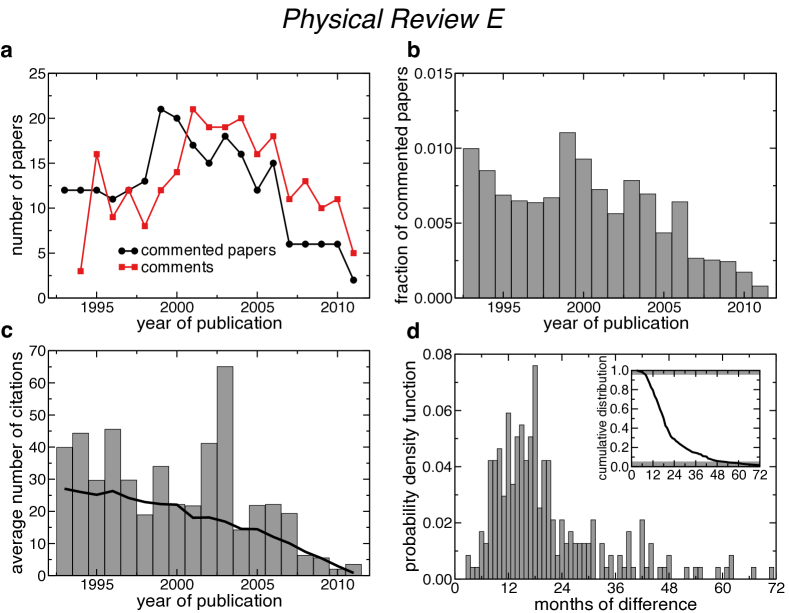
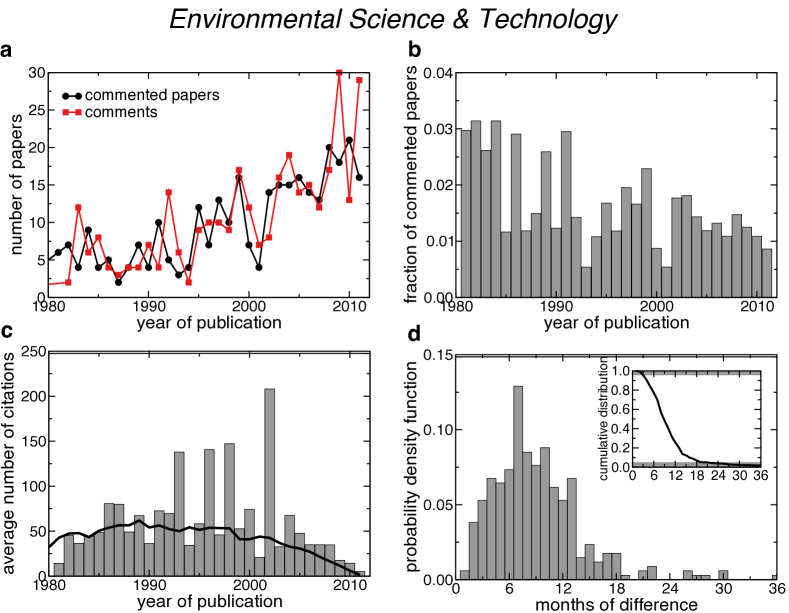
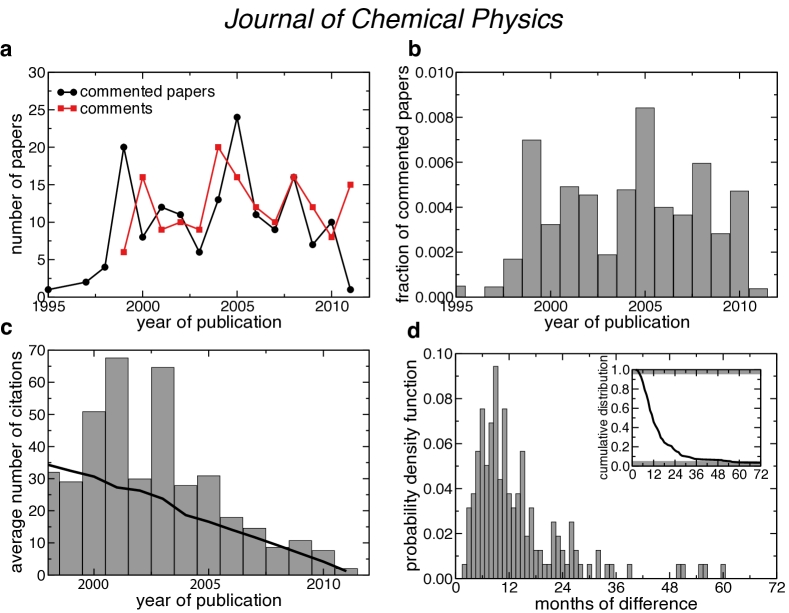
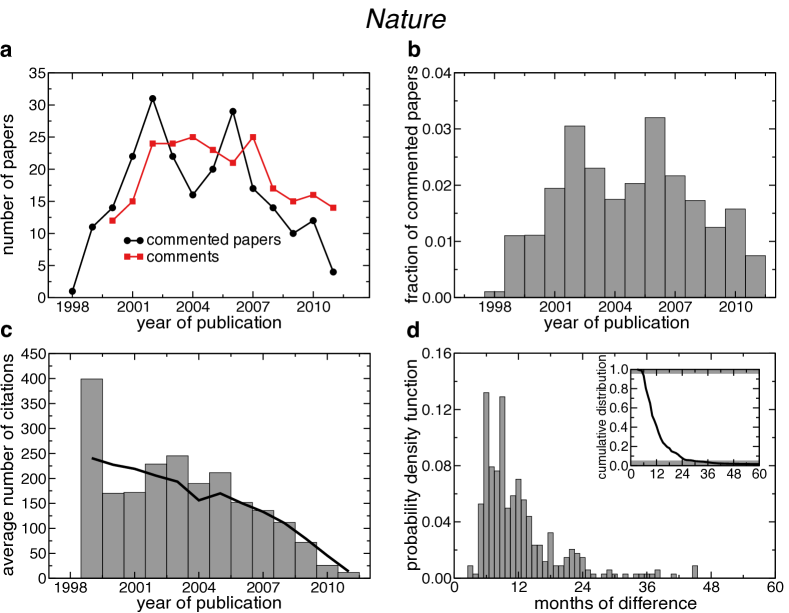
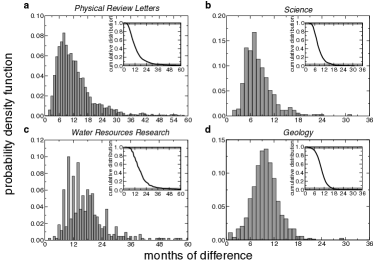
We identified all formal comments published in the last ten to fifty years in thirteen major publication outlets in science, including multidisciplinary and specialist journals (focusing on research topics in environmental sciences, geology, medicine and physics). We automatically associated each comment to the criticized publication (see supplementary information). Finally, we collected from the Web Of Science database (isiknowledge.com) the number of citations accumulated by each publication (as of April ). In our citation analysis, we restricted the attention only to papers published before in order to rank papers on the basis of stable citation distributions Stringer et al. (2008) and be confident that the vast majority of comments to these papers have been already published (i.e., in more than the of the cases, comments are published less than years after criticized papers, see Figures 3 and S2-10).
Though commented papers represent a small percentage of the publications of a journal (Table S1), already with a qualitative analysis it is possible to notice that many of the top cited articles of a journal are papers that were criticized in formal comments (Tables S2-4). In Physical Review Letters for example, the most cited paper is “Generalized Gradient Approximation Made Simple”, Phys. Rev. Lett. 77, 3865 (1996), with over citations, and this paper was criticized in a formal comment. More in particular, while the percentage of commented papers in Physical Review Letters in our period of observation is just , we find that the most cited commented papers are in the list of the most cited papers of the journal, a proportion times larger than what expected by chance. In the other journals, the situation is similar and the most cited commented papers have an absolute rank, based on the raw number of citations they have accumulated, from to times higher than what expected in the case in which being or not being commented would be unrelated to the number of citations accumulated (Table S1). The only less evident case is represented by the publications in Nature, where the rank of the most cited commented papers of the journal is times higher than what expected by chance.
From the previous qualitative analysis
based on a limited number of case examples, it seems
not only that
commented papers receive more citations than
non commented papers, but also that
commented articles are unexpectedly more present
in the population of the most cited publications.
In order to statistically confirm the validity of these observations,
we present here a systematic analysis.
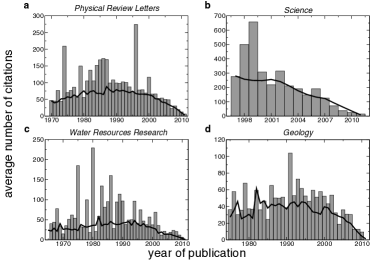
First, we look at the average citation
rates of commented and non commented papers.
In order
to avoid age-dependent biases in the
number of citations Radicchi et al. (2008), we compare the
average number of citations
received by papers published in the same year.
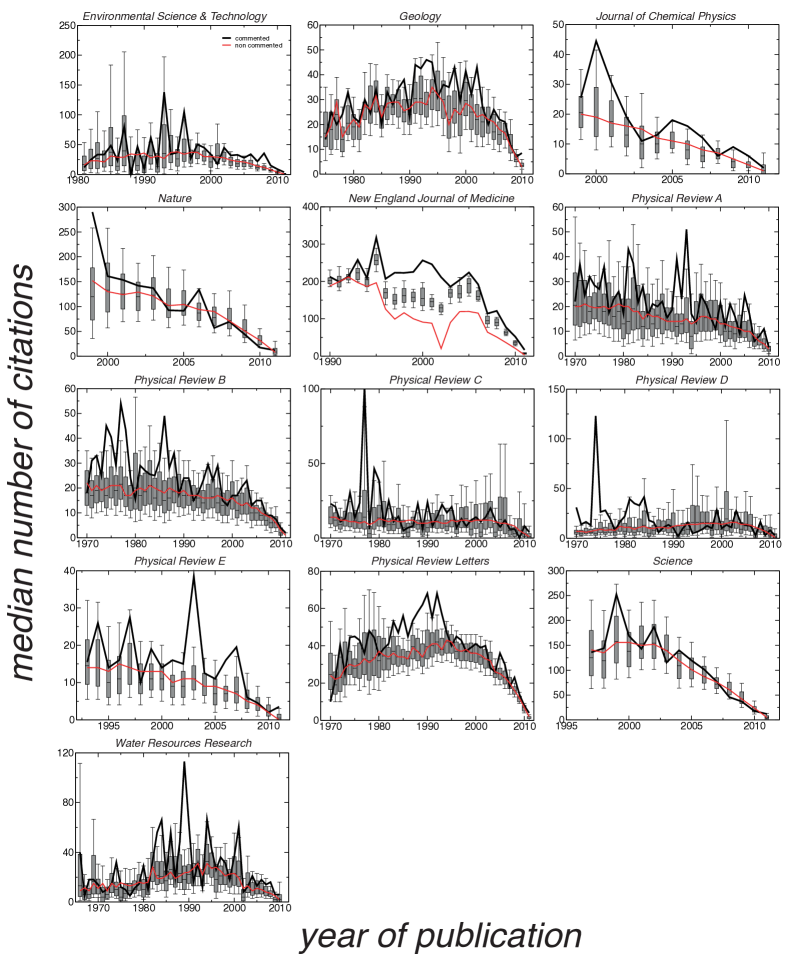
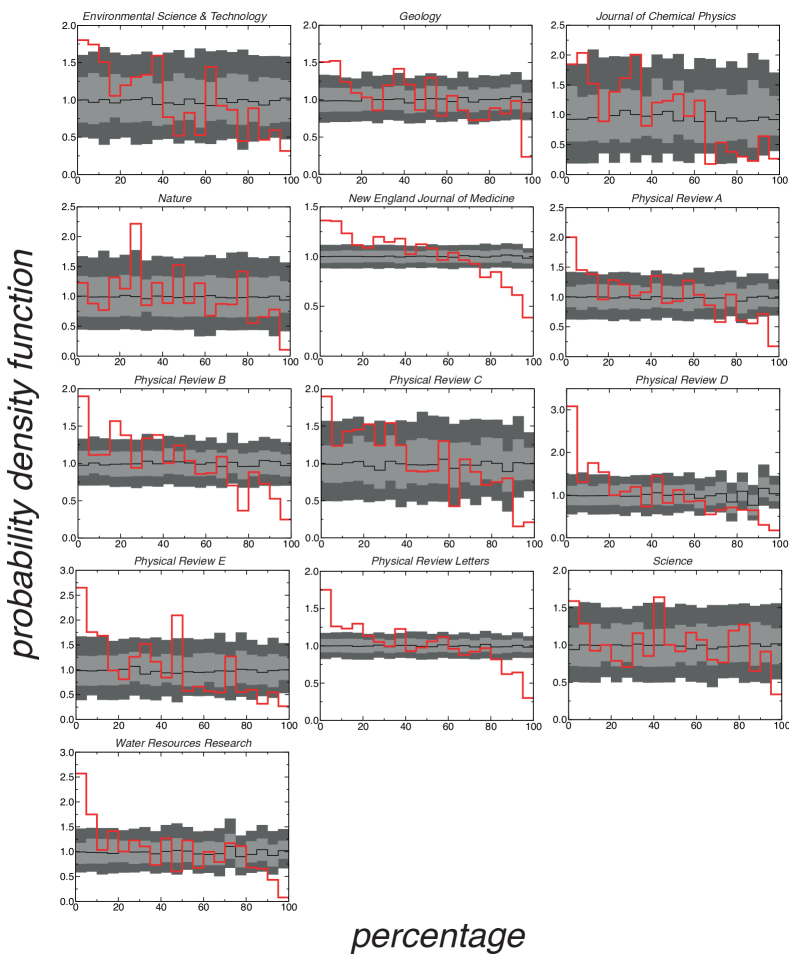
The results for the various journals are presented in
Figures 1 and S2-10. We confirm indeed that
commented papers are, on average, much more cited than
non commented papers.
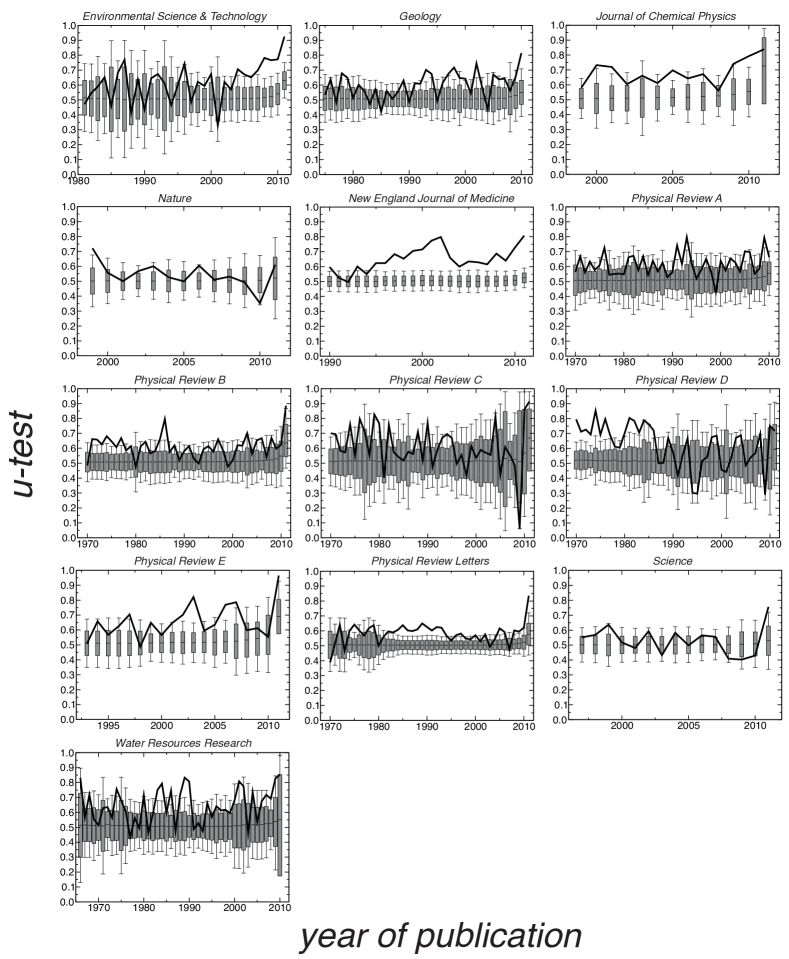
However, the observation that a commented paper
typically receives more citations than a
non commented article
is valid not only by looking at
average citation numbers, but
also by considering
other types of measures (e.g, median citation numbers, Figure S11)
and performing
non parametric statistical tests
(e.g., Mann-Whitney-test, Figure S12).
In general,
while in single years of publication the fact
that a commented paper is more cited than a non commented
article
could be still explained in terms
of statistical fluctuations,
the persistence over many years of a positive
signal allows us to say that
commented papers significantly accumulate more citations
than non commented articles.
Second, we investigate the presence
of commented papers in the population of the most cited articles.
We compare only
papers published in the same journal, and
assign to each paper a score equal to the fraction of articles
published in the same year that received a smaller number of citations.
If the score of a paper is equal to one
this means that the paper is the most cited publication
of the year, while if the paper’s score
equals zero this means that the paper
is among the least cited articles of the year.
Since
the score is not dependent on the publication
year (i.e., the score is
a distribution-free indicator),
we can directly compare the impact of papers
published in different years,
and thus increase the overall number of comparisons and
obtain a more clear statistical picture.
We then perform, using these scores, a ranking between all papers
independently of their year of publication, and
select the top of publications (or equivalently those
with score larger than ) in the ranking.
Notice that this is equivalent to the selection
of the top of the most cited papers in each year.
We finally count the fraction of commented papers
in the top , and compare the measured values with those expected by
chance in the hypothesis that being in the top
and being a commented paper would be
two independent events Radicchi and Castellano (2012).
A realization of this statistical
ensemble is obtained by randomly mixing the scores
only among papers published in the same year. This procedure ensures that the number of
commented papers per year is constant, but removes
any eventual dependence between citation
numbers and the fact that papers have or have not
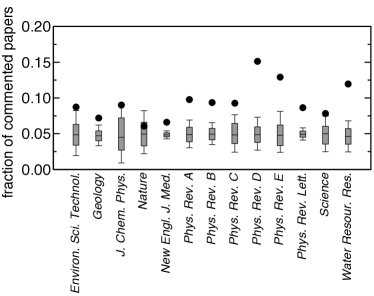
been commented. By generating
independent realizations,
we find that commented papers over-populate the
top of cited papers in each journal (i.e., measured values
are larger than expected median values), and
more importantly that, in the majority of the
journals, these proportions
are at least two standard deviations larger
than what one would expect by chance (Figure 2).
More in detail, by looking at the
rank probability
density of commented papers (Figure S13), we can
observe a general pattern with the following properties:
(i) At low rank positions, commented papers
are less present than expected. This is not surprising
since low rank positions are mainly occupied by uncited papers
or papers
with few citations, and commented papers
are never uncited because they are cited
at least by the comment and the eventual reply.
(ii) At medium rank positions, the distribution
is compatible with the expected uniform distribution.
(iii) At high rank positions, commented papers
are more present than expected.
This means that
commented papers
over-populate the set of the most
cited publications of each journal, and this observation
is statistically incompatible with the assumption
that commented and non commented papers accumulate
citations with the same rates.
Notice that this does not mean that a paper, in order
to be highly cited, necessarily needs to be
a commented paper, but that the conditional probability
to be a top cited
paper, given that the paper is a commented article,
is much higher than the respective unconditional probability.
For example in Physical Review D,
the unconditional probability to be in the top is ,
while the conditional probability for commented papers
is three times larger and equals .
III Discussion
Contrarily to the popularity of the
wisdom of “any publicity is good publicity”,
according to which success might follow from negative
criticisms, there are very few empirical validations of
this belief Berger et al. (2010).
In this sense, it is surprising that one example, probably the
most clear empirical observation so far, is indeed offered by science.
It should be noticed that our analysis
does not include all the possible
ways of criticizing previously published
articles. Our approach is in fact limited only to the case
of explicit comments published in the same journal
of publication which published the original, criticized,
article, and therefore neglects possible cases of
“implicit” criticisms arising from the publication
of other regular articles. This clearly precludes the application
of the same type analysis to disciplines where the publication of
formal comments is not practiced.
Also, since comments and commented articles are published at
short time distance (Figures 3 and S2-10),
it is difficult to make claims about the causality
effect of a comment on the number
of citations accumulated by a commented paper.
The time gap is in fact too short to monitor eventual
differences in the trends of accumulation of citations before
and after the publication of a comment, and this
does not allow us to understand
whether highly cited papers attract comments
or instead comments generate citations.
Our intuitive interpretation is the following.
We think that the potentiality
of a paper to attract future citations increases
the chances that the paper gets commented.
Scientists are, in fact, able to early
recognize papers that are predestined to be highly
influential, and thus these papers are more likely to
be deeply examined and eventually commented.
We also think that important scientific
discoveries often
originate controversies, and the publication of
a comment is a way of initiating a dispute. This leads
to boosts of attention and consequently to higher rates of citation
accumulation.
Independently of the possible interpretation, our
results reveal a coherent pattern
for all the scientific disciplines
considered here. On the one hand, comments
can be viewed as negative labels for criticized
papers because comments are published
to criticize or correct other papers.
On the other hand, comments can be
also viewed as positive
labels for criticized papers because they
statistically represent early indicators of
the future impact
of criticized articles.
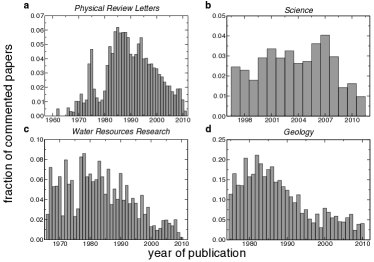
In all journals for which
we could monitor the publication of comments
over sufficiently long time windows, we realized that,
in the latest ten to fifteen years, the proportion
of commented articles has
significantly decreased (Figures 4 and S2-10).
It seems therefore that, in the process of
creation of scientific knowledge, scientists
are increasingly preferring to avoid
scientific “fights”.
There could be multiple reasonable explanations
for the observation of such decrement in the
rate of publication of comments, and,
here, we list only few of them. (i) Scientific teams
are increasingly dominating the process
of production of knowledge, and thus,
even if not mutually exclusive, collaboration
is overwhelming antagonism.
(ii) Writing a comment represents an investment of time
and effort as much as a normal article,
but has low benefit for the academic
curriculum of the authors of the comment
and can be potentially dangerous for the creation
of scientific “enemies”. (iii) The number of scientific papers
published today is too large. Thus, either scientists have
not enough time to read carefully all published documents
and eventually commenting on them, or the number of
central topics in science that deserve the birth
of a controversy is not growing at the same rate.
(iv) The process of peer-review has become so
precise and efficient that the percentage of published papers
potentially criticizable has decreased.
Clearly, a simple citation analysis, as the one performed here,
cannot provide an exact clue of the reasons for this
evident reduction. Our study just represents a
starting empirical observation from
which additional questions might arise, and further investigations
are required in order to understand more deeply such
phenomenon. Our analysis, however, provides already a
quantitative recommendation to both scientists
and journal editors to consider the
fundamental importance of an open scientific
discussion for the progress of
scientific knowledge. If a paper receives a comment,
this does not necessarily represent a negative event for the journal
which published the paper or for the scientists who wrote
the paper, but could be instead an early indication
of the importance of the paper itself. As we demonstrated in fact,
if citation numbers truly reflect the scientific impact
of a publication (although this statement is also under
debate MacRoberts and MacRoberts (1996, 1989); Bornmann and Daniel (2008); Adler et al. (2009)),
then for a paper it is better
being commented than not being commented.
Indeed, what Oscar Wilde wrote in the
Picture of Dorian Gray about gossip seems to be valid also
in science: “there is only one thing in the world worse
than being talked about, and that is not being talked about.”
References
- Kuhn (1957) T. S. Kuhn, The Copernican Revolution: Planetary Astronomy in the Development of Western Thought (Harvard University Press, Cambridge, MA, 1957).
- Vorzimmer (1972) P. J. Vorzimmer, Charles Darwin: the years of controversy: the Origin of Species and its critics 1859-82 (University of London Press, London, UK, 1972).
- Schilpp (1949) P. A. Schilpp, ed., Albert Einstein: Philosopher-Scientist (Cambridge University Press, Cambridge, MA, 1949).
- Jacoby (1981) W. R. Jacoby, Geology 9, 25 (1981).
- Klotz (1980) I. Klotz, Scientific American 242, 122 (1980).
- Lewenstein (1992) B. V. Lewenstein, Osiris 7, 135 (1992).
- Davenas et al. (1988) E. Davenas, F. Beauvais, J. Amara, M. Oberbaum, B. Robinzon, A. Miadonna, A. Tedeschi, B. Pomeranz, P. Fortner, and P. Belon, Nature 333, 816 (1988).
- Hirst et al. (1993) S. J. Hirst, N. A. Hayes, J. Burridge, F. L. Pearce, and J. C. Foreman, Nature 366, 525 (1993).
- Engelhardt and Caplan (1987) H. T. Engelhardt and A. L. Caplan, eds., Scientific Controversies Case Studies in the Resolution and Closure of Disputes in Science and Technology (Cambridge University Press, Cambridge, UK, 1987).
- Machamer et al. (2000) P. K. Machamer, M. Pera, and A. Baltas, eds., Scientific Controversies: Philosophical and Historical Perspectives (Oxford University Press, Oxford, UK, 2000).
- Newman (2004) M. E. J. Newman, Proceedings of the National Academy of Sciences of the United States of America 101, 5200 (2004).
- Guimerà et al. (2005) R. Guimerà, B. Uzzi, J. Spiro, and L. A. N. Amaral, Science 308, 697 (2005).
- Wuchty et al. (2007) S. Wuchty, B. F. Jones, and B. Uzzi, Science 316, 1036 (2007).
- Stringer et al. (2008) M. J. Stringer, M. Sales-Pardo, and L. A. N. Amaral, PLoS ONE 3, e1683 (2008).
- Radicchi et al. (2008) F. Radicchi, S. Fortunato, and C. Castellano, Proceedings of the National Academy of Sciences of the United States of America 105, 17268 (2008).
- Radicchi and Castellano (2012) F. Radicchi and C. Castellano, Journal of Informetrics 6, 121 (2012).
- Berger et al. (2010) J. Berger, A. T. Sorensen, and S. J. Rasmussen, Marketing Science 29, 815 (2010).
- MacRoberts and MacRoberts (1996) M. H. MacRoberts and B. R. MacRoberts, Scientometrics 36, 435 (1996).
- MacRoberts and MacRoberts (1989) M. H. MacRoberts and B. R. MacRoberts, Journal of the American Society for Information Science 40, 342 (1989).
- Bornmann and Daniel (2008) L. Bornmann and H.-D. Daniel, Journal of Documentation 64, 45 (2008).
- Adler et al. (2009) R. Adler, J. Ewing, and P. Taylor, Statistical Science 24, 1 (2009).
SUPPLEMENTARY INFORMATION
Data collection
Physical Review
For the publication period , we used the data set directly provided by the editorial office of the American Physical Society (APS, publish.aps.org/datasets). We identified potential comments as those publications which satisfy one of the following criteria:
-
1.
publications whose title starts with the word ”Comment” ;
-
2.
publications classified as ”comments” in the APS database, but with title not containing the words ”Reply” or ”Response”.
We then verified for each element in the list of potential comments whether or not they were effectively comments to previously published papers in journals of the Physical Review’s collection. We used two ways to determine this fact and also to associate real comments to commented papers:
-
1.
we parsed the web page of the potential comment, and searched for the associated commented article (the criticized article is referenced in this page as ”Original Article”);
-
2.
when the previous information was not present, we read the content of the potential comment and determined if the document was a real comment with an associated criticized paper.
For years and , we identified potential comments
as all documents with title starting with ”Comment on” (the search
was performed in the search engine
of the APS website). We then identified real comments
and associated commented articles in the same way as
the one described above.
In general, we found that comments were criticizing
papers published in the same journal. We found also
a small percentage of comments criticizing papers
published in other Physical Review journals.
Mainly comments to Physical Review Letters articles
published in the period in Physical Review A-D,
and comments to Physical Review A articles
published in the period in
Physical Review E (in Physical Review A
was split in Physical Review A
and in the newly created journal Physical Review E).
Science
We identified all comments as the elements published by
Science in the journal section ”Technical Comments”
(this list was retrieved at
www.sciencemag.org/cgi/collection/tech_comment
for publications since ,
and by reading the content of each issue
for the previous years). We were
able to consider only publications since
because the electronic journal
archive covers publications from
on (for previous years, publications are provided
only in pdf format). We associated each comment to
the criticized paper by parsing the web page of the
on-line version of the comment
and finding the associated document (the criticized paper is listed
after the sentence ”The editors suggest the following Related Resources on Science sites”).
When this information was not present,
we instead read the text of the comment.
Nature
For publication year and after, we identified all comments as the elements published in Nature as ”Brief Communications Arising” (such list was obtained by parsing the content of all issues of the journal at www.nature.com). For years to , comments have been instead identified (by reading the text of the publications) among those papers published in the section ”Brief Communications” . We were able to consider only publications since because the electronic journal archive covers publications from on (for previous years, publications are provided only in pdf format). We associated each comment to the criticized paper by parsing the web page of the on-line version of the comment and finding the associated document (the reference to criticized paper appears at the beginning of the comment after the sentence ”Arising from”). When this information was not present, we instead read the text of the comment.
New England Journal of Medicine
We identified as potential comments all the elements published by New England Journal of Medicine in the section ”Correspondence” (the entire publication list of the correspondence section can be retrieved with the search engine offered at www.nejm.org). We were able to consider only publications since because the electronic journal archive covers publications from on (for previous years, publications are provided only in pdf format). We automatically parsed the content of all potential comments, and identified true comments as those publications in which we identified a string of the format ”(month day issue) reference”. The information contained in this string was also used to identify the criticized papers.
Journal of Chemical Physics
We identified all comments as those publication with title of the format ”Comment on {title of the commented paper} [J. Chem. Phys. vol., page (year)]”. We limited our attention only to publications after because in previous years we were not able to detect a regular publication rate of comments. The reference to the criticized papers was obtained by parsing the titles of the comments. Data have been collected from the journal web site (jcp.aip.org).
Geology
We identified all comments as those publications with titles in the format ”Comment on {title of the commented article}” or ”title of the commented article - Comment”. Criticized articles where automatically detected by matching their titles with those appearing in the titles of the comments. Data have been collected from the journal web site (geology.gsapubs.org).
Environmental Science & Technology and Water Resources Research
We identified all comments as those publications with titles in the format ”Comment on {title of the commented article}” or ”title of the commented article - Comment”. Criticized articles where automatically detected by matching their titles with those appearing in the titles of the comments. Data in this case have been retrieved from the Web of Science database.
| Journal | Period of observation | |||||
|---|---|---|---|---|---|---|
| Environ. Sci. & Technol. | ||||||
| Geology | ||||||
| J. Chem. Phys. | ||||||
| Nature | ||||||
| New Engl. J. Med. | ||||||
| Phys. Rev. A | ||||||
| Phys. Rev. B | ||||||
| Phys. Rev. C | ||||||
| Phys. Rev. D | ||||||
| Phys. Rev. E | ||||||
| Phys. Rev. Lett. | ||||||
| Science | ||||||
| Water Resour. Res. |
| rank | citations | reference | commented in |
|---|---|---|---|
| Phys. Rev. Lett. 77, 3865 (1996) | 80, 890 (1998) | ||
| Phys. Rev. Lett. 56, 930 (1986) | 57, 3235 (1986) | ||
| Phys. Rev. Lett. 55, 2471 (1985) | 56, 2656 (1986) | ||
| Phys. Rev. Lett. 85, 3966 (2000) | 87, 249701 (2001) & 87, 249703 (2001) | ||
| Phys. Rev. Lett. 59, 381 (1987) | 62, 110 (1989) | ||
| Science 286, 509 (1999) | 287, 2115 (2000) | ||
| Science 280, 69 (1998) | 281, 883 (1998) | ||
| Science 290, 2319 (2000) | 295, 7 (2002) | ||
| Science 282, 1318 (1998) | 287, 1363 (2000) | ||
| Science 299, 1719 (2003) | 307, 1203 (2005) | ||
| Water Resour. Res. 16, 574 (1980) | 17, 768 (1981) | ||
| Water Resour. Res. 14, 601 (1978) | 15, 989 (1979) | ||
| Water Resour. Res. 19, 161 (1983) | 19, 1641 (1983) | ||
| Water Resour. Res. 22, 2069 (1986) | 24, 315 (1988) & 24, 892 (1988) & 24, 1209 (1988) | ||
| Water Resour. Res. 11, 725 (1975) | 13, 477 (1977) | ||
| Geology 19, 598 (1991) | 20, 191 (1992) | ||
| Geology 19, 547 (1991) | 20, 475 (1992) | ||
| Geology 10, 70 (1982) | 11, 428 (1993) | ||
| Geology 19, 425 (1991) | 20, 87 (1993) | ||
| Geology 14, 99 (1986) | 14, 1042 (1986) |
| rank | citations | reference | commented in |
|---|---|---|---|
| Phys. Rev. A 29, 2765 (1984) | 32, 3135 (1985) | ||
| Phys. Rev. A 39, 1665 (1989) | 43, 2576 (1991) | ||
| Phys. Rev. A 16, 531 (1977) | 26, 3008 (1982) | ||
| Phys. Rev. A 41, 2295 (1990) | 43, 5165 (1991) | ||
| Phys. Rev. A 26, 2028 (1982) | 36, 5463 (1987) | ||
| Phys. Rev. B 13, 5188 (1976) | 18, 5897 (1978) | ||
| Phys. Rev. B 26, 4199 (1982) | 37, 4795 (1988) | ||
| Phys. Rev. B 12, 2455 (1975) | 16, 4719 (1977) | ||
| Phys. Rev. B 4, 3184 (1971) | 6, 311 (1972) & 6, 3546 (1972) | ||
| Phys. Rev. B 20, 624 (1979) | 22, 1095 (1980) | ||
| Phys. Rev. C 13, 1226 (1976) | 16, 885 (1977) | ||
| Phys. Rev. C 35, 1678 (1987) | 37, 892 (1988) | ||
| Phys. Rev. C 1, 769 (1970) | 5, 1135 (1972) | ||
| Phys. Rev. C 15, 1359 (1977) | 18, 573 (1978) | ||
| Phys. Rev. C 9, 1018 (1974) | 12, 686 (1975) | ||
| Phys. Rev. D 10, 2445 (1974) | 12, 3343 (1975) | ||
| Phys. Rev. D 2, 1285 (1970) | 3, 1043 (1971) & 4, 1918 (1971) | ||
| Phys. Rev. D 7, 1888 (1973) | 9, 1129 (1974) & 11, 2332 (1975) & 11, 3040 (1975) | ||
| Phys. Rev. D 9, 3471 (1974) | 12, 923 (1975) & 12, 4006 (1975) | ||
| Phys. Rev. D 14, 870 (1976) | 18, 609 (1978) | ||
| Phys. Rev. E 68, 011306 (2003) | 70, 043301 (2004) | ||
| Phys. Rev. E 48, R29 (1993) | 51, 2669 (1995) | ||
| Phys. Rev. E 54, 3853 (1996) | 60, 1099 (1999) | ||
| Phys. Rev. E 65, 041903 (1974) | 67, 063901 (2003) & 72, 063901 (2005) | ||
| Phys. Rev. E 50, 2064 (1994) | 53, 2992 (1996) |
| rank | citations | reference | commented in |
|---|---|---|---|
| Environ. Sci. Technol. 36, 1202 (2002) | 36, 4003 (2002) & 36, 4005 (2002) & 37, 1052 (2003) | ||
| Environ. Sci. Technol. 32, 1549 (1998) | 33, 369 (1998) | ||
| Environ. Sci. Technol. 30, 2432 (1996) | 31, 1577 (1997) | ||
| Environ. Sci. Technol. 27, 961 (1993) | 28, 366 (1994) & 28, 367 (1994) | ||
| Environ. Sci. Technol. 30, 881 (1996) | 30, 3132 (1996) | ||
| New Engl. J. Med. 329, 977 (1993) | 329, 1661 (1993) & 3 comm. in 330, 641 (1994) | ||
| New Engl. J. Med. 333, 1301 (1995) | 3 comm. in 334, 1333 (1996) | ||
| New Engl. J. Med. 338, 853 (1998) | 339, 405 (1998) | ||
| New Engl. J. Med. 346, 393 (2002) | 4 comm. in 346, 1829 (2002) | ||
| New Engl. J. Med. 342, 145 (2000) | 4 comm. in 343, 64 (2000) | ||
| J. Chem. Phys. 114, 5149 (2001) | 116, 11039 (2002) | ||
| J. Chem. Phys. 123, 164110 (2005) | 124, 107101 (2006) | ||
| J. Chem. Phys. 119, 12784 (2003) | 121, 3347 (2004) | ||
| J. Chem. Phys. 119, 2376 (2003) | 120, 9427 (2004) | ||
| J. Chem. Phys. 122, 204302 (2005) | 125, 047101 (2006) | ||
| Nature 401, 82 (1999) | 406, 367 (2000) | ||
| Nature 434, 214 (2005) | 437, E3 (2005) & 437, E3 (2005) | ||
| Nature 427, 145 (2004) | 3 comm. in 430 issue of 1st July, 2004 | ||
| Nature 425, 944 (2003) | in 429 issue of 13th May, 2004 | ||
| Nature 423, 280 (2003) | 434, E1 (2005) |