Variable Radio Sources in the Galactic Plane
Abstract
Using three epochs of VLA observations of the Galactic Plane in the first quadrant taken years apart, we have conducted a search for a population of variable Galactic radio emitters in the flux density range 1–100 mJy at 6 cm. We find 39 variable sources in a total survey area of 23.2 deg2. Correcting for various selection effects and for the extragalactic variable population of active galactic nuclei, we conclude there are Galactic sources deg-2 which vary by more than 50% on a time scale of years (or shorter). We show that these sources are much more highly variable than extragalactic objects; more than 50% show variability by a factor compared to for extragalactic objects in the same flux density range. We also show that the fraction of variable sources increases toward the Galactic center (another indication that this is a Galactic population), and that the spectral indices of many of these sources are flat or inverted. A small number of the variables are coincident with mid-IR sources and two are coincident with X-ray emitters, but most have no known counterparts at other wavelengths. Intriguingly, one lies at the center of a supernova remnant, while another appears to be a very compact planetary nebula; several are likely to represent activity associated with star formation regions. We discuss the possible source classes which could contribute to the variable cohort and followup observations which could clarify the nature of these sources.
Subject headings:
surveys — catalogs — Galaxy: general — radio continuum: ISM — supernova remnants — H II regions1. Introduction
Variable radio emission is a hallmark of energetic objects such as coronally active stars, supernovae, neutron stars, black holes, and active galactic nuclei (AGN). Indeed, radio variability is often indicative of high-energy processes and, in principle, can be valuable for finding examples of relatively rare objects. However, surveys for variability are themselves quite rare — blind sky surveys are almost never repeated owing to the scarcity of telescope time. The exceptions are mostly in the optical regime. Comparisons between POSS1, POSS2, and SDSS have been useful for studying variability (de Vries et al. 2005). Gravitational microlensing studies (e.g., Alcock et al. 1997) and supernova searches (e.g., Astier et al. 2006, Miknaitis et al. 2007) have produced a wealth of data on optical variability from targeted sky regions, and several upcoming experiments such as Pan-STARRS (Kaiser et al. 2002), the Palomar Transit Factory (Rau et al. 2009), and LSST (Tyson 2002) will make the coming decade one in which time-domain astronomy plays a prominent role.
Variability studies in the radio band have typically targeted bright extragalactic sources (see de Vries et al. 2004 for a review of searches for, and mechanisms of, radio variability). Comparisons between blind radio surveys are often hampered by differences in angular resolution and the confusing presence of interferometric sidelobe patterns. For example, there has been no systematic search for radio variability between the two largest radio sky surveys, FIRST (Becker et al. 1995) and NVSS (Condon et al. 1998). The FIRST survey did observe one area twice at 1400 MHz, an equatorial strip degrees wide in the range . A search for variable sources in this area was reported in de Vries et al. (2004). The search covered deg2 of extragalactic sky with a sensitivity similar to the Galactic plane search reported here; it thus serves as a useful control from which to estimate how many of the sources we find are background extragalactic radio sources.
The most systematic search for radio variablity in the Galactic plane used the NRAO 91-m telescope in Greenbank, WV, operating at a frequency of 5 GHz (Gregory & Taylor 1986). Over a five-year period the plane was observed 16 times, leading to the detection of 32 variable radio sources. The survey had a flux density threshold of mJy and an angular resolution of 3′. Using the Very Large Array111The Very Large Array is an instrument of the National Radio Astronomy Observatory, a facility of the National Science Foundation operated under cooperative agreement by Associated Universities, Inc. (VLA), the Galactic plane has been surveyed at this same frequency but with much higher sensitivity and angular resolution, although with minimal repetition (Becker et al. 1994).
Recently, a new Galactic plane survey at 6 cm (4.86 GHz) has begun at the VLA. The new survey (CORNISH222The Co-Ordinated Radio ’N’ Infrared Survey for High-mass star formation; see http://www.ast.leeds.ac.uk/Cornish; Purcell et al. 2008) has substantial overlap with our previous survey; both surveys have a flux density threshold of mJy. Comparison between these two data sets allows for a search for Galactic radio sources that exhibit variability over the fifteen-year interval between the surveys. The search is complicated because the two surveys use different VLA configurations and hence have different angular resolutions (5″ versus 1.5″). Nonetheless, it is possible to identify strongly varying sources. In this paper we will compare results between the original survey and two epochs of data from the new survey. In section 2 we discuss the parameters of the two surveys, while in section 3 we present the results from a comparison of the two samples and adduce evidence for variability. We describe the properties of the variable sources including their spatial distribution, spectral indices, and counterparts at other wavelengths (§4) and end with a discussion of our limited knowledge of the nature of these objects (§5).
2. The 6 cm Surveys
The original VLA 6 cm Galactic plane survey was carried out between 1989 and 1991 in the C and BnC configurations (Becker et al. 1994). It covered a longitude range within of the plane for a total of 43 deg2. The data were re-reduced in 2005 using much improved data processing algorithms and some additional data (White et al. 2005). The new catalog reaches a flux density limit of mJy and contains over 2700 radio sources. Since the data were taken in C and BnC configurations, the angular resolution is .
The new CORNISH survey (Purcell et al. 2008) is meant to complement the Spitzer GLIMPSE Legacy program (Benjamin et al. 2003). When completed, it will cover a longitude range within of the plane. The data are being taken in the B configuration and hence will have an angular resolution of . The new survey will also achieve a flux density sensitivity of mJy. The ultimate areal coverage will be 110 deg2. A pilot study of 10 deg2 near was carried out in the spring of 2005. The first 64 deg2 of the full survey (including repeated observations of the pilot area) was observed in summer 2006. We retrieved these data from the VLA archive and reduced them using the AIPS procedures we developed for the FIRST survey (White et al. 1997). Our source detection algorithm HAPPY was run on the final co-added images.
We henceforth refer to the three epochs as I (1990), II (2005) and III (2006). Note that while the epoch II and III data were taken over short periods of time (spanning about 2 months in each case), the epoch I data were taken over a much greater time period (hence our choice of the label “1990”). For the overlapping area used for this paper, 70% of the epoch I observations were taken between June 1989 and December 1990, and 30% were taken between February and April of 2004. Consequently the time span between epoch I and the later two epochs varies by a large factor depending on the source location. We will report the mean observational epoch of the flux density measurements for individual objects in the following discussion.
For this paper we restrict our attention to sources in sky regions with coverage at two or three epochs. Table 1 describes the areas of overlap between the various epochs and the number of sources from each catalog included in those areas. To ensure source reliability, we restrict our sample to sources that are strongly detected () in one of the epochs or that are confirmed by detections at multiple epochs. We also check for detections at 20 cm, either from our MAGPIS survey (Helfand et al. 2006) or in the catalog of White et al. (2005); a 20 cm detection is required as confirmation for sources detected in only one 6 cm epoch.
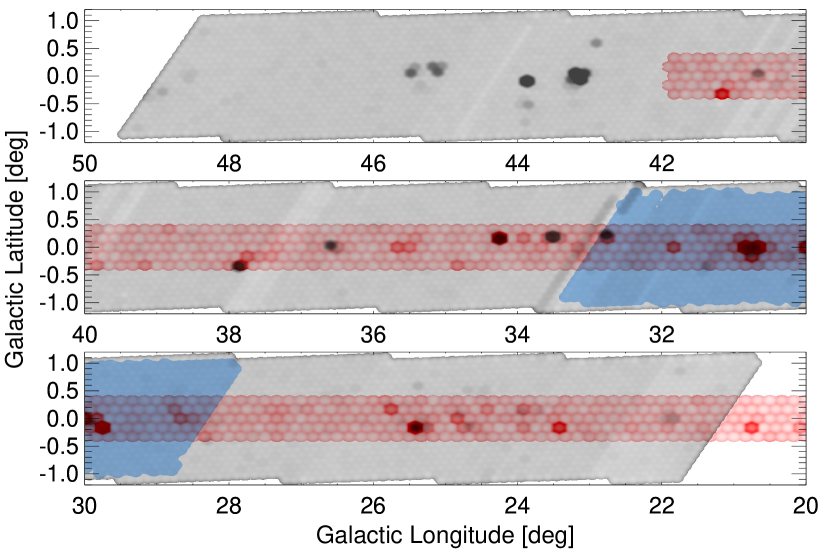
In Figure 1 we show the sky coverage for the three epochs in the vicinity of the overlap region. Note that the 2005 pilot area is entirely covered by the 2006 data, so all of the sky area covered by 1990 and 2005 observations also has 2006 observations.
| Epochs | Area Covered | Number of Sources | ||
|---|---|---|---|---|
| (deg2) | 1990 | 2005 | 2006 | |
| (1) | (2) | (3) | (4) | (5) |
| 1990, 2006 | 13.4 | 541 | 347 | |
| 2005, 2006 | 5.9 | 144 | 142 | |
| 1990, 2005, 2006 | 3.9 | 161 | 168 | 133 |
The other significant difference between the two surveys is their angular resolution. For unresolved radio sources, the flux densities from the two surveys are directly comparable; the difficulty comes in knowing which sources are true point sources. For sources that are partially resolved by the new survey, the flux density will be lower than that measured a decade and a half ago, even in the absence of variability. Hence, partially resolved sources will give a false-positive variability signal. By the same token, however, any source significantly brighter in the newer survey is almost certainly variable. All images from both surveys can be found at the MAGPIS website (http://third.ucllnl.org/gps).
3. Search for Variability
A match among the three 6 cm data sets resulted in 503 distinct sources detected at two or more epochs. To ensure reliability, we restrict our sample to sources that are detected in at least two 6 cm epochs or that have confirming detections at 20 cm. Sources detected only in a single 6 cm epoch and not at 20 cm are excluded. Sources are considered a match if their positions agree to within 1.5″ for the epoch II and III catalogs or to within 5″ between the epoch I and later-epoch catalogs. These relatively large match radii are chosen to include extended sources, which can have larger positional offsets. For the higher resolution epoch II and III data, the median position difference is 0.2″, and 80% of the sources have positions that agree to within 0.4″. For comparisons between the low-resolution epoch I data and the more recent observations, the median separation is 0.7″, and 80% of the sources have positions that differ by 1.6″ or less. To avoid potential confusion, we have removed from the match list sources that have ambiguous matches owing to multiple components within the matching radius.
A comparison of the flux densities determined from the old and new data is plotted in Figure 2; sources that fall along the diagonal have comparable flux densities from the two measurements. There is a clear bias for sources to be weaker in the newer observations, a direct consequence of the higher angular resolution, which results in slightly extended sources having some of their flux resolved out in the newer data. Certainly some of these sources could be variable, but it is difficult to distinguish between a decrease due to variability and a decrease due to resolution effects. Happily, the reverse is not true; sources that brighten between the two epochs are likely to be truly variable.
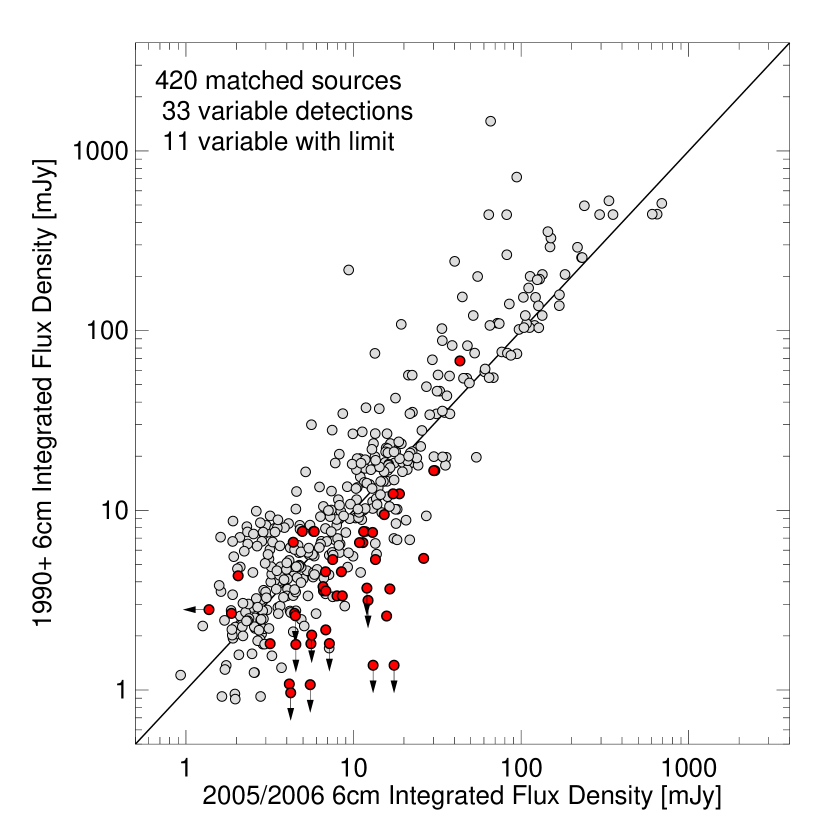
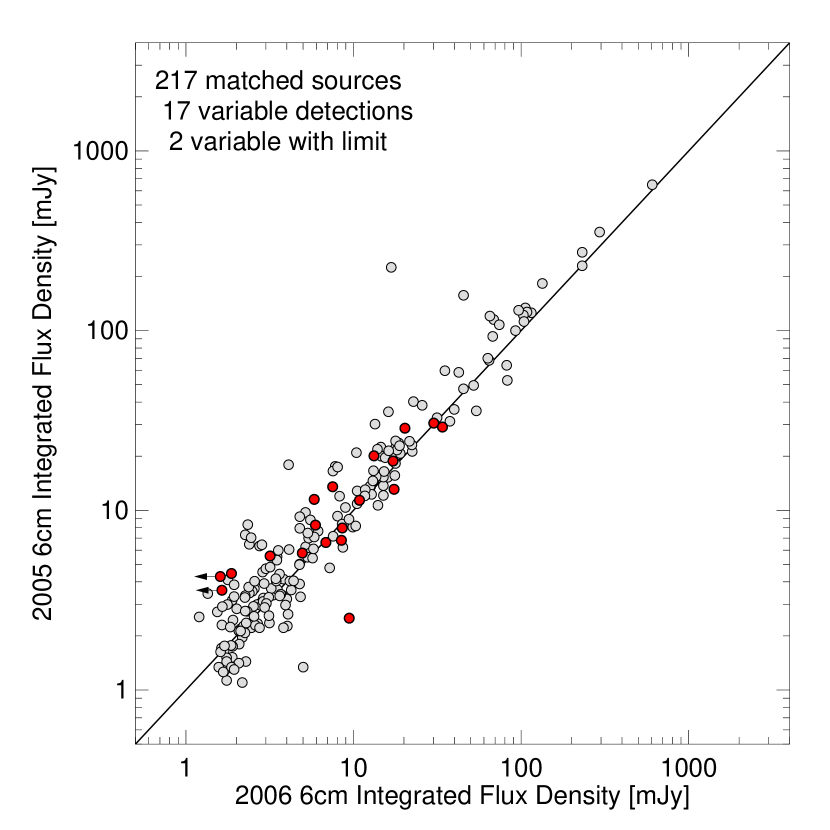
Figure 3 displays a comparison of the flux densities measured in the two high-resolution epochs (II and III). The area of overlap is smaller (5.9 deg2 versus 17.3 deg2 for Fig. 2), but it is clear that the scatter is considerably reduced. This is expected because the observations are taken in the same VLA configuration and so have the same resolution. (The shorter time baseline for variability also presumably contributes slightly to the reduced scatter.)
The sources falling in a region covered by at least two of the three catalogs yielded a list of potential variable sources using a variability threshold333The difference in the peak flux densities was required to be greater than if the source was detected at both epochs; if the object was detected at only one epoch, the flux density at the undetected epoch was conservatively taken to be twice the rms value at that epoch.. A visual inspection of the pairs of images led us to reject many as suspect owing either to source confusion or to clear angular extent in the higher resolution observations. There remained 39 sources regarded as having a high likelihood of being true radio variables (Table 2). We were cautious about including sources that were brigher in epoch I due to the resolution difference discussed above. Only 5 of the candidates rely on a bright epoch I measurement to establish variability; the other 34 either are brighter in the high-resolution data or show variability between epochs II and III. We have retained the five sources that fade from their epoch I flux measurements because they appear to be point-like in all epochs at both 6 cm and 20 cm, but we cannot categorically exclude a small source extent being responsible for the lower flux density observed in the more recent data. The variability significance in column 16 of Table 2 is shown in bold italic type for these less reliable sources.
In examining candidate variables, we were alert to the possibility of calibration errors or bad data causing systematic flux density differences. Consequently we looked carefully at the close pair of sources, G37.73470.1126 and G37.75960.1001, both of which were undetected in epoch I and were bright ( mJy) in epoch III. To confirm the reality of these sources, we examined the individual grid images that contributed to the coadded images for each source. The grid images confirmed the variation: in epoch I each source would have been detected at more than significance in two different grid images if the source was as bright as in epoch III, but neither showed any evidence for emission. And in epoch III the sources were detected in two or more independent observations at flux densities consistent with the coadded image detection.
Of the five single-epoch detections in the list, one appears only in epoch I (and so is one of the less reliable sources), one appears only in epoch II, and three appear only in epoch III. Note that single-epoch sources both must be relatively bright in the detected epoch for the variability to be considered and also must have confirming detections at 20 cm. In fact, all of the multi-epoch sources are also detected at 20 cm; we use the spectral indices derived from the 6 and 20 cm flux densities below, although caution is warranted since the 20 cm and 6 cm observations are not contemporaneous, so the variability for which we are selecting will also affect the spectral index estimates. In fact, roughly half of the MAGPIS 20 cm flux densities are inconsistent with our original compact source survey at this wavelength undertaken in the 1980s (see catalogs in White et al. 2005), underscoring the case for variability. The degree of variability at 6 cm ranges from 20% to a factor of 18. The flux density distribution ranges from to 65 mJy with a median of mJy in the second-epoch data.
4. Characteristics of the Variable Sources
Only a few papers have reported variability results for centimetric radio sources from extragalactic surveys on time scales of years and with sensitivities in the mJy range. Bower et al. (2007) examined archival VLA data from a frequently observed calibration field (944 observations over 22 years) to search for transient radio sources at 6 cm to a flux density limit of 370 Jy; a transient source was defined as one that only appeared at a single epoch (or over a short range of contiguous epochs months in length). They measured a two-epoch rate of transients per square degree, and estimated that the number of transients scales with flux density as . Our faintest variable source has a 6 cm flux density of 2.8 mJy (at the brighter epoch; fainter objects would not have passed the variability threshold). Thus, we should expect true extragalactic transient in our survey area of 23.2 deg2 (the total pair-wise area covered – see Table 1). While there are five sources detected at one epoch only in our sample, all four are detected independently at 20 cm (at one or more different epochs), and thus cannot be considered true transients. The detection of zero transients when one is expected is construed as consistent with the results of Bower et al. (2007) while setting a weak limit on the number of Galactic transient sources.
Examining data collected for a deep survey of the Lockman Hole spaced at intervals of 19 days and 17 months, Carilli et al. (2003) concluded that only 2% of sources between 50 and 100 Jy at 1.4 GHz are highly variable (%). These observations did, however, yield nine variable objects in the flux density range 1 to 25 mJy in a field with a FWHM 32′; only one of these sources varied by more than 50%.
The survey by de Vries et al. (2004) mentioned in the introduction (§1) offers the best comparison sample against which to assess the fraction of our variable sources likely to be extragalactic. They find 123 sources variable at significance in 120.2 deg2 of high-latitude sky, or roughly 1 variable source per square degree. The median flux density of the extragalactic sample is 13.5 mJy at cm. As noted above, we have 20 cm flux densities (albeit non-contemporaneous ones) for all members of our sample; the median flux density is 12.9 mJy, very similar to that of the de Vries sample.
| Fractional | de Vries | This Paper | Predicted | Galactic |
|---|---|---|---|---|
| Variability | Counts | Counts | Extragalactic | Excess |
| (1) | (2) | (3) | (4) | (5) |
| 1.25 | 51 | 1 | 7.4 | |
| 1.25 – 1.50 | 39 | 5 | 5.7 | 0.0 |
| 1.50 – 1.75 | 19 | 5 | 2.8 | 2.2 |
| 1.75 – 2.00 | 4 | 4 | 0.6 | 3.4 |
| 2.00 – 2.25 | 4 | 2 | 0.6 | 1.4 |
| 2.25 – 2.50 | 2 | 3 | 0.3 | 2.7 |
| 2.50 – 2.75 | 1 | 2 | 0.1 | 1.9 |
| 2.75 – 3.00 | 1 | 0 | 0.1 | 0.0 |
| 3.0 | 2 | 17 | 0.3 | 16.7 |
| Total | 123 | 39 | 17.9 | 28 |
Note. — Col. (1): Ratio of brightest to faintest flux density measurements. Col. (2): Variable source counts from de Vries et al. (2004). Col. (3): Variable source counts from this paper. Col. (4): de Vries counts scaled to match area covered in this paper. Col. (5): Net excess of variables in this paper compared with de Vries counts.
However, an examination of the fractional variability of the two samples (defined as , the highest flux density recorded over the lowest) reveals drastic differences. Table 3 displays the distribution of fractional flux density variation for the de Vries extragalactic sample and for our Galactic plane catalog of variables. A total of % of the extragalactic sample has a fractional variability of while only 6 of the 39 Galactic variable (15%) vary this little. At the other end of the distribution, only 2/123 extragalactic objects vary by as much as a factor of 3, while fully 17/39 (44%) of the Galactic plane sources are this variable.
We can use the de Vries sample to estimate the number of extragalactic variables present in our survey area. The ratio of areas is 23.2 deg2/120.2 deg2 or 0.193. We cannot simply scale by area, however, because of the resolution bias, discussed above, that discriminates against sources which faded between epoch I and epochs II and III. Of the 30 sources whose variability was established on the basis of a change between epoch I and a later epoch, five sources faded and 25 sources brightened in the later epochs. Since the distribution should be inherently symmetrical, we can assume we eliminated roughly 20 fading sources to protect against resolution effects. Thus, the total number of true variables is reduced by 20/50 or 40%; note that this correction factor applies only to the area in which 1990 data is compared to later data (19.3 deg2). The effective sky area covered by our survey when this inefficiency is taken into account is , and the expected number of extragalactic variables is therefore .
If we distribute these 18 sources with the fractional variability of the extragalactic sample (column 4 of Table 3), we expect at , 3 with , and to vary by more than a factor of 2. The distribution for Galactic variables is 6 at , 9 with , and 24 varying by more than a factor of two. Our Galactic sample includes few sources that vary by less than because the complexity of radio emission in the Galactic plane combined with differences in the VLA configuration required a higher threshold for confident detection of variability; that is the reason for our use of a threshold rather than the threshold adopted by de Vries et al. Ignoring this lowest bin as below our survey sensitivity, the de Vries catalog has 72 variable sources, yielding an expectation of sources in our area. Subtracting these numbers from our catalog suggests that while many of the sources at are extragalactic, only of the 33 sources with greater variability are background objects. Scaling by the effective area derived above, we find a surface density of Galactic variable sources of 1.6 deg-2, nearly six times the 0.3 deg-2 density of extragalactic sources that vary by more on time scales of years.
A complicating factor in this comparison is that the de Vries variables were selected at 20 cm rather than 6 cm wavelength. The most variable AGN have beamed nuclear radio emission that usually has a flatter spectral index than the non-variable extended radio emission. Consequently at a shorter wavelength, the beamed emission will be more dominant, which will increase the apparent amplitude of variability. Without a good extragalactic comparison sample at 6 cm, it is difficult to determine exactly how large this effect will be. But we consider it very unlikely that the changes resulting from the wavelength difference could explain the large differences seen between the extragalactic and Galactic samples in the frequency of large-amplitude variables.
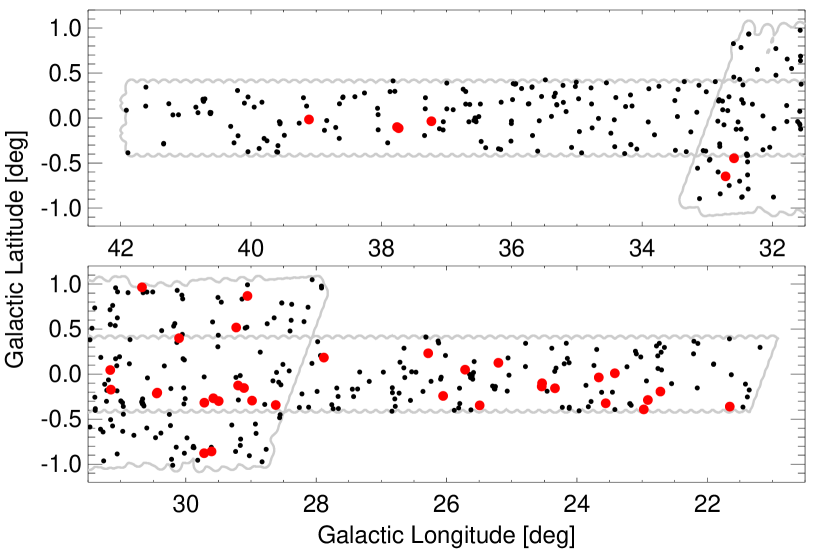
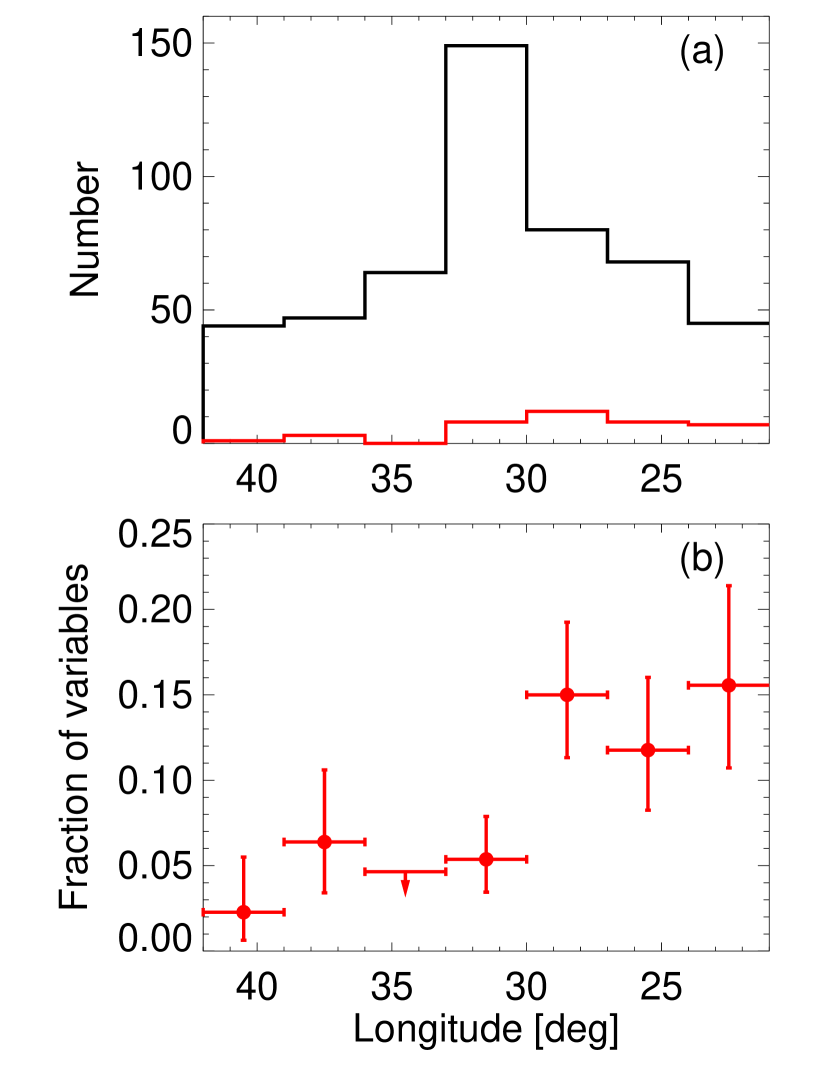
The spatial distribution of the sources in our catalog strongly supports the view that they are dominated by a Galactic population. In Figure 4 we compare the distribution of variable sources with a parent population consisting of point-like sources (defined by an integrated flux density less than 25% larger than the peak flux density) that either are detected at multiple 6 cm epochs or that are strong single-epoch detections (). Such sources could have been detected as variables. The latitude distribution shows a bias toward negative latitudes, consistent with earlier studies that show that lies above the Galactic plane in the first quadrant. In Figure 5, we display the longitude distribution for all sources (which is distorted by differential coverage) and for the variable sources. The fraction of variables, displayed in the lower panel, shows a clear rise toward the Galactic center.
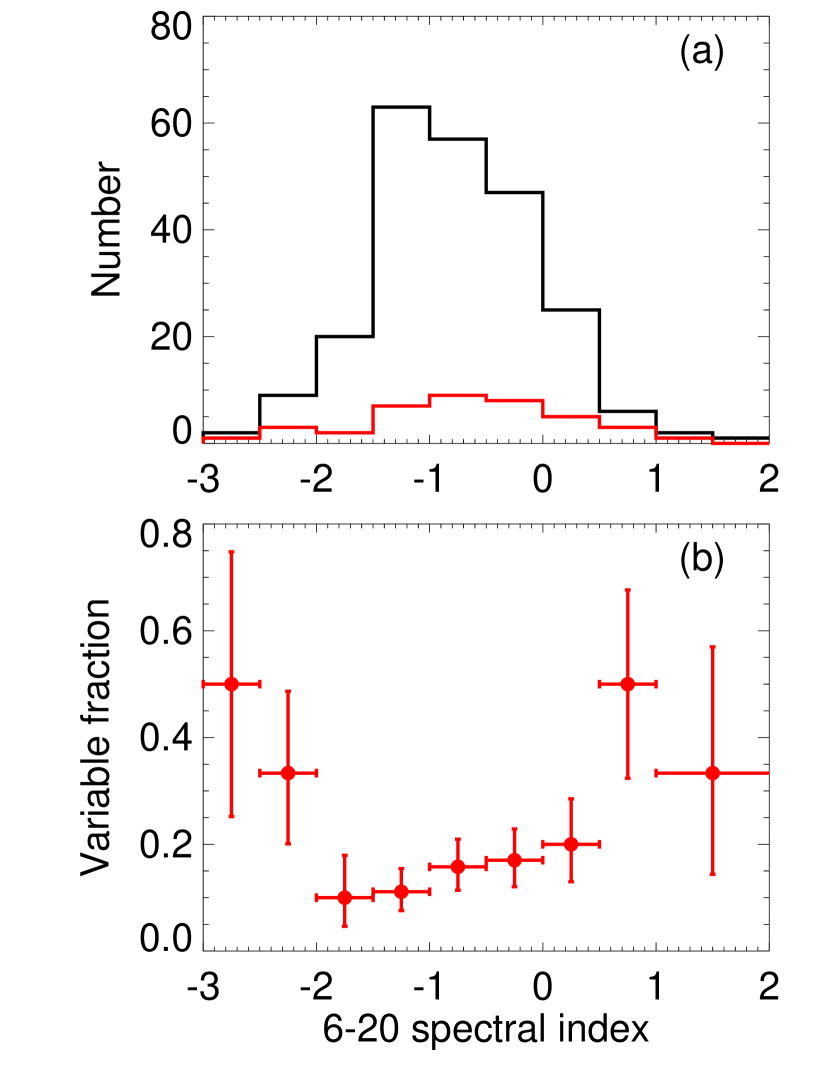
The spectral index distribution (Figure 6) also suggests that the variable sources represent a distinct population. There is a trend toward greater variability as the radio spectrum becomes flatter (increasing spectral index). For any individual source, the spectral index calculated between our 6 cm and 20 cm catalogs is unreliable, as the measurements were 1) obtained with different spatial resolutions, and 2) far from contemporaneous. Since the 20 cm observations have lower resolution, they detect more flux in extended sources and so tend to produce spectral indices that are too steep. On the other hand, the observed variability in the 6 cm flux density tends to bias the index toward flatter values, since sources that brighten at 6 cm are more likely to be recognized as variable. To compensate partially for the latter effect, the spectral index in Figure 6 is computed using the smallest 6 cm flux measured at any of the three epochs. That may also be responsible for the variable sources with very steep spectral indices (), which may have been in a bright phase when measured at 20 cm.
The interpretation of the spectral index distribution is therefore not straightforward. The apparent increase in variability for flatter spectrum sources could result from either a Galactic population (optically thin or thick thermal emission) or an extragalactic population (beamed emission from AGN/blazars).
Another line of evidence that many of the variable sources are Galactic derives from their counterparts at other wavelengths. We examined images from the Spitzer GLIMPSE survey (3.6, 4.5, 5.8 and 8.0m; Benjamin et al. 2003), the Spitzer MIPSGAL 24m survey (Carey et al. 2009), and the 1.1 mm Bolocam Galactic Plane Survey (BGPS; Aguirre et al. 2009). Of the 39 variable sources, 7 are MIPSGAL sources, with 6 of those also found to be GLIMPSE sources, and 4 are detected in the BGPS millimeter observations; all are described in greater detail below. None of the counterparts are expected to be the result of chance coincidences, implying that all of these objects must be in the Galaxy. Infrared/mm counterparts are significantly more common among the variable sources than among the non-variable 6 cm sources. We examined a sample of 40 non-variable radio sources, selected as unresolved sources detected in at least 2 epochs with 6 cm flux densities that are consistent within at all epochs. Only 2 of the non-variable objects were found to have MIPSGAL counterparts, and none had BGPS matches. We conclude that the existence of these counterparts is related to the nature of the variable sources.
5. Discussion
5.1. Source Identification – What They Are Not
Having established the existence of a population of highly variable Galactic sources, the obvious question is, What are they? Three classes of Galactic variable radio emitters can be easily eliminated from consideration: coronally active radio-emitting stars, pulsars, and masers. We justify our exclusion of these source classes in turn.
In a survey of 122 RS CVn and related active binary systems which are among the most luminous stellar radio sources, Drake et al. (1989) found only 18 detected above a quiescent flux density of 1 mJy at 6 cm; the faintest optical counterpart was . Even assuming an extreme flare of a factor of 100 (Osten 2008), the faintest possible counterpart would have ; none of our variables has a counterpart this bright. As for dMe flare stars, the other main class of variable stellar radio emitters, the most luminous quiescent emission is erg s-1 Hz-1 (Gudel et al. 1993) corresponding to a flux density of mJy at a distance of 13 pc. Even an extreme flare with an increase of a factor of 500 over the quiescent level (Osten 2008 and references therein) would fall below our flux density threshold for a distance pc. Stars with spectral types later than M6 would have counterparts fainter than 20th magnitude and could be represented in our sample. However, statistically, M-stars cannot be a significant contributor; Helfand et al. (1999) found only M stars in 5000 deg2 of the FIRST survey to a flux density limit of 0.7 mJy, whereas our variables have a surface density of 1.6 deg-2.
While nearby radio pulsars scintillate strongly in the ISM leading to large-amplitude variability, pulsars have very steep radio spectra, and most have not been detected at 6 cm (none of our objects are coincident with one of the 1827 known pulsars; Manchester et al. 2005). For a typical spectral index of , our weakest source would be a mJy pulsar at 400 MHz, and most unlikely to have been missed in pulsar surveys. The small duty cycle of the recently discovered RRATs (Rotating RAdio Transients – McLaughlin et al. 2006) makes them equally unlikely to explain our variable sources.
Finally, radio masers are known to be highly variable, but no known maser transitions fall within our bandpass. As noted below, however, three of our variables are coincident with methanol masers.
Two classes of extragalactic radio transients — supernovae and GRB afterglows — are also highly improbable counterparts for our events. Both have rise times of at most tens of days and cannot, in the absence of a steady underlying source of radio emission, account for the bulk of our sources which show a flux density increase over many years. In addition, their rarity makes them statistically unlikely counterparts. The one extragalactic population that does show variability on the time scales we probe, AGN, are shown above to have variability amplitudes which exclude them from explaining all but a handful of our events.
The remaining known classes of variable radio sources include microquasars (accreting, high-mass X-ray binaries that produce relativistic jets: e.g., SS433, Cyg X-3 and GRS 1915105), radio magnetars (Camilo et al. 2006; Camilo et al. 2007), and the recently described Galactic Center Transient sources (Hyman et al. 2009 and references therein). The first two of these have signatures at other wavelengths; we explore below the fragmentary data outside the radio band that is available for our variable objects.
5.2. Source Identification – Multiwavelength Data
Counterparts at other wavelengths can be useful in suggesting the origin of radio variability. At our MAGPIS website (Helfand et al. 2006), we have collected the following Galactic plane data in addition to the three-epoch 6 cm data described herein: two epochs of 20 cm observations for these same fields including the principal MAGPIS survey, 90 cm observations of the same regions, the 3.6, 4.5, 5.8, and 8.0 m data from the Spitzer GLIMPSE survey (Benjamin et al. 2003), 24 m images from MIPSGAL (Carey et al. 2009), 20 m data from the MSX survey (Price et al. 2001) and the 1.1 mm Bolocam Galactic plane survey (Aguirre et al. 2009). In addition, we have queried the SIMBAD database for each of our sources and have examined the Digitized Sky Survey images; in one case, we have obtained optical observations of a source. We report the results of this multi-wavelength inquiry here.
5.2.1 Mid-IR and mm observations
Seven of our variables are detected at 24 m in the MIPSGAL survey, and six of these are also detected in at least one GLIMPSE mid-IR band. Four of the objects are also detected at 1.1 mm in the Bolocam survey. In all seven cases at least two bands are available, and in all seven cases the sources are red; i.e., they are faintest in the short-wavelength bands and brightest in the long-wavelength bands. In two cases (G31.15950.0449 and G37.73470.1126) multiple components with different IR spectral shapes are present, with the radio source identified with the brighter component in the first case, and the redder component in the second. Three of the IR-detected objects have associated methanol masers; this, coupled with their IR spectra demonstrate they represent activity associated with star formation in compact or ultracompact H II regions.
For one IR-detected source, G29.57790.2685, we have obtained followup observations at the MDM Observatory (J. Halpern, private communication). R-band and H images were obtained on 23 August 2009, and show a barely resolved () object, brighter in H and coincident with the radio source. A spectrum obtained the same night shows no continuum, but very strong nebular emission lines. The object appears to be a very compact planetary nebula. Its radio flux history is thus perplexing: 6.9 mJy at 6 cm in , rising to 10.5 mJy in 2005 and falling again to 5.8 mJy in 2006. The 20 cm flux density in the MAGPIS survey (epoch 2001–2004) is only 1.3 mJy, suggesting the source may be optically thick. Further simultaneous multi-frequency observations are required to measure the radio spectrum and derive clues as to the nature of the source’s variability.
5.2.2 X-ray observations
The brightest variable, G21.65520.3611, is coincident with a point-like X-ray source catalogued in the XMM Galactic Plane survey (Hands et al. 2004). It has a hard band (2–6 keV) flux of 0.0051 ct s-1 and is undetected in the soft (0.4–2.0 keV) band. For an intrinsic power-law spectrum with spectral index , the expected absorption column density through the Galactic plane of cm-2 is consistent with the non-detection in the soft band; the inferred intrinsic flux in the 0.2–10 keV band would be erg cm-2 s-1. For an extragalactic AGN at 1 Gpc, this corresponds to a luminosity of erg s-1, while for a Galactic object at 5 kpc, the X-ray luminosity would be a modest erg s-1; for a column density of only cm-2, the luminosity estimates are lower by a factor of 3. While this source is the brightest of our variables, it has one of the lowest modulation factors (decreasing by just over 16 years). The (non-contemporaneous) 20 cm flux density is lower than either of the 6 cm values, suggesting a mildly inverted spectrum source. It is not detected at any other wavelength. The most likely explanation of this object is a flat-spectrum extragalactic radio source, one of a handful we expect in our sample.
One other source, G30.44600.2148, lies 27″ from the position of an ASCA Galactic Plane Survey catalog entry (Sugizaki et al. 2001). The uncertainty in the X-ray position is 1′; one other (brighter) radio source lies within the X-ray error circle although at twice the distance from its centroid. The X-ray source is a marginal detection () with a 0.7–7.0 keV unabsorbed flux of erg cm-2 s-1 for an intrinsic power law index of and an absorption column density of cm-2; the flux is roughly four times lower for cm-2. Assuming the identification is correct, the X-ray to radio flux ratio is thus times greater than our other X-ray detection, although still within the X-ray to radio luminosity ratios characteristic of AGN. The primary distinguishing feature, however, is that the radio source is coincident with a very bright mid-IR source (saturated in all but the 3.6 m band) which is also detected at 1.1 mm.
The ASCA Galactic Plane Survey covered an area encompassing all but six of our variables to a flux density level of approximately erg cm-2 s-1; no other X-ray sources are coincident to within 1′. The higher-resolution coverage of the Einstein, ROSAT, XMM, and Chandra is much spottier; no further matches are found within the 10″ error circles of these other catalogs.
5.2.3 Low-frequency radio detections
Three of the variable sources are detected at 90 cm. G22.91160.2878 (Fig. 7) has a 90 cm flux density of mJy; this is consistent with a nonthermal spectral index of if one takes the most recent (but far from contemporaneous) 6, 20, and 90 cm measurements. The 6 cm flux density increased by more than a factor of three since 1990, making it one of the higher amplitude variables, but no other information is available on this source. G30.67240.9637 (the highest latitude source detected) has a 90 cm flux density of mJy, below that of the 20 cm flux density (90 mJy), possible additional evidence for variability, as the 20:6 cm flux density ratio is 3:1 (again, all non-contemporaneous). This is the smallest amplitude variable in our sample and, given its distance from the Galactic plane, an extragalactic counterpart is the most likely explanation.
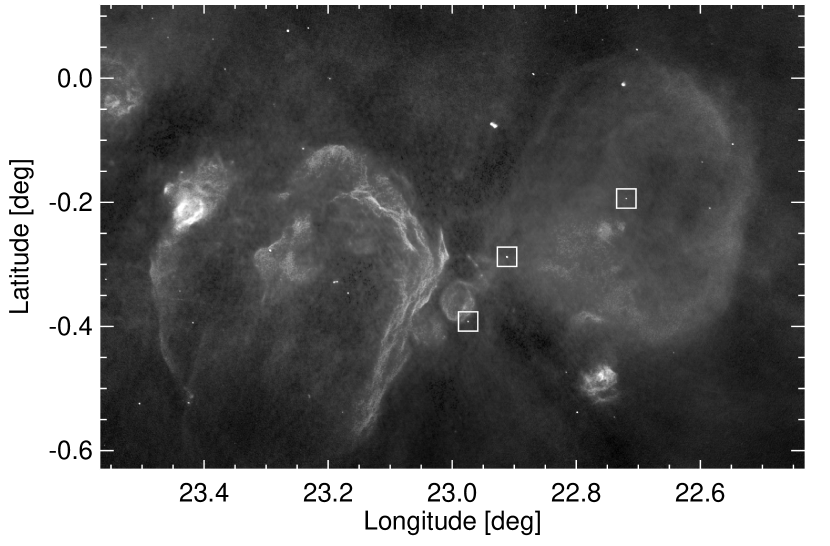
The third 90 cm detection is G22.71940.1939, perhaps the most intriguing source in our sample. An image of the region surrounding this source is given in Figure 7. The source lies very near to the geometric center of a 30′-diameter supernova remnant, G22.70.2 (Green 2004 and references therein) and 4′ from a fairly bright H II region. There is no counterpart detected at mm, IR, or optical wavelengths. The source brightened by a factor of four between 2003 and 2006 at 6 cm; its 20 cm flux density is 12 mJy, three times higher than the higher of the two 6 cm measurements. The distance to the remnant is unknown, although its large angular diameter would suggest it is not very remote (its diameter would be pc at 5 kpc). X-ray observations could reveal whether or not this source is likely to be a compact object associated with the supernova remnant.
5.3. Summary
We have discovered a relatively high surface density (2 deg-2) of variable radio sources in the Galactic plane and have argued that the large majority of these (%) are Galactic objects. While a few are associated with young star formation activity, the identity of the majority is unknown. Follow up radio observations are required to confirm the variability in these sources, establish the variability time scale(s), and obtain contemporaneous spectral indices. Observations at optical, infrared, and X-ray wavelengths could help establish counterparts and identify the origin of the variable radio emission.
References
- Aguirre et al. (2009) Aguirre, J., A., G., M., D., Drosback, M., Bally, J., Battersby, C., Bradley, E., Cyganowski, C., Dowell, D., Evans, II, N. J., Glenn, J., Harvey, P. M., Rosolowsky, E. W., Stringfellow, G., Walawender, J., & Williams, J. P. 2009, ApJ, submitted
- Alcock et al. (1997) Alcock, C., et al. 1997, ApJ, 486, 697
- Astier et al. (2006) Astier, P., et al. 2006, A&A, 447, 31
- Benjamin et al. (2003) Benjamin, R. A., et al. 2003, PASP, 115, 953
- Becker et al. (1994) Becker, R. H., White, R. L., Helfand, D. J. & Zoonematkermani, S. 1994, ApJS91, 347
- Becker et al. (1995) Becker, R. H., White, R. L., & Helfand, D. J. 1995, ApJ450, 559
- Bower et al. (2007) Bower, G. C., Saul, D., Bloom, J. S., Bolatto, A., Filippenko, A. V., Foley, R. J., & Perley, D. 2007, ApJ, 666, 346
- Brogan et al. (2005) Brogan, C. L., Gaensler, B. M., Gelfand, Y., Roberts, M. E. E., Lazio, T. J., & Kassim, N. E. 2005, in X-Ray and Radio Connections (eds. L.O. Sjouwerman and K. K. Dyer), published electronically by NRAO (http://www.aoc.nrao.edu/events/xraydio)
- Camilo et al. (2006) Camilo, F., Ransom, S. M., Halpern, J. P., Reynolds, J., Helfand, D. J., Zimmerman, N., & Sarkissian, J. 2006, Nature, 442, 892
- Camilo et al. (2007) Camilo, F., Ransom, S. M., Halpern, J. P., & Reynolds, J. 2007, ApJ, 666, L93
- Carey et al. (2009) Carey, S. J., et al. 2009, PASP, 121, 76
- Carilli et al. (2003) Carilli, C. L., Ivison, R. J., & Frail, D. A. 2003, ApJ, 590, 192
- Condon et al. (1998) Condon, J. J., Cotton, W. D., Greisen, E. W., Yin, Q. F., Perley, R. A., Taylor, G. B., & Broderick, J. J. 1998, AJ, 115, 1693
- de Vries et al. (2004) de Vries, W. H., Becker, R. H., White, R. L., & Helfand, D. J. 2004, AJ, 127, 2565
- de Vries et al. (2005) de Vries, W. H., Becker, R. H., White, R. L., & Loomis, C. 2005, AJ, 129, 615
- Drake et al. (1989) Drake, S. A., Simon, T., & Linsky, J. L. 1989, ApJS, 71, 905
- Green (2004) Green, D. A. 2004, Bulletin of the Astronomical Society of India, 32, 335
- Gregory & Taylor (1986) Gregory, P. C., & Taylor, A. R. 1986, AJ, 92, 371
- Güdel et al. (1993) Güdel, M., Bookbinder, J. A., Schmitt, J. H. M. M., & Fleming, T. A. 1993, Physics of Solar and Stellar Coronae: G. S. Vaiana Memorial Symposium, Ed. J. L. Linsky & S. Serio, Ap.Sp.Sci. Library, Vol. 183 (Kluwer: Dordrecht), p.383
- Hands et al. (2004) Hands, A. D. P., Warwick, R. S., Watson, M. G., & Helfand, D. J. 2004, MNRAS, 351, 31
- Helfand et al. (1999) Helfand, D. J., Schnee, S., Becker, R. H., White, R. L., & McMahon, R. G. 1999, AJ, 117, 1568
- Helfand et al. (2006) Helfand, D. J., Becker, R. H., White, R. L., Fallon, A., & Tuttle, S. 2006, AJ, 131, 2525
- Hyman et al. (2009) Hyman, S. D., Wijnands, R., Lazio, T. J. W., Pal, S., Starling, R., Kassim, N. E., & Ray, P. S. 2009, ApJ, 696, 280
- Kaiser et al. (2002) Kaiser, N., et al. 2002, Proc. SPIE, 4836, 154
- Manchester et al. (2005) Manchester, R. N., Hobbs, G. B., Teoh, A., & Hobbs, M. 2005, AJ, 129, 1993
- Miknaitis et al. (2007) Miknaitis, G., et al. 2007, ApJ, 666, 674
- Osten (2008) Osten, R. A. 2008, arXiv:0801.2573
- Pandian et al. (2007) Pandian, J. D., Goldsmith, P. F., & Deshpande, A. A. 2007, ApJ, 656, 255
- Pestalozzi et al. (2005) Pestalozzi, M. R., Minier, V., & Booth, R. S. 2005, A&A, 432, 737
- Price et al. (2001) Price, S. D., Egan, M. P., Carey, S. J., Mizuno, D. R., & Kuchar, T. A. 2001, AJ, 121, 2819
- Purcell et al. (2008) Purcell, C. R., Hoare, M. G., & Diamond, P. 2008, in Massive Star Formation: Observations Confront Theory, eds. H. Beuther, H. Linz & T. Henning, ASP Conf. Ser. 387, p. 389
- Rau et al. (2009) Rau, A., et al. 2009, PASP, in press (arXiv:0906.5355)
- Sugizaki et al. (2001) Sugizaki, M., Mitsuda, K., Kaneda, H., Matsuzaki, K., Yamauchi, S., & Koyama, K. 2001, ApJS, 134, 77
- Tyson (2002) Tyson, J. A. 2002, Proc. SPIE, 4836, 10
- White et al. (1997) White, R. L.,Becker, R. H., Helfand, D. J. & Gregg, M. D. 1997, ApJ475, 479
- White et al. (2005) White, R. L., Becker, R. H., & Helfand, D. J. 2005, AJ, 130, 586
| Epoch I (1990)aaThe mean epoch of observation for the Epoch I data (as given by the “Epoch” column) span a wide range; about 70% of the observations were taken in 1989 and 1990, and the remaining 30% in 2004. Mean epochs between those values indicate that observations from both epochs contribute to the coadded image. | Epoch II (2005) | Epoch III (2006) | MaximumbbGreatest brightness difference between two epochs normalized by the rms flux errors. Bold text indicates objects brightest at epoch 1 (possibly contaminated by resolution effects; see discussion for details). | 20 cmcc1.4 GHz flux density from MAGPIS catalog (Helfand et al. 2006) unless otherwise noted. | |||||||||||||
|---|---|---|---|---|---|---|---|---|---|---|---|---|---|---|---|---|---|
| Name | RA | Dec | Epoch | RMS | Epoch | RMS | Epoch | RMS | Change | CommentsddNotes on detections at other wavelengths: 90 cm (Helfand et al. 2006; Brogan et al. 2005), GLIMPSE (3.6, 4.5, 5.8 and 8.0 m unless wavelength is noted; Benjamin et al. 2003), MIPSGAL (24 m; Carey et al. 2009), BGPS (Bolocam GPS 1.1 mm; Aguirre et al. 2009), Maser (ultracompact H II regions with 6.7 GHz methanol maser; Pestalozzi et al. 2005, Pandian et al. 2007), X-ray (XMM-Newton Galactic Plane Survey, Hand et al. 2004), ASCA (X-ray; Sugizaki et al. 2001), PN (compact planetary nebula; this paper). | |||||||
| (J2000) | (J2000) | (mJy) | (mJy) | (mJy) | (mJy) | (mJy) | (mJy) | (mJy) | (mJy) | (mJy) | (rms) | (mJy) | |||||
| (1) | (2) | (3) | (4) | (5) | (6) | (7) | (8) | (9) | (10) | (11) | (12) | (13) | (14) | (15) | (16) | (17) | (18) |
| 21.65520.3611 | 18 31 57.508 | 10 11 22.43 | 2004.32 | 65.9 | 67.8 | 0.15 | 2006.53 | 43.0 | 43.2 | 0.31 | 66.6 | 22.7 | X-ray | ||||
| 22.71940.1939 | 18 33 21.033 | 09 10 06.43 | 2003.59 | 1.1 | 0.8 | 0.14 | 2006.55 | 4.0 | 4.1 | 0.32 | 8.2 | 12.3 | 90 cm, SNR G22.7-0.2 | ||||
| 22.91160.2878 | 18 34 02.837 | 09 02 28.03 | 1990.94 | 3.5 | 3.7 | 0.40 | 2006.55 | 11.4 | 16.5 | 0.32 | 15.4 | 46.2 | 90 cm | ||||
| 22.97430.3920 | 18 34 32.343 | 09 02 00.69 | 1990.94 | 0.4 | 0.8 | 0.36 | 2006.55 | 7.2 | 5.4 | 0.33 | 13.3 | 14.7 | |||||
| 23.41860.0090 | 18 33 55.619 | 08 27 15.92 | 1989.48 | 1.8 | 1.8 | 0.40 | 2006.55 | 4.6 | 5.6 | 0.32 | 5.4 | 2.0 | |||||
| 23.55850.3241 | 18 35 23.014 | 08 29 01.42 | 1993.92 | 0.4 | 0.21 | 2006.55 | 5.0 | 5.5 | 0.30 | 12.4 | 15.6 | ||||||
| 23.66440.0372 | 18 34 33.050 | 08 15 27.10 | 1989.89 | 5.3 | 5.4 | 0.18 | 2006.55 | 26.2 | 26.0 | 0.33 | 55.5 | 2.1 | |||||
| 24.33670.1574 | 18 36 13.893 | 07 42 57.64 | 1997.03 | 2.0 | 2.2 | 0.25 | 2006.56 | 6.4 | 6.8 | 0.33 | 10.7 | 20.8 | |||||
| 24.53430.1020 | 18 36 23.987 | 07 30 54.26 | 1990.50 | 0.8 | 2.8 | 0.52 | 2006.56 | 4.4 | 4.5 | 0.32 | 5.5 | 2.8 | GLIMPSE, MIPSGAL | ||||
| 24.54050.1377 | 18 36 32.343 | 07 31 33.52 | 1990.86 | 0.7 | 1.5 | 0.36 | 2006.56 | 4.5 | 4.5 | 0.33 | 7.8 | 7.1 | |||||
| 25.20480.1251 | 18 36 49.735 | 06 48 54.63 | 2001.41 | 6.6 | 6.6 | 0.22 | 2006.57 | 4.4 | 4.2 | 0.32 | 5.7 | 5.5 | GLIMPSE 8m, MIPSGAL | ||||
| 25.49200.3476 | 18 39 03.094 | 06 46 37.38 | 1990.93 | 4.3 | 4.3 | 0.17 | 2006.57 | 2.0 | 1.5 | 0.35 | 5.9 | 9.3 | embedded in nebula | ||||
| 25.71560.0488 | 18 38 02.785 | 06 23 47.29 | 1991.62 | 2.1 | 2.6 | 0.38 | 2006.57 | 8.1 | 12.6 | 0.37 | 11.3 | 16.6 | GLIMPSE, MIPSGAL, Maser | ||||
| 26.05260.2426 | 18 39 42.626 | 06 13 50.28 | 1991.61 | 7.5 | 7.4 | 0.33 | 2006.57 | 13.0 | 12.6 | 0.30 | 12.2 | 27.5 | |||||
| 26.28180.2312 | 18 38 26.372 | 05 48 35.17 | 2000.85 | 9.5 | 9.0 | 0.27 | 2006.57 | 15.3 | 14.3 | 0.29 | 14.5 | 22.4 | |||||
| 27.88210.1834 | 18 41 33.285 | 04 24 33.12 | 1991.89 | 3.8 | 3.3 | 0.21 | 2006.60 | 6.6 | 5.8 | 0.32 | 7.4 | 9.3 | |||||
| 28.62040.3436 | 18 44 47.285 | 03 59 36.43 | 2002.42 | 2.8 | 3.3 | 0.18 | 2005.39 | 8.0 | 6.4 | 0.22 | 2006.60 | 8.6 | 8.4 | 0.31 | 18.2 | 35.4 | |
| 28.98410.2947 | 18 45 16.772 | 03 38 51.21 | 1990.93 | 7.3 | 7.6 | 0.15 | 2005.24 | 5.8 | 5.8 | 0.23 | 2006.60 | 4.9 | 4.8 | 0.31 | 6.7 | 16.8 | |
| 29.05450.8679 | 18 41 15.912 | 03 03 12.98 | 2005.20 | 8.3 | 8.1 | 0.24 | 2006.60 | 5.6 | 5.9 | 0.31 | 6.8 | 26.9eeSource is outside MAGPIS survey area; 1.4 GHz flux from White et al. (2005). | |||||
| 29.10750.1546 | 18 45 00.346 | 03 28 25.59 | 1991.49 | 6.6 | 6.5 | 0.13 | 2005.28 | 11.3 | 11.4 | 0.23 | 2006.60 | 10.9 | 10.5 | 0.33 | 17.9 | 14.0 | |
| 29.19780.1268 | 18 45 04.317 | 03 22 50.49 | 2000.74 | 2.7 | 2.0 | 0.25 | 2005.27 | 4.4 | 4.1 | 0.22 | 2006.60 | 1.9 | 1.7 | 0.34 | 6.4 | 4.8 | |
| 29.22760.5173 | 18 42 49.861 | 03 03 35.96 | 2005.20 | 19.2 | 20.1 | 0.22 | 2006.60 | 13.2 | 12.7 | 0.31 | 15.4 | 66.5 | |||||
| 29.49590.3000 | 18 46 14.068 | 03 11 40.60 | 1990.93 | 5.3 | 5.2 | 0.16 | 2005.25 | 12.4 | 13.5 | 0.20 | 2006.60 | 6.9 | 7.5 | 0.32 | 27.4 | 5.0 | |
| 29.57790.2685 | 18 46 16.334 | 03 06 26.06 | 1994.37 | 6.9 | 7.6 | 0.40 | 2005.22 | 10.5 | 11.5 | 0.24 | 2006.60 | 5.8 | 5.1 | 0.34 | 11.1 | 1.3 | PN, GLIMPSE, MIPSGAL, BGPS |
| 29.60510.8590 | 18 48 25.632 | 03 21 08.51 | 2005.20 | 1.8 | 2.5 | 0.23 | 2006.60 | 8.3 | 8.3 | 0.34 | 15.7 | 44.2eeSource is outside MAGPIS survey area; 1.4 GHz flux from White et al. (2005). | |||||
| 29.71610.3178 | 18 46 42.050 | 03 00 24.37 | 2002.14 | 15.9 | 16.6 | 0.26 | 2005.22 | 30.6 | 30.4 | 0.24 | 2006.60 | 28.7 | 30.1 | 0.37 | 41.2 | 25.6 | |
| 29.71950.8788 | 18 48 42.423 | 03 15 34.64 | 2005.20 | 28.4 | 28.6 | 0.22 | 2006.60 | 20.3 | 19.5 | 0.32 | 20.7 | 46.8eeSource is outside MAGPIS survey area; 1.4 GHz flux from White et al. (2005). | |||||
| 30.10380.3984 | 18 44 51.460 | 02 20 05.69 | 2000.88 | 4.6 | 3.7 | 0.46 | 2005.20 | 6.3 | 6.8 | 0.20 | 2006.60 | 8.5 | 7.7 | 0.32 | 7.0 | 7.9 | |
| 30.43760.2062 | 18 47 37.270 | 02 18 49.67 | 1990.94 | 0.9 | 1.2 | 0.27 | 2005.25 | 12.1 | 13.1 | 0.22 | 2006.60 | 16.8 | 17.5 | 0.32 | 38.1 | 8.7 | |
| 30.44600.2148 | 18 47 40.045 | 02 18 37.04 | 1990.94 | 3.0 | 3.6 | 0.32 | 2005.24 | 5.9 | 6.6 | 0.22 | 2006.60 | 6.8 | 6.6 | 0.31 | 8.6 | 3.5 | GLIMPSE, MIPSGAL, BGPS, ASCA |
| 30.67240.9637 | 18 43 53.054 | 01 34 15.34 | 2005.20 | 28.0 | 29.1 | 0.32 | 2006.61 | 33.7 | 34.0 | 0.30 | 12.7 | 89.9eeSource is outside MAGPIS survey area; 1.4 GHz flux from White et al. (2005). | 90 cm | ||||
| 31.14940.1727 | 18 48 48.088 | 01 39 54.65 | 1995.00 | 1.8 | 1.6 | 0.26 | 2005.25 | 4.8 | 5.6 | 0.19 | 2006.61 | 3.2 | 1.8 | 0.35 | 9.0 | 3.1 | |
| 31.15950.0449 | 18 48 02.703 | 01 33 24.86 | 2003.48 | 12.4 | 11.6 | 0.32 | 2005.33 | 16.7 | 18.8 | 0.23 | 2006.61 | 15.3 | 17.2 | 0.35 | 11.1 | 15.0 | GLIMPSE, MIPSGAL, BGPS, Maser |
| 32.58980.4468 | 18 52 24.293 | 00 30 29.63 | 2005.36 | 3.1 | 3.6 | 0.17 | 2006.62 | 0.7 | 0.33 | 6.7 | 2.7 | ||||||
| 32.71930.6477 | 18 53 21.378 | 00 29 04.34 | 2005.35 | 3.6 | 4.3 | 0.17 | 2006.62 | 1.7 | 2.0 | 0.32 | 5.3 | 9.2 | |||||
| 37.23240.0356 | 18 59 25.245 | 03 48 37.48 | 2000.67 | 2.8 | 2.4 | 0.27 | 2006.63 | 0.5 | 0.27 | 5.8 | 14.7 | ||||||
| 37.73470.1126 | 19 00 36.987 | 04 13 18.60 | 2003.78 | 1.3 | 0.63 | 2006.63 | 11.3 | 12.2 | 0.32 | 14.2 | 11.0 | MIPSGAL, BGPS, Maser | |||||
| 37.75960.1001 | 19 00 37.037 | 04 14 59.08 | 2002.39 | 1.5 | 0.74 | 2006.63 | 11.5 | 12.0 | 0.32 | 12.4 | 18.5 | ||||||
| 39.11050.0160 | 19 02 47.984 | 05 29 21.52 | 2001.14 | 0.8 | 0.9 | 0.19 | 2006.65 | 3.1 | 4.2 | 0.32 | 6.3 | 12.9 | |||||