Individual and Collective Behavior of Small Vibrating Motors Interacting Through a Resonant Plate
Abstract
We report on experiments of many small motors – cell phone vibrators – glued to and interacting through a resonant plate. We find that individual motors interacting with the plate demonstrate hysteresis in their steady-state frequency due to interactions with plate resonances. For multiple motors running simultaneously, the degree of synchronization between motors increases when the motors’ frequencies are near a resonance of the plate, and the frequency at which the motors synchronize shows a history dependence.
1 Introduction
Ensembles of oscillators that spontaneously synchronize have been studied for decades. Biological examples abound[1, 2, 3], but synchronization occurs in many other systems, including coupled metronomes[4, 5], laser arrays[6], chemical oscillators[7], arrays of convective cells [8], Josephson junctions arrays [9], transport networks[10], and perhaps most notoriously, pedestrians crossing the Millennium Bridge in London when it first opened[11]. These systems are all examples of populations of similar but not identical oscillators that exhibit the same basic patterns of behavior, that (1) they synchronize spontaneously, without the need for any external driving, and (2) as the oscillators’ coupling increases, their synchronization strengthens. For an overview of the topic, see the review by Acebron et al. [12] and the popular book Sync, by Strogatz[13].
The topic of synchronization is much broader than the study of many coupled oscillators. In an effort to better understand radio tuning, Adler studied the synchronization of locking circuits, in which a phase-oscillator synchronizes to a periodic forcing[14]. Burykin and Buchman discussed the possibly lethal outcome of the lack of synchronization among organ systems when taking a patient off of a mechanical respirator[15]. Gintautus et al. found synchronization in so-called mixed-reality states, in which virtual and real systems are coupled and interact in real time[16]. All of these systems exhibit synchronization in some sense. Although we find these systems to be interesting, the work presented here is motivated by the many examples listed in the first paragraph: spontaneous collective behavior of many coupled oscillators in the absence of external forcing.
In this paper we present yet another system that exhibits synchronization: small mechanical vibrators coupled through a resonant plate. In addition to being inexpensive and easy to study, this system provides a unique twist to the standard coupled-oscillator problem in that the coupling between the oscillators depends on frequency and exhibits a simple resonance structure. How does frequency dependent coupling effect the dynamics of coupled oscillators? Unlike most other globally coupled oscillator systems, we find history-dependent behavior: an ensemble of oscillators shows hysteresis in the frequency and degree of synchronization, and an individual oscillator shows hysteresis in its steady-state frequency.
2 Experimental Setup

In this work, we study 16 small motors with eccentrically massed rotors. The motors (All Electronics Corporation, catalog number DCM-204111This item is no longer available in the catalog, but similar motors can be found in their catalog searching for “motor vibrator.”) are small DC motors, the sort used as vibrators in mobile phones. Each motor has a mass of and is long. Each motor’s rotor has a center of mass that is offset from the axis of rotation, with a first moment of . Vibrations arise from the rotation of this off-center mass.
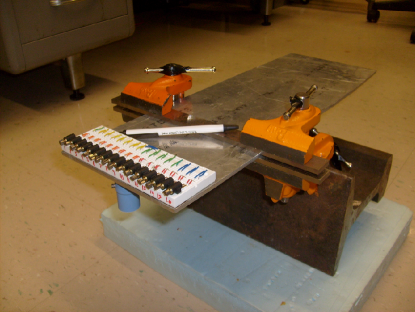
To cause the motors to interact, we attach them to a mechanically compliant and resonant aluminum plate held by clamps as shown in figure 1. The plate is long, wide, and thick. We adjust the linear response of the system by adjusting the location where the clamps hold the plate, parametrized by the length . Although we considered various clamp positions, all of the results reported here are based on a length of , for which the system has resonances at and .
We measure the plate’s vertical acceleration using an accelerometer attached to the plate, a PCB 353B33. In the diagram shown in figure 1, the accelerometer is depicted by the canister underneath the motors. A few typical time series of acceleration data due to a single motor are shown in figure 2. The sampling rate for these and all other data we discus is . The plate is a linear medium, so we attribute any observed vibrations either to the motors or to background sources, such as building vibrations. We took measurements with a stroboscope to confirm the primary frequencies obtained from the accelerometer data. In order to reduce spurious frequencies from the environment, we place the entire setup on a foam pad. Although some background noise still perturbs the system, these vibrations do not dominate the signal reported by the accelerometer and have frequencies much lower than the motors’ primary frequencies.

When the motors operate near a resonance, the stroboscope allows us to observe the plate’s mode shape. We find that both resonances, near and , do not have any nodes along the array of motors and that the displacements of all the motors has about equal magnitude. As such, the coupling between the motors has no appreciable position dependence.
All of the motors operate from a common power supply but small variations in each of the motors lead to a distribution of motor frequencies for a given voltage. We do not attempt to characterize the distribution of motor speeds in any rigorous way since we are only working with 16 motors. Stroboscopic observations indicate that the frequency distribution is approximately unimodal.
3 Behavior of a Single Motor


In order to discuss how multiple motors interact we must first understand how a single motor behaves and the sort of response it produces.
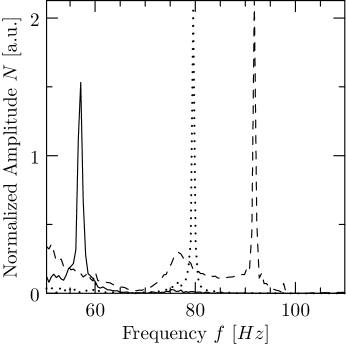
Figures 2 and 3 demonstrate typical222Although the response as a function of primary frequency is typical, the primary frequency as a function of voltage is not. This is one of our faster motors. single motor data at voltages , , and . Both figures show stable periodic behavior. The spectra in figure 3 were computed from two-second long data sets by short-time Fourier Transform:
| (1) |
as implemented with an FFT. Although the motor’s velocity can drift under special circumstances, the narrow widths of the peaks in figure 3 demonstrate that a motor’s velocity is relatively stable. We identified the primary frequency of the motor in these and many other similar experiments by fitting the peak to a Lorentzian. When we plot the primary frequencies verses the driving voltage we obtain the plot shown in figure 4(a), which we will discuss in more detail below. We also see that the magnitude of the response varies substantially for different primary frequencies. Although the magnitude of the signal can be measured by its maximum value, a more robust measure is the RMS of the Fourier transform in the vicinity of the peak, . The RMS magnitude can be plotted against the voltage , but it is better understood as a function of the primary frequency , as shown in figure 5. We will return to the magnitude measurements shortly, but first we will examine how the primary frequency depends on the applied voltage.

Although the motor’s primary frequency is relatively stable when the voltage is fixed, figure 4(a) shows that the motor’s frequency is not a simple function of voltage. We can compute the primary frequency and the width of the peak by fitting the magnitude of the spectrum to a Lorentzian,
| (2) |
within the vicinity of of the peak. Shown in figure 4(a) are the primary frequencies for two different sets of consecutive measurements, one in which we started at and slowly decreased the voltage to (indicated by triangles pointing downward), and another in which we started the motors at and slowly increased the voltage to (indicated by the triangles pointing upward). Although the two measurements demonstrate relatively good agreement below and above , we see a hysteresis between and . The upward data gets stuck near a resonance of the plate. In contrast, similar data taken from a separate motor on a rigid support is shown in figure 4(b), and we see that in the absence of resonances, a motor’s frequency is nearly linear in the applied voltage. The marked difference indicates that the motor interacts strongly with the resonances of the plate, and these interactions lead to the hysteresis observed in figure 4(a).
The primary frequency’s magnitude shows a strong dependence on the primary frequency , as shown in figure 5. We compute the RMS magnitude by
| (3) |
where the range is a multiple of the width determined by the Lorentzian fit, equation 2. The values obtained for are largely independent of the choice of so log as . As shown in figure 5, the magnitude of the plate’s response to a single motor is not monotonic in frequency. We can understand this behavior by noting that the plate has resonances near and , so the plate will have larger accelerations when driven by a motor near these frequencies than when the motor’s frequency is far from the resonances. This data was obtained by powering different motors – one at a time – at various voltages and taking two-second data sets for each voltage. Although we could seek a relation between the RMS magnitude and the applied voltage, figure 5 indicates that the RMS magnitude is a function of primary frequency. Despite overlaying data from motors at various different locations on the plate, the magnitude as a function of primary frequency is remarkably consistent, showing that the coupling between the plate and the motors for our geometry does not depend substantially on the motor’s position. Apart from the gaps in the data for frequencies just above the two peaks, the magnitudes in this plot are equivalent to , where represents the passive frequency-dependent Green function of the system. Calculations not shown here indicate that the gaps are due to motor-plate interactions that make those frequencies unstable.
All of the discussion of data presented so far has focused on single motors. Since we use a single accelerometer to measure the behavior of multiple motors acting simultaneously, and since we wish to know when two motors synchronize, we must obtain a reasonable estimate for the number of motors at a given frequency. Such an estimate is not trivial: the resonant response of the plate means that one motor turning at will produce a much stronger signal than many synchronized motors with a primary frequency of . Our solution to this problem is to use figure 5 as a normalization curve. We sample the RMS magnitude uniformly – interpolating where necessary – to obtain normalization amplitudes . We then normalize a raw spectrum such as figure 3 by dividing the amplitudes of the original spectrum by the normalization amplitudes:
| (4) |
The result of such a normalization scheme is shown in figure 6 for the data presented in figure 3. Except for the artifacts at and associated with the signal at , the scheme appears to work quite well. Even with the artifacts, single motors can be easily distinguished and counted, providing us with a decent measure of the number of motors in the vicinity of a given frequency.
4 Many Motors on a Resonant Plate
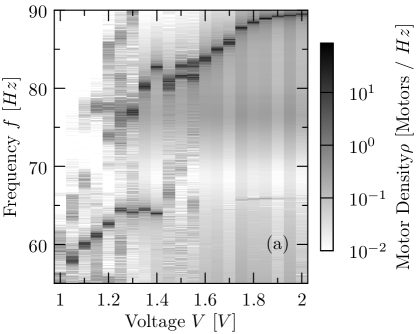
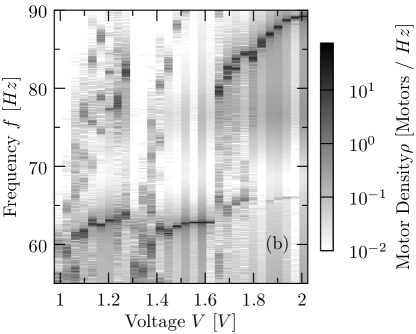
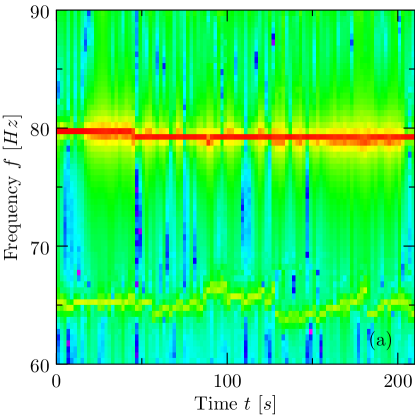
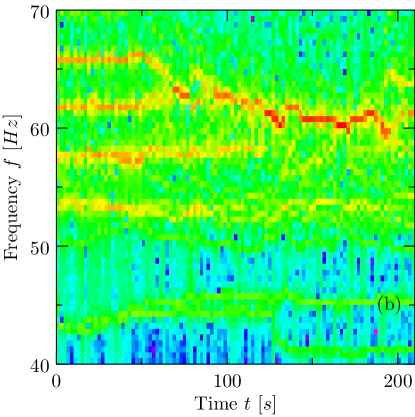
The essential behavior of multiple motors interacting on the plate is given in figure 7. These plots are consecutive minute-long measurements that have been Fourier transformed and normalized as discussed in the previous section. Instead of plotting individual spectra, like those in figure 6, we plot consecutive spectra by creating gray-scale columns and laying them out sequentially in order of applied voltage. The difference between figures 7(a) and 7(b) is that in the former we started the system at high voltage and stepped the voltage down each consecutive measurement, whereas in the latter we started the system at low voltage and stepped the voltage up each consecutive measurement, in a manner similar to the two data sets shown in figure 4. Our motors have multiple stable states for a given voltage, but generally the motors show partial or full synchronization near (), partial synchronization below (), and nearly full synchronization above (). In light of the multiple stable states of a single motor near a resonance, the multiple stable states of the many-motor system between and is not surprising.
However, the frequency of the resonance that causes the hysteresis is surprising. Although the magnitude measurements in figure 5 clearly show the resonance near , the individual motor’s behavior shown in figure 4 indicates that the resonance has no noticeable effect on the motor’s frequency. The pronounced effect of the resonance in figures 7(a) and (b) suggest that a resonance’s effect on a motor’s steady-state frequency depends on the number of motors near the resonance. We assert that when we have more motors near a resonance, the resonance’s pull is stronger. To confirm this assertion, note that in figure 7(b), between and , there is a motor turning with increasing frequencies, from to . At its frequency is . Before proceeding to , we forced the motor back down to the ensemble near . Had we continued the measurements with that motor left unchecked, as we did in other measurements, the synchronization at would have dispersed at or . This difference in behavior confirms that the stability of a resonance depends on the number of motors within a vicinity of the resonant frequency.
Figure 8 shows the dynamics of the motors at a fixed voltage over long periods. The stability of the 14 motors synchronized at is typical for synchronized motors, while the behavior of the barely-visible motor wandering near is typical of unsynchronized motors. The behavior captured in figure 8(b) is unusually dynamic for steady-state behavior: it demonstrates nearly all of the typical transient behavior that the motors exhibit at higher voltages. The most interesting behavior is the synchronization and desynchronization of motors spinning faster than . In particular, two groups of motors gradually merge between and , and then merge with yet another group to form a very large group at . This group is not stable and some of the motors split off just before before re-merging about a minute later (not shown).
5 Conclusion and Future Work
We set out to answer this question: How does frequency-dependent coupling effect the synchronization dynamics of many coupled oscillators? We found that the behavior of individual motors and ensembles of motors interacting with a resonant plate is reproducible but history dependent. However, much remains to be known.
In the work presented here, we studied the behavior of one motor on a rigid support and others on a resonant plate. In future experimental work, one could measure the same motor’s angular velocity when it is on a rigid support and on a plate to get a direct comparison of frequency as a function of voltage. We also considered a specific geometry for the plate and motors so that all of the motors interacted with the plate in nearly the same way. How would the motors behave differently if some of them were placed on the nodes for a given resonance?
We have not presented a model for our system, but many of the behaviors exhibited in this paper seem theoretically tractable. These include the stability criteria for a single motor as it approaches a resonance from above or settles on a resonance from below, the stability criteria for synchronization near a resonance, and the steady-state dynamics of many motors at weak coupling. Is the behavior at weak coupling chaotic? Is it stochastic? What governs the time scales of merging and collapsing groups?
We look forward to studying all of these fascinating behaviors.
Acknowledgments
We are thankful to John Kolinski for initiating the motors project and Nick Wolff for useful discussion. This work was supported in part by NSF grant 0528096.
References
- [1] J. Buck, “Synchronous rhythmic flashing of fireflies,” Q. Rev. Biol., vol. 13, pp. 301–314, September 1938.
- [2] W. S. Bush and H. T. Siegelman, “Circadian synchrony in networks of protein rhythm driven neurons,” Complexity, vol. 12, no. 1, pp. 67–72, 2006.
- [3] A. T. Winfree, “Biological rhythms and the behavior of populations of coupled oscillators,” J. Theor. Biol., vol. 16, pp. 15–42, 1967.
- [4] J. Pantaleone, “Synchronization of metronomes,” Am. J. Phys., vol. 70, pp. 992–1000, October 2002.
- [5] H. Ulrichs, A. Mann, and U. Prlitz, “Synchronization and chaotic dynamics of coupled mechanical metronomes,” CHAOS, vol. 19, December 2009.
- [6] S. Y. Kourtchatov, V. V. Likhanskii, A. P. Napartovich, F. T. Arecchi, and A. Lapucci, “Theory of phase locking of globally coupled laser arrays,” Phys. Rev. A, vol. 52, pp. 4089–4094, November 1995.
- [7] I. Z. Kiss, Y. Zhai, and J. L. Hudson, “Emerging coherence in a population of chemical oscillators,” Science, vol. 296, pp. 1676–1678, May 2002.
- [8] M. A. Miranda and J. Burguete, “Spatiotemporal phase synchronization in a large array of convective oscillators,” Int. J. Bifurcation and Chaos, vol. 20, no. 3, pp. 835–847, 2010.
- [9] K. Weisenfeld, P. Colet, and S. H. Strogatz, “Frequency locking in Josephson arrays: Connection with the Kuramoto model,” Phys. Rev. E, vol. 57, pp. 1563–1569, February 1998.
- [10] R. K. Kincaid, N. Alexandrov, and M. J. Holroyd, “An investigation of synchrony in transport networks,” Complexity, vol. 14, no. 4, pp. 34–43, 2008.
- [11] S. Strogatz, D. Abrams, A. McRobie, B. Eckhardt, and E. Ott, “Theoretical mechanics: Crowd synchrony on the Millennium Bridge,” Nature, vol. 438, pp. 43–44, November 2005.
- [12] J. A. Acebrón, L. L. Bonilla, C. J. P. Vicente, F. Ritort, and R. Spigler, “The Kuramoto model: A simple paradigm for synchronization phenomena,” Reviews of Modern Physics, vol. 77, pp. 137–185, January 2005.
- [13] S. Strogtz, Sync: The Emerging Science of Spontaneous Order. New York: Hyperion, 2003.
- [14] R. Adler, “A study of locking phenomena in oscillators,” Proc IEEE, vol. 61, pp. 351–357, 1946.
- [15] A. Burykin and T. G. Buchman, “Cardiorespiratory dynamics during transitions between mechanical and spontaneous ventilation in intensive care,” Complexity, vol. 13, no. 6, pp. 40–59, 2008.
- [16] V. Gintautas and A. Hubler, “Experimental evidence for mixed reality states in an interreality system,” Phys. Rev. E, vol. 75, no. 5, pp. 057201(1)–057201(4), 2007.