Galaxy group at =0.3 associated with the damped Lyman alpha system towards quasar Q1127–145
Abstract
We performed a spectroscopic galaxy survey, complete to 20.3 ( at ), within 100100′′ of the quasar Q1127–145 (). The VLT/UVES quasar spectrum contains three 0.33 Mgii absorption systems. We obtained eight new galaxy redshifts, adding to the four previously known, and galaxy star formation rates (SFRs) and metallicities were computed where possible. A strong Mgii system [ Å], which is a known damped Ly absorber (DLA), had three previously identified galaxies; we found two additional galaxies associated with this system. These five galaxies form a group with diverse properties, such as a luminosity range of , an impact parameter range of kpc and velocity dispersion of km s-1. The DLA group galaxy redshifts span beyond the 350 km s-1 velocity spread of the metallic absorption lines of the DLA itself. The two brightest group galaxies have SFRs of few yr-1 and should not have strong winds. We have sufficient spectroscopic information to directly compare three of the five group galaxies’ (emission-line) metallicities with the DLA (absorption) metallicity: the DLA metallicity is 1/10th solar, substantially lower than the three galaxies’ which range between less than 1/2 solar to solar metallicity. HST/WFPC–2 imaging shows perturbed morphologies for the three brightest group galaxies, with tidal tails extending 25 kpc. We favor a scenario where the DLA absorption originates from tidal debris in the group environment.
Another absorber exhibits weak Mgii absorption [ Å] and had a previously identified galaxy at a similar redshift. We have identified a second galaxy associated with this system. Both galaxies have solar metallicities and unperturbed morphologies in the HST/WFPC–2 image. The SFR of one galaxy is much lower than expected for strong outflows. Finally, we have also identified five galaxies at large impact parameters with no associated Mgii absorption [ mÅ, 3 ] in the spectrum of Q1127–145.
keywords:
—galaxies: ISM, haloes, interactions —quasars: absorption lines.1 Introduction
Absorption lines detected in the spectra of background quasars and gamma ray bursts remain one of the best probes of intervening multiphase gas throughout the Universe. Pioneering work of Bergeron (1988) and Bergeron & Boissé (1991) led to the first galaxies identified in close proximity to a quasar sight-line and at the same redshift as metal-enriched absorption traced by the Mgii doublet. Since then, there has been numerous studies of Mgii absorption line systems aimed at interpreting the properties of galaxy halos at a variety of redshifts (e.g., Le Brun et al., 1993; Steidel, Dickinson, & Persson, 1994; Churchill, Steidel, & Vogt, 1996; Churchill et al., 2000b; Steidel et al., 2002; Ellison et al., 2003; Bouché et al., 2006; Zibetti et al., 2007; Kacprzak et al., 2008; Chen & Tinker, 2008; Barton & Cooke, 2009; Rubin et al., 2009a; Pollack et al., 2009; Ménard et al., 2009).
Mgii absorption lines are ideal for studying a large dynamic range of structures and environments in and around galaxies since they trace low ionization metal-enriched gas with neutral hydrogen column densities of cm-2(Churchill et al., 2000a; Rigby, Charlton, & Churchill, 2002). This large density range allows for detections of Mgii in absorption out to kpc from the host galaxy (Zibetti et al., 2007; Chen & Tinker, 2008; Kacprzak et al., 2008).
Significant theoretical efforts have employed semi-analytical models and single halo galaxy simulations to interpret and understand absorption systems (e.g., Mo & Miralda-Escude, 1996; Burkert & Lin, 2000; Lin & Murray, 2000; Maller & Bullock, 2004; Chelouche et al., 2008; Chen & Tinker, 2008; Tinker & Chen, 2008; Kaufmann et al., 2009). These models and simulations have helped constrain halo sizes, covering fractions, gas kinematics, physical gas conditions, etc. However, the majority of these studies modeled galaxies as isolated systems/halos and lack the important dynamic influences of the cosmic structure and local environments, which also may contribute to a significant fraction of the detected Mgii absorption (Kacprzak et al., 2010).
Halo gas masses and cross sections are suggested to increase due to tidal streams produced by the interactions/minor mergers and/or increased star formation-induced winds caused by gas rich minor mergers (York et al., 1986; Rubin et al., 2009a). Mgii gas outflowing at km s-1 has been detected in winds of galaxies at (e.g., Tremonti et al., 2007; Weiner et al., 2009; Rubin et al., 2009b). Winds have also been suggested to be responsible for high equivalent width Mgii absorbers (Bouché et al., 2006). Evidence of galaxy interactions producing Mgii absorption was discussed by Kacprzak et al. (2007) who reported a suggestive correlation between the Mgii rest equivalent width, , and the galaxy morphological asymmetries normalized by impact parameter. They suggest that perturbations from minor galaxy mergers may be responsible for producing low equivalent width systems [ Å]. These results are consistent with low redshift Hi surveys where galaxies having a perturbed/warped disk, from a previous or ongoing minor merger, also have more extended Hi disks/halos (Puche et al., 1992; Swaters, Sancisi & van der Hulst, 1997; Rand, 2000; Fraternali et al., 2002; Chynoweth et al., 2008; Sancisi et al., 2008). The aforementioned results suggest that galaxy environments may play a role in the metal enrichment of galaxy halos.
Lopez et al. (2008) performed the first statistical environmental study of absorption systems associated with 442 x-ray selected galaxy clusters (0.3–0.9) out to transverse distances of 2 h-1 Mpc. It was determined that galaxy clusters produce a factor of 15 over-abundance of strong equivalent width systems [ Å] compared to field galaxies. This over-abundance is higher in the centers of clusters than in the outer parts and also increases with cluster mass. In contrast, the of weak Mgii systems [ Å] in clusters is consistent with those derived from environmentally unbiased samples. Lopez et al. (2008) argue that the detected over-abundance of strong systems is a result of the over-density of galaxies in a cluster region. The lack of an over-abundance of weak systems may imply they were destroyed by the cluster environment. Padilla et al. (2009) modeled these results and found environmental evidence of truncated Mgii halo sizes as a function of cluster radii. Their models require a median Mgii halo size of h-1 kpc, compared to h-1 kpc for field galaxies, in order to reproduce the observed absorption-line statistics of Lopez et al. (2008). These x-ray selected clusters represent more extreme environments than in galaxy groups where the majority of galaxies reside. In x-ray clusters, ram-pressure stripping is an important environmental effect since the intracluster medium and galaxy velocities are much higher than in galaxy groups where ram-pressure stripping is negligible (Mulchaey & Zabludoff, 1998). However, in groups the galaxy velocities are smaller and the interactions and mergers more frequent, resulting in increased gas covering fractions of the cool intragroup gas (Zabludoff & Mulchaey, 1998).
A significant fraction of strong Mgii absorption systems are damped Lyman alpha systems (DLA) (Rao et al., 2003). Since the discovery of DLAs (Wolfe et al., 1986) their host galaxy properties and environments have remained largely unknown. Only a small fraction of DLA hosts have been identified and appear to be isolated galaxies in close proximity of the quasar LOS (Lacy et al., 2003; Møller et al., 2002; Rao et al., 2003; Chun et al., 2006). Models support an array of origins of the DLA absorbing gas from rotating thick disks (e.g., Prochaska & Wolfe, 1997, 1998; Prochaska et al., 2002), gas rich dwarf galaxies (Matteucci et al., 1997), irregular protogalactic clumps (Haehnelt et al., 1998), and tidal gas or processes such as superwinds and outflows (Zwaan et al., 2008).
In this paper, we perform a spectroscopic survey of the galaxies in the Q1127145 quasar field. A VLT/UVES quasar spectrum shows that there are three absorption systems in this field, one of which is DLA system which has three previously identified galaxies at a similar redshift. However, this field contains many unidentified bright galaxies within 50′′ of the quasar line of sight. We perform a spectroscopic survey, to a limiting magnitude of , in an attempt to obtain spectroscopic redshifts for the remaining galaxies within the field. In § 2 we describe our sample and analysis. In § 3 we present the results of our redshift survey. We discuss morphologies of the galaxies and we also compute galaxy star formation rates (SFRs) and emission line metallicities when possible. We compare galaxy metallicities to the absorption line metallicity derived for the DLA. In § 4, we discuss the possible origins of the Mgii absorption and our concluding remarks are in § 5. Throughout we adopt an H km s-1Mpc-1, , cosmology.
2 Target Field and Observations
Q1127145 is a bright (V=16.9 mag) 1.18, gigahertz-peaked radio source with a 300 kpc jet seen in the x-ray and in multi-frequency radio observations (see Siemiginowska et al., 2002, 2007). A VLT/UVES spectrum of the quasar contains three Mgii absorption systems: 0.190973 (Evans et al., in prep), 0.312710 (Bergeron & Boissé, 1991) and 0.328266 (Narayanan et al., 2007). To date, no galaxies have been found to have similar redshift as the 0.190973 Mgii absorption. One galaxy associated with the 0.328266 absorption system (labeled in this paper as G5) was recently spectroscopically confirmed by Kacprzak et al. (2010).
From a HST/FOS UV spectrum, the 0.312710 was determined to be a DLA with cm-2 (Rao & Turnshek, 2000). Bergeron & Boissé (1991) spectroscopically identified two galaxies (labeled in this paper as G2 and G4) to be at a similar redshift as the 0.312710 absorption system. Since G2 is closer to the quasar line of sight (LOS) and has more significant star formation than G4, G2 was favored as the absorbing galaxy. Lane et al. (1998) later obtained a spectroscopic redshift of another galaxy, called G1 here, which is also consistent with the absorption redshift and was then favored as the absorbing galaxy due to its closer proximity to the quasar LOS than G2 and G4. Additional multi-band imaging studies claim to have detected low surface brightness emission around the quasar and also a possible underlying galaxy from the quasar LOS (Nestor et al., 2002; Rao et al., 2003; Chun et al., 2006). However, it is possible that the low surface brightness signal is coming from radio-loud/x–ray emitting quasar host galaxy at (Siemiginowska et al., 2002, 2007). In either case, this field does not contain the typical isolated galaxy and absorber seen in many quasar absorber fields. (e.g., Steidel, Dickinson, & Persson, 1994; Steidel et al., 1997; Guillemin & Bergeron, 1997).
The Q1127145 field appears to have an unusually large number of bright galaxies within centered on the quasar line of sight. Here we have performed a shallow spectroscopic survey of the field at a limiting magnitude of in an attempt to identify the remaining absorbing galaxies within the field. At the redshift of the DLA the band luminosity limit is .
| Slit | Exposure | |||
|---|---|---|---|---|
| Position | Grating | (Å) | Date (UT) | (seconds) |
| Slit 1 | B1200 | 4500 | 2008 Jan. 16 | 10,500 |
| R1200 | 7300 | 2008 Jan. 16 | 4500 | |
| R1200 | 8500 | 2008 Jan. 16 | 6000 | |
| Slit 2 | B1200 | 5220 | 2008 Feb. 01 | 4500 |
| R830 | 9040 | 2008 Feb. 01 | 4500 | |
| Slit 3 | B1200 | 4700 | 2008 Feb. 01 | 3000 |
| B1200 | 5220 | 2008 Mar. 27 | 6000 | |
| R830 | 9040 | 2008 Feb. 01 | 3000 | |
| R830 | 9040 | 2008 Mar. 27 | 6000 | |
| Slit 4 | B1200 | 5220 | 2008 Feb. 01 | 3000 |
| R830 | 9040 | 2008 Feb. 01 | 3000 |
2.1 Galaxy Spectroscopy
Galaxy spectra were obtained during three nights between 2008 January and 2008 March using the double imaging spectrograph (DIS) at the Apache Point Observatory (APO) 3.5m telescope in New Mexico. Details of the observations are presented in Table 1. The spectrograph has separate red and blue channels that have plate scales of 0.40′′ pixel-1 and 0.42′′ pixel-1, respectively. We used a 1.5′′-wide by 6′-long slit with no on-chip binning of the CCD.
The B1200 grating was used for the blue channel resulting in a spectral resolution of 0.62 Å pixel-1 with wavelength coverage of 1240 Å. For the red channel, both the R830 and the R1200 gratings were used. The R830 grating has a spectral resolution of 0.84 Å pixel-1 with wavelength coverage of 1680 Å. The R1200 has a spectral resolution of 0.58 Å pixel-1 with wavelength coverage of 1160 Å. Wavelength centers for each grating (see Table 1) were selected to target [Oii], , and [Nii] emission lines for galaxies. The total exposure time per target ranges from 3000 to 10,500 seconds and the observations were performed during poor/cloudy weather conditions with typical seeing of 12′′. Four slit positions were obtained and are shown in Figure 1.
Spectra were reduced using IRAF111IRAF is written and supported by the IRAF programming group at the National Optical Astronomy Observatories (NOAO) in Tucson, Arizona. NOAO is operated by the Association of Universities for Research in Astronomy (AURA), Inc. under cooperative agreement with the National Science Foundation.. External quartz dome-illuminated flat fields were used to eliminate pixel-to-pixel sensitivity variations. Stellar spectra taken in the same field were used as traces to facilitate the extraction of the faint galaxy spectra. Each spectrum was wavelength calibrated using HeNeAr arc line lamps. The galaxy spectra were both vacuum and heliocentric velocity corrected.
A Gaussian fitting algorithm (see Churchill et al., 2000a), which computes best fit Gaussian amplitudes, centers, and widths, was used to obtain the galaxy redshifts from one or more emission lines. Emission lines used to calculate the galaxy redshift were detected at or above the level (the galaxy redshifts are listed in Table 3).
Higher resolution spectra of three previously identified galaxies (G2, G4, and G5) were obtained by Kacprzak et al. (2010). Their Keck/ESI spectra have a velocity resolution of km s-1 pixel-1 and have a range of exposure times of 600–4200 seconds. Details regarding the individual spectra and the data reductions are presented in Kacprzak et al. (2010). Here we present the flux calibrated spectra for these three galaxies. The spectra were calibrated using IRAF with standard stars taken during the night of the observation. We have made no corrections for slit loss nor reddening.
| Quasar | Chip | Exposure | |||
|---|---|---|---|---|---|
| Filter | Location | PA | (seconds) | Date | PID |
| F814W | WF3 | 11.502 | 4400 | May 23 2001 | 9173 |
| F814W | WF3 | 3.102 | 4400 | Aug. 01 2001 | 9173 |
| F814W | WF3 | 147.006 | 4400 | Nov. 16 2001 | 9173 |
| F814W | WF3 | 147.863 | 4400 | Nov. 16 2001 | 9173 |
| F814W | WF3 | 164.698 | 4400 | Jan. 03 2002 | 9173 |
| ID | REFa | Group | Wb | c | |||||||
|---|---|---|---|---|---|---|---|---|---|---|---|
| (kpc) | ID | (Å) | (km s-1) | ||||||||
| G1 | 3.81 | 1 | 17.7 | 0.04 | 1 | 0.312710 | |||||
| G2 | 10.01 | 2,3,4 | 20.4 | 0.54 | 1 | 0.312710 | |||||
| G3 | 16.23 | 5 | 19.2 | 0.18 | 2 | 0.328266 | |||||
| G4 | 17.77 | 2,3,4 | 20.6 | 0.63 | 1 | 0.312710 | |||||
| G5 | 19.30 | 4 | 20.5 | 0.60 | 2 | 0.328266 | |||||
| G6 | 21.76 | 5 | 19.4 | 0.22 | 1 | 0.312710 | |||||
| G7 | 27.92 | 5 | 18.7 | 0.11 | 0.0049 | ||||||
| G8 | 33.22 | d | |||||||||
| G9 | 33.91 | 5 | 18.3 | 0.08 | 0.0050 | ||||||
| G10 | 37.93 | d | |||||||||
| G11 | 38.12 | 5 | 19.6 | 0.27 | 0.0048 | ||||||
| G12 | 43.23 | 5 | 19.65 | 0.27 | 0.0048 | ||||||
| G13 | 50.08 | ||||||||||
| G14 | 52.54 | 5 | 19.2 | 0.18 | 1 | 0.312710 | |||||
| G15 | 68.22 | 5 | 19.6 | 0.25 | 0.0057 |
aGalaxy Identification: (1) Lane et al. (1998), (2) Bergeron & Boissé (1991), (3) Guillemin & Bergeron (1997), (4) Kacprzak et al. (2010), (5) This work. bEquivalent width limits are . c is the rest-frame velocity offset between the mean Mgii absorption line and the galaxy where, km s-1. dNo strong emission lines were detected.
2.2 Quasar Spectroscopy
The absorption properties were measured from VLT/UVES (Dekker et al., 2000) archival spectra of Q1127145 obtained on 2002 August 17 [PI Lane, PID 67.A-0567(A)], 2003 August 18 [PI Savaglio, PID 69.A-0371(A)], and 2007 May 3 [PI Miniati, PID 076.A-0860(A)]. The UVES spectrum has a wavelength coverage from 3046–4517 Å and from 4622–6810 Å. All spectra were taken with binning using a -wide slit, providing a spectral resolution with FWHM 7 km s-1. They were reduced using the standard ESO pipeline and the custom code UVES Post–Pipeline Echelle Reduction (uves popler222http://astronomy.swin.edu.au/mmurphy/UVES_popler.html). The spectrum is both vacuum and heliocentric velocity corrected. Analysis of the Mgii absorption profiles was performed using interactive software (see Churchill et al., 1999, 2000a; Churchill & Vogt, 2001) for local continuum fitting, objective feature identification, and measuring absorption properties. The absorption redshifts are computed from the optical depth weighted mean of the Mgii absorption profile (see Churchill & Vogt, 2001). The typical absorption redshift uncertainty is km s-1. Velocity widths of absorption systems are measured between the pixels where the equivalent width per resolution element recovers to the detection threshold (Churchill et al., 1999).
2.3 HST Imaging
The WFPC–2/HST F814W images were obtained from the Hubble Legacy Archive (HLA333http://hla.stsci.edu/) (PI Bechtold). Details of the WFPC–2/HST observations are presented in Table 2. Five sets of four 1100s exposures were taken over a range of position angles. In all of the images, the quasar was positioned in the center of chip 3 of the WFPC–2 camera. We combined the five 4400s images using IRAF IMCOMBINE.
Galaxy photometry was performed using the Source Extractor (SExtractor) package (Bertin & Arnouts, 1996) with a detection criterion of 1.5 above background. The magnitudes were computed using the WFPC–2 zero points taken from Table 5.1 of the WFPC–2 Data Handbook and the chip gains obtained from the WFPC–2 Instrument Handbook. All magnitudes are based upon the Vega system.
Galaxy absolute -band magnitudes, , were determined from the –corrected observed . The –corrections were computed using the formalism of Kim, Goobar, & Perlmutter (1996) using the spectral energy distribution (SED) templates of Kinney et al. (1996). We adopted a Sb SED which is consistent with the average colour of Mgii absorbing galaxies (Steidel, Dickinson, & Persson, 1994; Zibetti et al., 2007). –band luminosities were computed using the DEEP2 optimal of Faber et al. (2007, Table 2) in the redshift bin appropriate for each galaxy ( for ).
3 Results
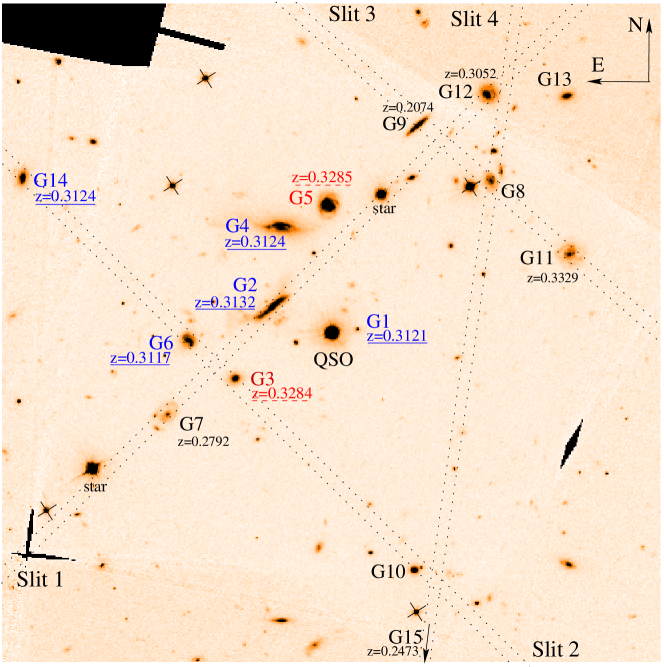
Here we discuss the galaxies identified in our redshift survey along with galaxies identified in previous works. In Figure 1 we present a 100100′′ portion of the combined WFPC2 image centered on the quasar. The four slit positions used in our new observations are indicated on the image. In Table 3, we list all the galaxies in the quasar field that have within box centered on the quasar (we have included galaxy G1 since it has a spectroscopic redshift and G15 which is beyond the surveyed region).
We have obtained spectroscopic redshifts for eight new galaxies in this work. We have identified: (1) a group of galaxies associated with the DLA, (2) a pair of galaxies associated with a weak Mgii absorption system, and (3) five non-absorbing galaxies. The offsets of the systemic velocity of the absorbing galaxies from the optical depth weighted mean Mgii absorption are also listed in Table 3 and range from to km s-1. In the following subsections we will discuss the galaxies identified in the Q1127145 field.
3.1 Non-Absorbing Galaxies
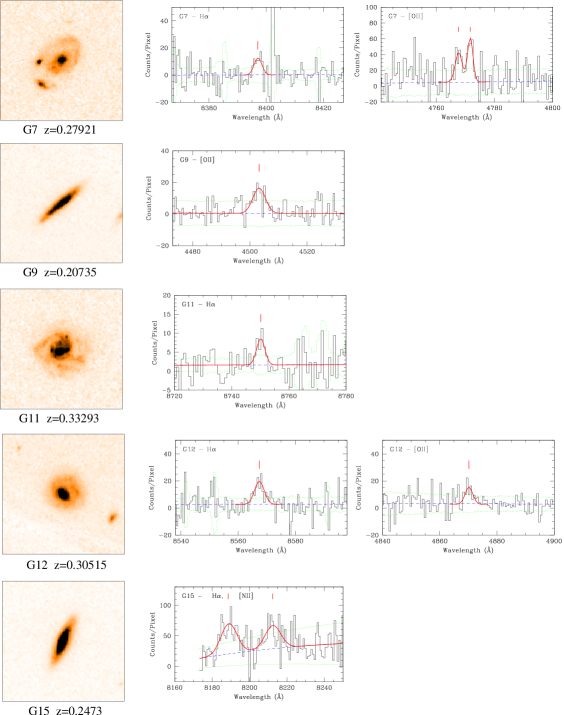
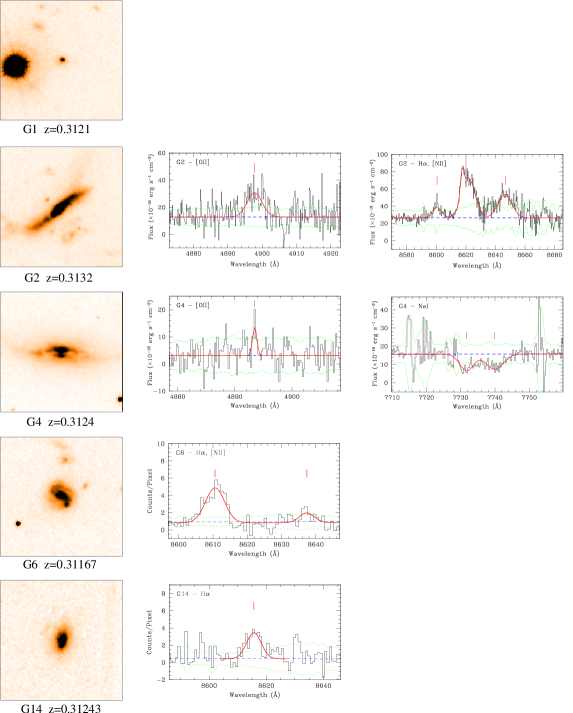
We have spectroscopically confirmed the redshifts of five non-absorbing galaxies for which we do not detect Mgii absorption to the limits of the UVES spectrum. In Figure 2 we show images of these galaxies along with their emission line spectra. Galaxies are listed in increasing impact parameter order. The galaxy redshifts were determined using H and/or [Oii] emission lines. From the HST image, the non-absorbing galaxies appear to be normal spiral disks and the spectra indicate they have ongoing star formation.
Three galaxies (G7, G12, and G15) have been spectroscopically confirmed with two emission lines while two galaxies (G9 and G11) have been confirmed with a single line. There is the possibility that the redshifts of galaxies computed with only one emission line may be incorrect. However, given the wavelengths of these lines and the observed apparent magnitudes of the galaxies, it is highly unlikely that these are at different redshifts than the ones quoted here. The redshift of G9 was computed using the [Oii] emission line and is reliable because since the observed [Oii] wavelength is Å, which is bluer than any other optical galaxy emission line rest wavelength and is not likely to be a UV emission line since it would place the galaxy at a redshift . The redshifts of G11 and G14 were computed using only the H emission line. If the H emission line is incorrectly identified then the next likely candidate line would be [Oiii]. This would place the galaxy at redshifts of , which would result in with a disk scale length kpc. We are therefore confident in these emission line identifications.
All non-absorbing galaxies have Mgii equivalent width 3 detection limits of 4.85.7 mÅ (see Table 3). These equivalent width limits are quite low and imply that these galaxies are not associated with any substantial Mgii absorption along the LOS, which can be interpreted as either the quasar LOS passing outside the galaxies’ Mgii enriched halos or through a void within the patchy Mgii halo gas distribution. It is important to note that all the non-absorbing galaxies have impact parameters kpc. This is consistent with current studies that show most luminous galaxies at projected distances within 120 kpc are Mgii absorbers while beyond 120 kpc they are not (Churchill, Kacprzak, & Steidel, 2005; Zibetti et al., 2007; Kacprzak et al., 2008; Chen & Tinker, 2008).
3.2 Galaxies
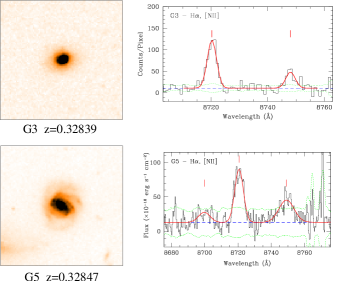
We have spectroscopically confirmed one new galaxy (G3) at in addition to G5, which was spectroscopically identified by Kacprzak et al. (2010). Both galaxies have strong H and Nii emission lines shown in Figure 3. G3 has the smallest impact parameter of kpc and has a H rest equivalent width of 32.0 Å. G5 has an impact parameter of kpc and has a H rest equivalent width of 29.5 Å. Both galaxies appear to have normal unperturbed morphology. G3 is a compact core 0.2 galaxy with ongoing star formation while G9 is a 0.6 galaxy with a large bar and a sizable bright bulge similar to a local SBb galaxy. The major differences between the two galaxies are that G9 is much brighter than G3 and exhibits spiral arms.
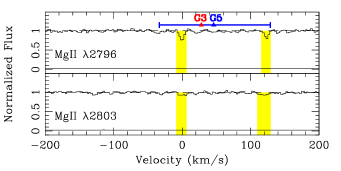
The Mgii absorption was first reported by Narayanan et al. (2007), and is presented in Figure 4. This weak system is composed of two single clouds with a velocity separation of 124 km s-1 and has a total equivalent width of Å. No significant Mgi is detected (, Å). In Figure 4 we also show the galaxy systemic redshifts (triangles) relative to the absorption system. Note that both galaxies have redshifts that are bracketed with both absorption clouds.
Galaxy G5’s rotation curve was obtained by Kacprzak et al. (2010) and the error bars in Figure 4 indicate its observed maximum rotation velocities. With a projected velocity span of 160 km s-1, G5’s dynamics is consistent with both absorption cloud velocities. In particular, Kacprzak et al. (2010) show that the two cloud velocities align with each side of the rotation curve, but that pure disk models are unable to reproduce the observed Mgii absorption velocities. If we were able to obtain a rotation curve for G3, both galaxy kinematics would likely be consistent with both absorption clouds. Thus, in these circumstances, it is difficult to disentangle which galaxy is associated with this particular absorber. Yet associating the absorption with one galaxy or the other may result in a difference in conclusions regarding the origins of the absorption. We discuss the implications of this in Section 4.
3.3 Galaxies
| Rest Equivalent Width (Å) | Integrated Line Flux ( erg s-1 cm-2) | |||||||||||||
|---|---|---|---|---|---|---|---|---|---|---|---|---|---|---|
| ID | [Oii] | H | [Oiii] | [Nii] | H | [Nii] | [Oii] | H | [Oiii] | [Nii] | H | [Nii] | ||
| G3 | 0.32839 | 5.1 | 3.7 | |||||||||||
| G5 | 0.32847 | 2.0 | 2.0 | 1.2 | 76 | 43 | 23 | |||||||
| Group | ||||||||||||||
| G1 | 0.3121 | |||||||||||||
| G2 | 0.3132 | 0.4 | 0.4 | 11 | 12 | |||||||||
| G4 | 0.3124 | 0.5 | 0.6 | 1.4 | 1.5 | 1.0 | 7 | 8 | 31 | 34 | 23 | |||
| G6 | 0.31167 | 4.2 | 2.9 | |||||||||||
| G14 | 0.31243 | 2.5 | 5.1 | |||||||||||
Three previously spectroscopically confirmed galaxies associated with the DLA are G1, G2, and G4. G1 is the closest galaxy to the quasar line of sight having an impact parameter of kpc. This faint 0.04 compact core galaxy was identified from [Oiii] emission lines (Lane et al., 1998). The next closest galaxy to the quasar line of sight is G2 with kpc. This edge-on spiral displays asymmetries on both sides of the galaxy and its H rest equivalent width is 17.3 Å. The G4 galaxy has a major dust lane and a large bulge. Given that we detected no strong emission lines, this galaxy could either be classified as Sa or as an early-type S0 galaxy. It has a luminosity of with impact parameter of kpc.
We have spectroscopically confirmed two new galaxies (G6 and G14) at a similar redshift to the DLA in addition to the three previously discovered galaxies G1, G2, and G4 (Bergeron & Boissé, 1991; Lane et al., 1998). All five galaxies are shown in increasing impact parameter order in Figure 5. The galaxy emission line strengths are shown in Table 4. The newly spectroscopically confirmed galaxy G6 has an impact parameter of kpc and has a H rest equivalent width of 32.4 Å. This 0.22 spiral galaxy has asymmetric spiral arms. G14 has an impact parameter of kpc and has a H rest equivalent width 34.8 Å. This 0.18 galaxy has a perturbed early-type morphology. Both newly identified galaxies are at larger impact parameters than the previously known ones (G1, G2 and G4), suggesting that the galaxy environment is more group-like and much larger than previously thought.
The galaxy group has five confirmed galaxies that have a luminosity range of . The group of at least five galaxies has a velocity dispersion of km s-1 centered at a redshift of .
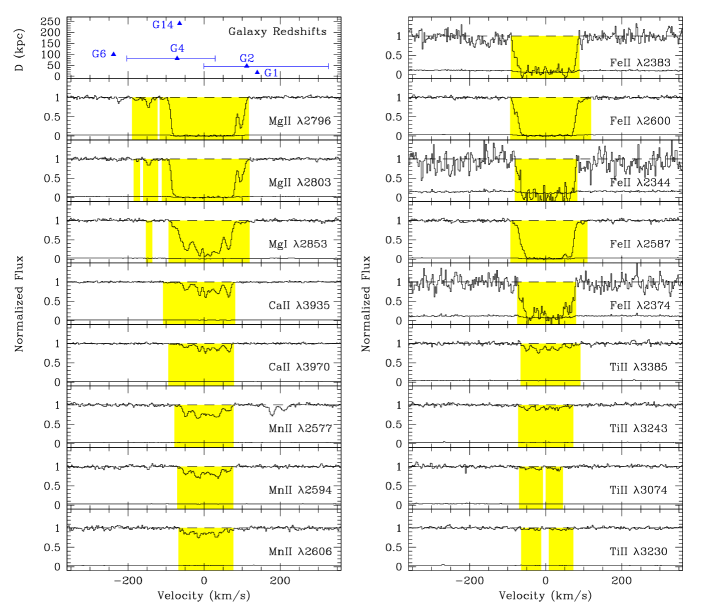
The velocity spread of the galaxy group is comparable to the velocity spread of the Mgii gas as seen in Figure 6. The galaxies cover a full velocity range of 350 km s-1. The Mgii absorption seems to occur in two separate kinematic components: the large, saturated component has a large velocity spread of 235 km s-1, and the much weaker absorption bluewards of the saturated component comprises several clouds with a velocity spread of 68 km s-1. The Mgii absorption redshift is offset km s-1 redward of the galaxy group redshift of . In Figure 6, we show the rotation velocity ranges for G2 and G4 from Kacprzak et al. (2010). These galaxies are the brightest two in the group. The maximum observed projected rotational velocity for G2 is km s-1 and G4 has maximum observed projected rotational velocity of km s-1. The rotation velocities of both G2 and G4 alone cover the full range of the absorption velocities. Kacprzak et al. (2010) note that, using a simple disk model, a large fraction of the absorption velocities could be explained by the halo gas of G2 and G4 rotating as thick disks. However, the disk model is quite unrealistic since it assumes the halo rotates at constant velocity, set by the maximum galaxy rotation velocity, independent of scale height. Therefore it is unlikely that all of the absorption is produced by co-rotating halo gas from both galaxies G2 and G4.
Using the Mgi profile, one can study the individual clouds that are saturated in Mgii. The majority of the Mgi gas is aligned with the saturated Mgii component. Only a very weak Mgi cloud is detected in a second kinematic component at 150 km s-1. All detectable Feii lines are highly saturated (see Figure 6). The absorption velocity structure is more apparent in the Caii, Mnii and Tiii lines where five to six kinematically distinct absorption features are apparent. These features do not align with the five galaxy redshifts in the group, making it difficult to determine the origin of the absorbing gas.
A HST/STIS E230M spectrum was also taken of this quasar (PI:Bechtold). The Znii present in the spectrum has the same velocity structure as the Caii and the measured Znii column density is cm-2(Kanekar 2009, private communication). We discuss the metallicity of this DLA in greater detail in Section 3.5.
Lane et al. (1998) detected 21-cm absorption at a similar redshift to the DLA. Higher signal-to-noise and higher resolution 21-cm absorption spectra taken by Chengalur & Kanekar (2000) revealed that the broad feature detected by Lane et al. (1998) breaks up into a five to six narrow components. The full velocity width of the absorption is km s-1, which is comparable to the velocity widths of the Caii, Tiii and Znii. The individual 21-cm absorption components also have a similar velocities as the heavy metal absorption components. The 21-cm profile was found to vary on short timescales of a few days and models that reproduce the variable 21-cm absorption profile required small-scale variations of the optical depth of the absorber (Kanekar & Chengalur, 2001a).
3.4 Galaxy Morphologies
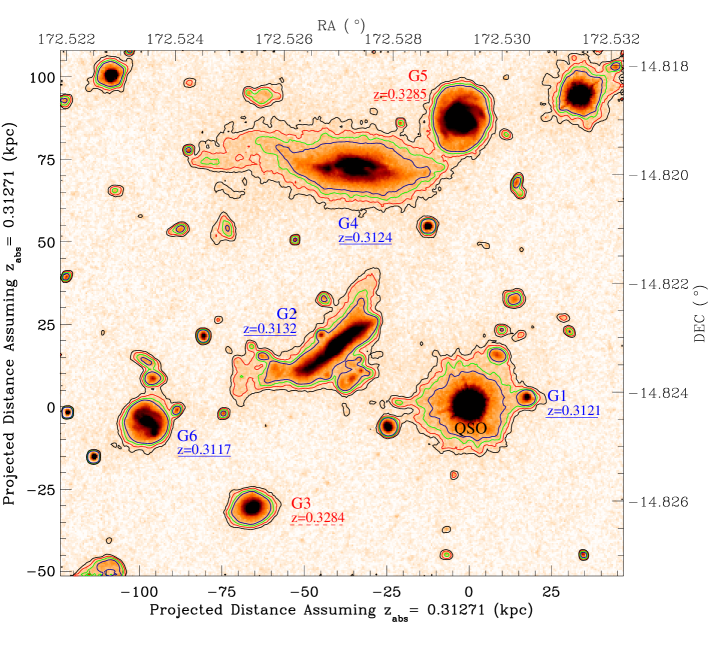
In Figure 7 we show a zoomed-in contour plot of the galaxies in the field. The axes are set to the physical scale at the redshift of the DLA. The WFPC–2 F814W filter is comparable to the rest frame Kron-Cousins R filter at the absorption redshift. Four of the galaxies in the group are visible here along with both galaxies. We plot surface brightness contours ranging between mag arsec-2. The image has a surface brightness limit of mag arcsec-2.
Upon inspecting the galaxies in the group, one notices that both G2 and G4 seem to exhibit tidal disturbances. G2 contains either a strong warp in the disk or tidal tails from previous interactions. The rest-frame -band optical streams extend up to 25 kpc away from the galaxy. These features suggest at least one merger/harassment event. The small galaxy situated below the semi-major axis of G2 in projection does not have a spectroscopic redshift. Using broad band photometry, Chen & Lanzetta (2003) derive a redshift of for this faint object. However, if this object is undergoing an interaction with G2, then its colours may not be consistent with the standard spectral templates used to derive the photometric redshift. The redshift of this galaxy is in need of spectroscopic confirmation.
The S0-like galaxy G4, exhibits a strong dust lane and also has an extended optical stream extending 30 kpc projected in length towards the East from the galaxy center. This potential tidal stream is suggestive of previous interactions, possibly with G2. There are also several unidentified, large, low surface-brightness blobs above and below the stream, which may be associated with the tidal debris or high-redshift low surface brightness galaxies. The asymmetric spiral G6 may have some tidal debris as well since it has some optical structures in its vicinity but they could potentially be galaxies at different redshifts. The morphologies of the galaxies seen here suggest that this group has undergone some interactions in the past.
It has been noted in the literature (Rao et al., 2003), and can be seen here, that there appears to be a significant level of surface brightness (SB) around the quasar. Rao et al. (2003) suggest that the low SB feature is potentially a low SB galaxy that is responsible for the DLA absorption. However, no evidence yet exists to support this possibility. It also remains possible that the emission seen in Figure 7 is associated with the quasar host galaxy, which has extended radio and x-ray emission that overlap quite well with the extended quasar optical emission (see Siemiginowska et al., 2002, 2007). There are many faint galaxies/structures that remain unidentified in this field, several of which reside in close proximity to the quasar line of sight, that may also contribute to the absorption.
Our data suggest that most galaxies in the group have undergone interactions in the past. One way to differentiate between these and the many possible origin scenarios for the DLA gas is by studying the galaxy star formation rates and by comparing the metallicity of the surrounding galaxies and of the absorption.
3.5 Metallicities and Star Formation Rates
In an effort to better understand the origins of the metal-enriched absorption, we compute, when possible, the galaxy star formation rates (SFRs) and metallicities.
We can only compute SFRs for galaxies that have Keck/ESI spectra which have been flux calibrated. The APO/DIS data were taken during poor/cloudy weather conditions and we are unable to flux calibrate them. We compute the galaxy SFRs using the H (Kewley et al., 2002) and [Oii] (Kewley et al., 2004) emission line relations. We do not apply any dust corrections since we are unable to measure the Balmer decrement. We do not apply slit loss corrections. Thus, the SFRs quoted here are lower limits.
By contrast with the SFR calculations, we are able to compute metallicities for additional galaxies using only the equivalent widths of H and Nii emission lines. Since both H and Nii are only Å (at rest wavelengths) apart, the continuum flux levels are approximately the same and are insensitive to dust reddening. Thus, the metallicity indicator NiiH, which is a ratio of emission line fluxes (), becomes just the ratio of equivalent widths. This technique has been demonstrated to work for other metallicity indicators such as (see Kobulnicky & Phillips, 2003). We apply the metallicity relation from Pettini & Pagel (2004), where 12log(O/H). Note that the metallicity indicator becomes unreliable above roughly solar since the index saturates as nitrogen becomes the dominant coolant (see Erb et al., 2006, and references therein). We assume a solar oxygen abundance of log(O/H) (Holweger, 2001). The star formation rates and metallicities are listed in Table 5.
For the group we are able to measure star formation rates for galaxies G2 and G4. For G2 we compute SFR([Oii])=0.44 M⊙ yr-1 and SFR(H)=1.52 M⊙ yr-1. For G4 we compute SFR([Oii])=0.045 M⊙ yr-1. Again, we have not applied any dust corrections which is probably the source of the difference between the SFRs derived from H and [Oii]; the H SFR is more reliable since it is less affected by dust extinction than [Oii]. Since the galaxy SFRs are not corrected for dust extinction, the SFRs quoted are lower limits. We note that both of these galaxies have typical SFRs and are not likely to have strong winds. Even if dust corrections were applied, it would at most increase the SFRs by a factor of which is still lower than expected for galaxies with strong winds. The S0-like morphology of G4 is consistent with low SFRs and no strong outflow winds. Given that G2 and G4 are the brightest galaxy group members closest to the quasar LOS, it is unlikely that the absorption is coming from winds. We can compute the metallicities for three of the galaxies in the group: [O/H] for G2, [O/H] for G6, and a limit of [O/H] for G14. These galaxies are roughly solar in abundance except for G14 which is less than 1/2 solar.
The DLA absorption metallicity was initially derived from the amount of photoelectric absorption due to metals present in the quasar X-ray spectrum. The derived metallicity ranged from zero to solar (Bechtold et al., 2001; Turnshek et al., 2003). Although, zero metallicity is unlikely due to the observed metal lines in absorption (Figure 6), it can only be concluded that there is no evidence for a relatively high metallicity DLA (Turnshek et al., 2003). Kanekar et al. (2009) used STIS E230M quasar spectra to compute the absorption metallicity using the Znii and lines. Zn abundance measurements give metallicity estimates relatively free of depletion effects since Zn is relatively undepleted on to dust grains. Kanekar et al. (2009) compute a metallicity of the DLA to be [Zn/H] relative to solar.
To compare the metallicity of this DLA to the general population of DLAs, we use the work of Kulkarni et al. (2005) who computed the N(Hi)-weighted mean [Zn/H] metallicity for 20 DLAs between . They derived a mean [Zn/H] for their maximum-limits sample, [Zn/H] for their minimum-limits sample. The maximum-limits sample treats the Zn limits as detections and the minimum-limits sample treats the Zn limits as zeros. The Q1127145 DLA has roughly typical metallicity.
To summarize the metallicity comparison, we find that the gas in absorption is relatively metal poor compared to the galaxies for which we could compute metallicities. We obtain roughly solar metallicity for the galaxies and 1/10th solar for the absorption system.
For the galaxy pair, we compute the SFR for G5 using the H emission lines resulting in a SFR(H) M⊙ yr-1. The galaxy has a SFR much lower than would be expected for strong outflows (Weiner et al., 2009). We are able to measure the metallicities for both galaxies (G3 and G5) associated with the absorption. G3 has a [O/H] and G5 has a [O/H]. That is, the galaxies have similar metallicity which is approximately solar. Unfortunately, since the absorption system is quite weak, we cannot measure an absorption metallicity for this system for direct comparison. Furthermore, from the HST/FOS G160L quasar spectrum (see Rao & Turnshek, 2000) it is apparent that the Ly absorption is embedded within the DLA Ly absorption and cannot be deblended.
| Gal- | SFR([Oii]) | SFR(H) | 12log(O/H) | [O/H]b |
|---|---|---|---|---|
| axy | M⊙ yr-1 | M⊙ yr-1 | ||
| G3 | ||||
| G5 | 1.44 | |||
| Group | ||||
| G1 | ||||
| G2 | 0.44 | 1.52 | ||
| G4 | 0.045 | |||
| G6 | ||||
| G14 | 8.43 | 0.31 | ||
bHere [X/Y]=log(X/Y)log(X/Y)⊙.
4 Discussion
4.1 Galaxies
In most circumstances, DLAs are produced from quasar lines of sight passing either through or near isolated galaxies (e.g., Lacy et al., 2003; Møller et al., 2002; Rao et al., 2003; Chun et al., 2006). However, in the case of the DLA, the environment is more complex. Here we find a group of galaxies associated with the DLA system containing at least five members with a velocity dispersion km s-1 offset km s-1 blueward of the Mgii absorption redshift. The DLA associated with the group has Å. The group as a luminosity range of and an impact parameter range of kpc. The galaxy redshift distribution is consistent with the Mgii absorption velocity distribution, along with the other metals. Furthermore, measured projected rotation curves of two of the galaxies (G2 and G4) also cover the entire absorption velocity range.
From the derived galaxy emission line metallicities and the DLA absorption metallicity, at first it appears unlikely that the absorption is produced by metal-enriched winds or tidal debris from these two galaxies. Recent metallicity gradient measurements, derived from local early type galaxies, have been shown to be quite shallow and extend for several galaxy effective radii; Spolaor et al. (2010) find an average stellar absorption metallicity gradient of per effective radius for their sample. G2 has an effect radius of kpc (Kacprzak et al., 2007) which, with this metallicity gradient, would imply that the metallicity at the quasar line of sight would be [O/H]. Although the errors are large, this is consistent with the absorption system metallicity observed. This result is similar for G6. Thus, it is possible that the absorption is produced by an extended disk that has a shallow metallicity gradient. However, it has not been demonstrated that these metallicity gradients can be smoothly extrapolated beyond a few disk effective radii into the halo.
The only other direct comparison of galaxy emission line and quasar absorption line metallicity was by Bowen et al. (2005) at redshift . The DLA has an impact parameter of 3.3 kpc from the absorbing dwarf galaxy and the galaxy and the DLA have very similar metallicities, perhaps implying a relatively flat radial abundance gradient. This makes it difficult to determine if the gas originates in the galaxy disk or outflows. Chen et al. (2005) attempted to compare host galaxy/absorber metallicities for three systems and found that the galaxy metallicity derived from [O/H] greater than the absorption metallicity derived from [Fe/H]. They proposed radial metallicity gradients to explain their results. However, these results remain uncertain because the absorption metallicities were derived using iron, which has variable degree of dust depletion. Undepleted elements such as Zn provide much more robust metallicity estimates which can be more reliably compared to [O/H] metallicities derived for galaxies.
The outflow scenario is supported by Bouché et al. (2006) who found a statistical anti-correlation between Mgii absorption-line equivalent width and the mass of the halo hosting the absorbers by cross-correlating absorbers with luminous red galaxies in the SDSS. They claim that this is direct evidence that absorbers are not virialized in gaseous halos of the galaxies. They suggest that the strongest absorbers – those with (2796) 2 Å, somewhat stronger than the one associated with the group – are statistically more likely to trace super-winds.
Strong winds can be seen directly in absorption. For example, stacking 1400 DEEP2 galaxy spectra at 1.4, Weiner et al. (2009) found 300–1000 km/s winds in Mgii and Mgi absorption in galaxies with high SFRs and that both Mgii equivalent width and the outflow velocities are correlated with galaxy SFRs. At lower redshifts (0.6), Tremonti et al. (2007) reported Mgii absorption blueshifted 500–2000 km/s relative to 14 post-starburst host galaxies. Although some of these systems may not be DLAs, Rao et al. (2006) showed that 35% of (MgII-selected) absorbers with Mgii and Feii Å are DLAs. We find low SFRs in the two brightest galaxy members of the group (G2 and G4) and would not expect to see strong winds as discussed above. However, we do not have SFR estimates for galaxy G1 which is at the closet projected distance to the quasar line of sight. If this faint galaxy has/had high SFRs, then according to the Bouché et al. (2006) results, this galaxy may have a high probability of being a major contributor to the Mgii absorption. If the gas was traveling at moderate wind speeds of 100 km s-1 then it would only take Gyr to reach the quasar line of sight from G1. Though this is a plausible argument, the tidal features seen for galaxies G2 and G4 suggest a different story.
This is not the first group discovered to be associated with Mgii absorption. Whiting et al. (2006) detected a group of five galaxies () with a velocity dispersion of km s-1 associated with a Mgii absorption system with a velocity width of 250 km s-1. Four of the five galaxies have impact parameters less than 100 kpc with the smallest at 51.2 kpc. They report that it is difficult to associate a given galaxy to the absorption system and that debris produced by interactions may be producing the absorption. DLAs originating from tidal gas in galaxy groups are further supported by Nestor et al. (2007) who found that very strong Mgii absorbers often arise in fields with multiple galaxies in close proximity to the quasar LOS. They do not have galaxy redshifts in the quasar fields, yet they argue that the likely origin of the high equivalent width Mgii absorption is kinematically disturbed gas around interacting galaxies. However, both studies used only ground based imaging and were not able to directly study the morphologies of the group members.
For the galaxy group, two of the brightest members (G2, G4, and possibly G6) exhibit perturbed morphologies and several extended optical streams. These streams extend for kpc and may reflect the recent merger/interaction history of this galaxy group; they may comprise tidal debris. The interactions producing the tidal debris seen here may also be responsible for producing the complex absorption system. The absorption could arise directly from the tidal debris or from dwarf galaxies that form in these tidal tails (Knierman et al., 2003).
Physical properties of the DLA absorbing gas are further constrained by Kanekar et al. (2009) who derived a 21-cm gas covering fraction of 0.9 and a gas spin temperature of K. Spin temperatures of K are typical for local spiral galaxies and the Milky Way. Higher spin temperatures are associated with smaller objects such as dwarf galaxies, low surface brightness galaxies, or objects with low metallicity/pressure that have a larger fraction of warm gas and where physical conditions are not suitable for producing the cold phase of HI (Wolfire et al., 1995). However, the majority of DLAs (including the DLA) have far higher spin temperatures: K (Carilli et al., 1996; Kanekar et al., 2009). It has been debated that the high temperature estimates for DLAs may arise due to the difference between radio and optical gas covering fractions (Curran et al., 2005) and/or wavelength dependent beam size or sightline (Wolfe et al., 2003). Although these effects may play a role, a recently reported correlation between DLA [Z/H] and may suggest that there is no wavelength dependence on the observations (Kanekar et al., 2009). Given the large extended structure observed in the radio for the Q1127145 quasar, including the radio jet, it is possible this system may suffer from such wavelength dependent effect, thereby making it difficult to compare optical and 21-cm absorption data. It has been mentioned in the literature that quasar Q1127145 is a peculiar case, since it has a rather large 21-cm absorption profile velocity width and a high spin temperature (Kanekar & Chengalur, 2001b), suggesting that this system is different from standard DLAs. Thus, it is plausible that the both the optical and 21-cm absorption may arise in structures such as tidal streams, infall and/or outflows.
The full velocity range of 350 km s-1 for the Mgii absorption profiles (along with Feii) remain difficult to reproduce in kinematic models. The cloud velocity distribution simulations of Prochaska & Wolfe (1997) suggest that DLA velocity profiles are driven by rapidly-rotating thick disks. Also, 21-cm observations of low-mass galaxies, such as the Large Magellanic Cloud, display lower velocity widths than observed for typical DLAs (Prochaska et al., 2002). This supports the idea that DLAs are massive rotating extended disks of galaxies. However, hydrodynamical simulations of Haehnelt et al. (1998) showed that irregular protogalactic clumps can reproduce the DLA absorption-line velocity width distribution equally well. They conclude that the absorption velocity widths can be driven by a variety of structures, which are a superposition of rotation, random motions, infall, and merging. Additional 21-cm studies of Zwaan et al. (2008) demonstrated that the DLA velocity widths do not originate from rotating gas disks of galaxies similar to those seen in the local universe. These results further support that DLAs are often associated with tidal gas produced by galaxy interactions or superwinds and outflows.
Given the data we have acquired, and the arguments that we have presented, we favor the interpretation that the DLA absorption arises from tidal debris produced by galaxy interactions, which are likely more important in the group environment we have identified. However, we cannot completely rule out other scenarios such as outflows originating from the galaxy group members, faint unidentified galaxies near the quasar LOS, or small satellite galaxies in front of the quasar LOS.
4.2 Galaxies
The pair of galaxies is associated with a weak Mgii absorption system. Both galaxies, G3 and G5, are within the fiducial Mgii halo size of 100 kpc. G5 is roughly 2.5 times more luminous than G3. Both galaxies have velocities that are consistent with the absorption velocities (see Figure 4), which makes it difficult to associate one particular galaxy to the absorption system. The SFR of G5 is typical of a normal spiral galaxy and would not be expected to have strong outflows (e.g., Heckman, 2002, 2003; Weiner et al., 2009).
Both galaxies have similar metallicities which are roughly solar. Even if we had the metallicity of the absorption system we would not be able to identify the host galaxy. For reference, Narayanan et al. (2008) analyzed 100 weak Mgii absorbers and found, using ionization modeling, that the metallicity in a significant fraction of systems are constrained to values of solar or higher. If this was true for this particular case, both galaxies would be in agreement with the absorption metallicity. There is no clear evidence of strong disruptions in the morphology of either galaxy, indicating no recent merger or interaction activity. Given that the absorption system is very weak, it could arise in a wide array of structures associated with the environment of the pair of galaxies.
5 Conclusions
We have performed a spectroscopic galaxy survey to limiting magnitude of ( at ) within 100100′′ of the quasar Q1127145. This field has a large number of bright galaxies near the quasar line of sight and has three Mgii absorption systems detected in the quasar spectrum, including one DLA. Here we have obtained spectroscopic redshifts for eight galaxies in this field, adding to the four previously identified (Bergeron & Boissé, 1991; Guillemin & Bergeron, 1997; Kacprzak et al., 2010).
Our main results can be summarized as follows:
-
1.
We have identified two galaxies (G6 and G14) associated with the DLA at , which, in addition to the three known galaxies, form a group of at least five galaxies. The group has a luminosity range of and an impact parameter range of kpc. The group velocity dispersion is km s-1 having a full velocity range of km s-1. The group redshift is offset km s-1 blueward of the Mgii absorption redshift. The galaxy redshift distribution spans the entire range of the absorption velocities. Furthermore, the rotation curves of G2 and G4 alone cover the entire range of absorption velocities.
Star formation rates of two of the brightest galaxy members are too low to drive strong winds, reducing the likelihood that winds are responsible for the absorbing gas. Metal enriched winds are also unlikely since the DLA metallicity is 1/10th solar, whereas three of the five galaxies have metallicities range between less than 1/2 solar to solar. Although stellar metallicity gradients in the literature are consistent with our findings, it is has yet to be demonstrated that these gradients can be extrapolated to 50 kpc. The favored scenario for the origin of the absorption is from tidal debris. The deep WFPC–2 F814W imaging shows the perturbed morphologies for three galaxies and optical tidal tails extending kpc away from the disks. These features suggest merger/harassment events, consistent with the more frequent galaxy harassment/merging expected in the group environment we have identified.
-
2.
We have identified a galaxy (G3), in addition to previously identified G5 (Kacprzak et al., 2010), associated with the weak Mgii absorption system, Å. There is no evidence of recent interactions since both galaxies have unperturbed morphologies and they are separated by 140 kpc. Even armed with the star-formation rate and rotation velocities of G5 and the metallicities of both galaxies, it remains difficult to determine which galaxy hosts the absorber. We can only conclude that this weak absorption system can arise in a variety of cosmic structures in either or both halos of the galaxy pair.
-
3.
We have identified five galaxies (G7, G9, G11, G12, and G15) with that are not associated with any detectable Mgii absorption (3 detection limits of mÅ). These galaxies appear to be normal star-forming spiral disks. All non-absorbing galaxies have impact parameters kpc. This is consistent with previous results on Mgii halo sizes, which suggest we should not expect to detect absorption beyond impact parameters of kpc.
The DLA-galaxy group at is quite different from the standard examples in literature of DLA-plus-(apparently) isolated galaxy (e.g., Lacy et al., 2003; Møller et al., 2002; Rao et al., 2003; Chun et al., 2006). The group of galaxies associated with the DLA suggests that interactions, which are common in groups of galaxies, might be responsible for at least some DLA absorption systems as well. This may explain why searches for host galaxies of DLAs and strong Mgii systems have a low success rate of 30–40% using small field of view IFUs (e.g., Bouché et al., 2007). It is likely that we need to survey further out from the quasar line of sight if there are many other cases where tidal debris produces the absorption. It is also interesting to note that if this galaxy group was at a slightly higher redshift, we would not be able to detect the 0.04 galaxy that is closest to the quasar line of sight, which could even be the DLA host. Given the low redshift of the DLA and even using the deep HST imaging, star formation rates, and metallicities, it is difficult to understand this complex system and determine the origins of the absorbing gas. We emphasize that we should take caution in concluding the origins of absorbing gas drawn from studies of individual DLAs at higher redshifts.
Acknowledgments
We thank Frank Briggs for his useful comments and for carefully reading this paper. We thank Greg Wirth for his help and advice with ESI/Keck. MTM thanks the Australian Research Council for a QEII Research Fellowship (DP0877998). CWC was supported by the National Science Foundation under Grant Number AST-0708210. This work is based on observations obtained with the Apache Point Observatory 3.5-meter telescope, which is owned and operated by the Astrophysical Research Consortium. Observations were also made with the NASA/ESA Hubble Space Telescope, or obtained from the data archive at the Space Telescope Institute. Other observations were made with the ESO Very Large Telescope at the Paranal Observatories. Based on observations made with the NASA/ESA Hubble Space Telescope, and obtained from the Hubble Legacy Archive, which is a collaboration between the Space Telescope Science Institute (STScI/NASA), the Space Telescope European Coordinating Facility (ST-ECF/ESA) and the Canadian Astronomy Data Centre (CADC/NRC/CSA). Some of the data presented herein were obtained at the W.M. Keck Observatory, which is operated as a scientific partnership among the California Institute of Technology, the University of California and the National Aeronautics and Space Administration. The Observatory was made possible by the generous financial support of the W.M. Keck Foundation.
References
- Barton & Cooke (2009) Barton, E. J., & Cooke, J. 2009, AJ, 138, 1817
- Bechtold et al. (2001) Bechtold, J., Siemiginowska, A., Aldcroft, T. L., Elvis, M., & Dobrzycki, A. 2001, ApJ, 562, 133
- Bergeron (1986) Bergeron, J. 1986, A&A, 155, L8
- Bergeron (1988) Bergeron, J. 1988, Large Scale Structures of the Universe, 130, 343
- Bergeron & Boissé (1991) Bergeron, J., & Boissé, P. 1991, A&A, 243, 334
- Bertin & Arnouts (1996) Bertin, E., & Arnouts, S. 1996, A&AS, 117, 393
- Bouché et al. (2006) Bouché, N., Murphy, M. T., Péroux, C., Csabai, I. & Wild. V. 2006 MNRAS, 371, 495
- Bouché et al. (2007) Bouché, N., Murphy, M. T., Péroux, C., Davies, R., Eisenhauer, F., Förster Schreiber, N. M., & Tacconi, L. 2007, ApJL, 669, L5
- Bowen et al. (2005) Bowen, D. V., Jenkins, E. B., Pettini, M., & Tripp, T. M. 2005, ApJ, 635, 880
- Burkert & Lin (2000) Burkert, A., & Lin, D. N. C. 2000, ApJ, 537, 270
- Carilli et al. (1996) Carilli, C. L., Lane, W., de Bruyn, A. G., Braun, R., & Miley, G. K. 1996, AJ, 111, 1830
- Chelouche et al. (2008) Chelouche, D., Ménard, B., Bowen, D. V., & Gnat, O. 2008, ApJ, 683, 55
- Chen et al. (2005) Chen, H.-W., Kennicutt, R. C., Jr., & Rauch, M. 2005, ApJ, 620, 703
- Chen & Lanzetta (2003) Chen, H.-W. & Lanzetta, K. M. 2003, ApJ, 597, 706
- Chen & Tinker (2008) Chen, H.-W., & Tinker, J. L. 2008, ApJ, 687, 745
- Chengalur & Kanekar (2000) Chengalur, J. N., & Kanekar, N. 2000, MNRAS, 318, 303
- Chun et al. (2006) Chun, M. R., Gharanfoli, S., Kulkarni, V. P., & Takamiya, M. 2006, AJ, 131, 686
- Churchill, Kacprzak, & Steidel (2005) Churchill, C. W., Kacprzak, G. G., & Steidel, C. C. 2005, in Probing Galaxies through Quasar Absorption Lines, IAU 199 Proceedings, eds. P. R. Williams, C.–G. Shu, & B. Ménard (Cambridge: Cambridge University Press), p. 24
- Churchill et al. (2000a) Churchill, C. W., Mellon, R. R., Charlton, J. C., Jannuzi, B. T., Kirhakos, S., Steidel, C. C., & Schneider, D. P. 2000a, ApJS, 130, 91
- Churchill et al. (2000b) Churchill, C. W., Mellon, R. R., Charlton, J. C., Jannuzi, B. T., Kirhakos, S., Steidel, C. C., & Schneider, D. P. 2000b, ApJ, 543, 577
- Churchill et al. (1999) Churchill, C. W., Rigby, J. R., Charlton, J. C., & Vogt, S. S. 1999, ApJS, 120, 51
- Churchill, Steidel, & Vogt (1996) Churchill, C. W., Steidel, C. C., & Vogt, S. S. 1996, ApJ, 471, 164
- Churchill & Vogt (2001) Churchill, C. W., & Vogt, S. S. 2001, AJ, 122, 679
- Curran et al. (2005) Curran, S. J., Murphy, M. T., Pihlström, Y. M., Webb, J. K., & Purcell, C. R. 2005, MNRAS, 356, 1509
- Chynoweth et al. (2008) Chynoweth, K. M., Langston, G. I., Yun, M. S., Lockman, F. J., Rubin, K. H. R., & Scoles, S. A. 2008, AJ, 135, 1983
- Dekker et al. (2000) Dekker, H., D’Odorico, S., Kaufer, A. Delabre, B. & Kotzlowski H. 2000, SPIE, 4008, 534
- Ellison et al. (2003) Ellison, S. L., Mallén-Ornelas, G., & Sawicki, M. 2003, ApJ, 589, 709
- Erb et al. (2006) Erb, D. K., Steidel, C. C., Shapley, A. E., Pettini, M., Reddy, N. A., & Adelberger, K. L. 2006, ApJ, 646, 107
- Faber et al. (2007) Faber, S. M., et al. 2007, ApJ, 665, 265
- Fraternali et al. (2002) Fraternali, F., van Moorsel, G., Sancisi, R., & Oosterloo, T. 2002, AJ, 123, 312
- Guillemin & Bergeron (1997) Guillemin p., & Bergeron, J. 1997, A&A, 328, 499
- Haehnelt et al. (1998) Haehnelt, M. G., Steinmetz, M., & Rauch, M. 1998, ApJ, 495, 647
- Heckman (2002) Heckman, T. M. 2002, Extragalactic Gas at Low Redshift, 254, 292
- Heckman (2003) Heckman, T. M. 2003, Revista Mexicana de Astronomia y Astrofisica Conference Series, 17, 47
- Holweger (2001) Holweger, H. 2001, Joint SOHO/ACE workshop ”Solar and Galactic Composition”, 598, 23
- Kacprzak et al. (2008) Kacprzak, G. G., Churchill, C. W., Steidel, C. C., & Murphy, M. T. 2008, AJ, 135, 922
- Kacprzak et al. (2007) Kacprzak, G. G., Churchill, C. W., Steidel, C. C., Murphy, M. T., & Evans, J. L 2007, ApJ, 662, 909
- Kacprzak et al. (2010) Kacprzak, G. G., Churchill, C. W., Ceverino, D., Steidel, C. C., Klypin, A., & Murphy, M. T. 2010, ApJ, 711, 533
- Kanekar & Chengalur (2001b) Kanekar, N., & Chengalur, J. N. 2001b, A&A, 369, 42
- Kanekar & Chengalur (2001a) Kanekar, N., & Chengalur, J. N. 2001a, MNRAS, 325, 631
- Kanekar et al. (2009) Kanekar, N., Smette, A., Briggs, F. H., & Chengalur, J. N. 2009, ApJl, 705, L40
- Kaufmann et al. (2009) Kaufmann, T., Bullock, J. S., Maller, A. H., Fang, T., & Wadsley, J. 2009, MNRAS, 396, 191
- Kewley et al. (2004) Kewley, L. J., Geller, M. J., & Jansen, R. A. 2004, AJ, 127, 2002
- Kewley et al. (2002) Kewley, L. J., Geller, M. J., Jansen, R. A., & Dopita, M. A. 2002, AJ, 124, 3135
- Kim, Goobar, & Perlmutter (1996) Kim, A., Goobar, A., & Perlmutter, S. 1996, PASP, 108, 190
- Kinney et al. (1996) Kinney, A. L., Calzetti, D., Bohlin, R. C., McQuade, K., Storchi–Bergmann, T. & Schmitt, H. R. 1996, ApJ, 467, 38
- Knierman et al. (2003) Knierman, K. A., Gallagher, S. C., Charlton, J. C., Hunsberger, S. D., Whitmore, B., Kundu, A., Hibbard, J. E., & Zaritsky, D. 2003, AJ, 126, 1227
- Kobulnicky & Phillips (2003) Kobulnicky, H. A., & Phillips, A. C. 2003, ApJ, 599, 1031
- Kulkarni et al. (2005) Kulkarni, V. P., Fall, S. M., Lauroesch, J. T., York, D. G., Welty, D. E., Khare, P., & Truran, J. W. 2005, ApJ, 618, 68
- Lacy et al. (2003) Lacy, M., Becker, R. H., Storrie-Lombardi, L. J., Gregg, M. D., Urrutia, T., & White, R. L. 2003, AJ, 126, 2230
- Lane et al. (1998) Lane, W., Smette, A., Briggs, F., Rao, S., Turnshek, D., & Meylan, G. 1998, AJ, 116, 26
- Lanzetta & Bowen (1990) Lanzetta, K. M., & Bowen, D. 1990, ApJ, 357, 321
- Lanzetta & Bowen (1992) Lanzetta, K. M. & Bowen, D. V. 1992, ApJ, 391, 48L
- Le Brun et al. (1993) Le Brun, V., Bergeron, J., Boisse, P., & Christian, C. 1993, A&A, 279, 33
- Lin & Murray (2000) Lin, D. N. C., & Murray, S. D. 2000, ApJ, 540, 170
- Lopez et al. (2008) Lopez, S., et al. 2008, ApJ, 679, 1144
- Maller & Bullock (2004) Maller, A. H., & Bullock, J. S. 2004, MNRAS, 355, 694
- Matteucci et al. (1997) Matteucci, F., Molaro, P., & Vladilo, G. 1997, A&A, 321, 45
- Ménard et al. (2009) Ménard, B., Wild, V., Nestor, D., Quider, A., & Zibetti, S. 2009, arXiv:0912.3263
- Mo & Miralda-Escude (1996) Mo, H. J., & Miralda-Escude, J. 1996, ApJ, 469, 589
- Møller et al. (2002) Møller, P., Warren, S. J., Fall, S. M., Fynbo, J. U., & Jakobsen, P. 2002, ApJ, 574, 51
- Mulchaey & Zabludoff (1998) Mulchaey, J. S., & Zabludoff, A. I. 1998, ApJ, 496, 73
- Narayanan et al. (2007) Narayanan, A., Misawa, T., Charlton, J. C., & Kim, T.-S. 2007, ApJ, 660, 1093
- Narayanan et al. (2008) Narayanan, A., Charlton, J. C., Misawa, T., Green, R. E., & Kim, T.-S. 2008, ApJ, 689, 782
- Nestor et al. (2002) Nestor, D. B., Rao, S. M., Turnshek, D. A., Monier, E., Lane, W. M., & Bergeron, J. 2002, Extragalactic Gas at Low Redshift, 254, 34
- Nestor et al. (2007) Nestor, D. B., Turnshek, D. A., Rao, S. M., & Quider, A. M. 2007, ApJ, 658, 185
- Padilla et al. (2009) Padilla, N., Lacerna, I., Lopez, S., Barrientos, L. F., Lira, P., Andrews, H., & Tejos, N. 2009, MNRAS, 395, 1135
- Pettini & Pagel (2004) Pettini, M., & Pagel, B. E. J. 2004, MNRAS, 348, L59
- Pollack et al. (2009) Pollack, L. K., Chen, H.-W., Prochaska, J. X., & Bloom, J. S. 2009, ApJ, 701, 1605
- Prochaska et al. (2002) Prochaska, J. X., Ryan-Weber, E., & Staveley-Smith, L. 2002, PASP, 114, 1197
- Prochaska & Wolfe (1998) Prochaska, J. X., & Wolfe, A. M. 1998, ApJ, 507, 113
- Prochaska & Wolfe (1997) Prochaska, J. X., & Wolfe, A. M. 1997, ApJ, 487, 73
- Puche et al. (1992) Puche, D., Westpfahl, D., Brinks, E., & Roy, J. 1992, AJ, 103, 1841
- Rand (2000) Rand, R. 2000, ApJ, 537, 13
- Rao et al. (2006) Rao, S. M., Turnshek, D. A., & Nestor, D. B. 2006, ApJ, 636, 610
- Rao et al. (2003) Rao, S. M., Nestor, D. B., Turnshek, D. A., Lane, W. M., Monier, E. M., & Bergeron, J. 2003, ApJ, 595, 94
- Rao & Turnshek (2000) Rao, S. M., & Turnshek, D. A. 2000, ApJS, 130, 1
- Rigby, Charlton, & Churchill (2002) Rigby, J. R., Charlton, J. C., & Churchill, C. W. 2002, ApJ, 565, 743
- Rubin et al. (2009a) Rubin, K. H. R., Prochaska, J. X., Koo, D. C., Phillips, A. C., & Weiner, B. J. 2009a, arXiv:0907.0231
- Rubin et al. (2009b) Rubin, K. H. R., Weiner, B. J., Koo, D. C., Martin, C. L., Prochaska, J. X., Coil, A. L., & Newman, J. A. 2009b, arXiv:0912.2343
- Sancisi et al. (2008) Sancisi, R., Fraternali, F., Oosterloo, T., & van der Hulst, T. 2008, A&A Rev., 15, 189
- Siemiginowska et al. (2002) Siemiginowska, A., Bechtold, J., Aldcroft, T. L., Elvis, M., Harris, D. E., & Dobrzycki, A. 2002, ApJ, 570, 543
- Siemiginowska et al. (2007) Siemiginowska, A., Stawarz, Ł., Cheung, C. C., Harris, D. E., Sikora, M., Aldcroft, T. L., & Bechtold, J. 2007, ApJ, 657, 145
- Spolaor et al. (2010) Spolaor, M., Kobayashi, C., Forbes, D. A., Couch, W. J., & Hau, G. T. 2010, MNRAS, submitted
- Steidel et al. (2002) Steidel, C. C., Kollmeier, J. A., Shapely, A. E., Churchill, C. W., Dickinson, M., & Pettini, M. 2002, ApJ, 570, 526
- Steidel et al. (1997) Steidel, C. C., Dickinson, M., Meyer, D. M., Adelberger, K. L., & Sembach, K. R. 1997, ApJ, 480, 586
- Steidel, Dickinson, & Persson (1994) Steidel, C. C., Dickinson, M., & Persson, S. E. 1994, ApJ, 437, L75
- Steidel & Sargent (1992) Steidel, C. C., & Sargent, W. L. W. 1992, ApJs, 80, 1
- Swaters, Sancisi & van der Hulst (1997) Swaters, R. A., Sancisi, R., & van der Hulst, J. M. 1997, ApJ, 491, 140
- Tinker & Chen (2008) Tinker, J. L., & Chen, H.-W. 2008, ApJ, 679, 1218
- Tremonti et al. (2007) Tremonti, C. A., Moustakas, J., & Diamond-Stanic, A. M. 2007, ApJL, 663, L77
- Turnshek et al. (2003) Turnshek, D. A., Rao, S. M., Ptak, A. F., Griffiths, R. E., & Monier, E. M. 2003, ApJ, 590, 730
- Weiner et al. (2009) Weiner, B. J., et al. 2009, ApJ, 692, 187
- Wolfe et al. (2003) Wolfe, A. M., Gawiser, E., & Prochaska, J. X. 2003, ApJ, 593, 235
- Wolfe et al. (1986) Wolfe, A. M., Turnshek, D. A., Smith, H. E., & Cohen, R. D. 1986, ApJS, 61, 249
- Wolfire et al. (1995) Wolfire, M. G., Hollenbach, D., McKee, C. F., Tielens, A. G. G. M., & Bakes, E. L. O. 1995, ApJ, 443, 152
- Whiting et al. (2006) Whiting, M. T., Webster, R. L., & Francis, P. J. 2006, MNRAS, 368, 341
- York et al. (1986) York, D. G., Dopita, M., Green, R., & Bechtold, J. 1986, ApJ, 311, 610
- Zibetti et al. (2007) Zibetti, S., Ménard, B., Nestor, D. B., Quider, A. M., Rao, S. M., & Turnshek, D. A. 2007, ApJ, 658, 161
- Zabludoff & Mulchaey (1998) Zabludoff, A. I., & Mulchaey, J. S. 1998, ApJ, 496, 39
- Zwaan et al. (2008) Zwaan, M., Walter, F., Ryan-Weber, E., Brinks, E., de Blok, W. J. G., & Kennicutt, R. C. 2008, AJ, 136, 2886