Lithium factories in the Galaxy: novae and AGB stars
Abstract
We review the state of the art in modelling lithium production, through the Cameron–Fowler mechanism, in two stellar sites: during nova explosions and in the envelopes of massive asymptotic giant branch (AGB) stars. We also show preliminary results concerning the computation of lithium yields from super–AGBs, and suggest that super–AGBs of metallicity close to solar may be the most important galactic lithium producers. Finally, we discuss how lithium abundances may help to understand the modalities of formation of the “second generation” stars in globular clusters.
keywords:
Stars: AGB and post-AGB, novae; convection, nuclear reactions, nucleosynthesis; Globular Clusters: general1 Introduction
Although lithium is very fragile, its galactic abundance increases from (Li)111 we use the notation (Li)= 2.2 at the surface of Population (Pop) II stars to (Li)3.3 or more in Pop I. Even if lithium is hidden in the atmospheres of Pop II, and its true primordial abundance is 2.7, a galactic production by 0.7dex is necessary.
The mechanism responsible for lithium production has been proposed by [Cameron & Fowler (1971), Cameron & Fowler (1971)]: 7Be is produced by fusion of 3He with 4He, and rapidly transported to stellar regions where it can be converted into 7Li by k–capture. Notice, then, that the lithium production may last only until there is 3He available in the region of burning, and that the production ends when the 3He is all consumed.
There are two main physical situations where this mechanism can produce enough lithium that it is important to investigate their role in the galactic production: the first one is the explosive hydrodynamical formation during the outbursts of novae ([Arnould & Norgaard(1975), Arnould & Norgaard 1975], [Starrfield et al. (1978), Starrfield et al. 1978]), the second one is the hydrostatic, slow formation in the envelopes of asymptotic giant branch (AGB) stars, for which it was first proposed. In envelope models of AGB stars ([Scalo et al. (1975), Scalo et al. 1975]), in which the bottom of the convective envelope reaches the hydrogen burning layers, and its temperature (Tbce) becomes as large as Tbce40MK, the 3He(Be chain acts. These models were able to explain the high lithium abundances found in some luminous red giants, and the process took the name of Hot Bottom Burning (HBB).
In Section 2 we will resume the state of the art of the modelling of lithium production during nova outbursts, and in Section 3 we will deal with the AGB models, to understand whether they can account for the lithium galactic evolution. In addition, we will show new models of lithium production in super–AGB stars ([Ventura & D’Antona (2010), Ventura & D’Antona 2010]) and speculate on the possible role of these stars as efficient lithium factories. Finally, in Section 4 we will shortly summarize the problem of lithium in the “second generation” stars of globular clusters. We will not consider here the different, slow mixing process also based on the [Cameron & Fowler (1971)] mechanism and named “cool bottom burning” (e.g. [Nollett et al. (2003), Nollett et al. 2003]). This process can explain the lithium abundances seen in lower luminosity red giants (e.g. [Wasserburg et al. (1995), Wasserburg et al. 1995], [Sackmann & Boothroyd (1999), Sackmann & Boothroyd 1999]), but its physical reasons are not well studied, while the nucleosynthesis in HBB is based on straightforward time–dependent mixing in standard convective regions.
2 Nova outbursts
[Schatzman (1951)] was the first to propose that the isotope 3He could play a role in nova explosion, in the context of a theory of novae powered by thermonuclear detonations. Arnould & Noergaard (1975) proposed that the Cameron–Fowler mechanism, acting at the nova outburst, would produce a lithium abundance proportional to the 3He abundance in the nova envelope. [Starrfield et al. (1978)] showed that the mechanism could be efficient for outburst temperatures 150MK, and the fast ejection of the 7Be rich nova shell leads to 7Li production; they quantified the expected linear relation, between lithium and the 3He initial mass fraction , as:
| (1) |
where is the solar 3He mass fraction. [D’Antona & Matteucci (1991), D’Antona & Matteucci (1991)] modelled the galactic evolution of lithium, including the contribution of novae according to this result. The argument below their modelization was very simple: the nova explosion occurs when a critical hydrogen rich envelope is reached on the white dwarf component of the nova binary, by accretion from its low mass companion. By losing mass, low mass stars expose the stellar regions in which the hydrogen burning p–p chain is incomplete, and thus bring to the surface the 3He accumulated in the envelope during the period preceding the mass transfer phase, and during the (slow) mass transfer phase itself (e.g. [D’Antona & Mazzitelli (1982), D’Antona & Mazzitelli 1982]). Thus [D’Antona & Matteucci (1991)] linked the lithium abundance produced in the outburst to the“delay time” between the formation of the white dwarf and the occurrence of nova outbursts. As a result, mainly the novae containing an “old” white dwarf, and therefore an old and 3He–rich low mass companion contribute to the galactic production of lithium, in agreement with the Li vs. [Fe/H] galactic relation.
Motivated by the [D’Antona & Matteucci (1991)] paper, [Boffin et al. (1993), Boffin et al. (1993)] revisited the influence of 3He on the nova outbursts with simple one–zone models, but found out that equation 1 was a large overestimate, due to two main reasons: 1) the neglect of the reaction in the [Starrfield et al. (1978)] network, and 2) the increasing influence of the competitive reaction when 3He is enhanced in the nova envelope. Consequently, they found a milder dependence on the lithium production on the 3He:
| (2) |
where represents mass fractions, and is the lithium production when the solar 3He abundance is adopted. Afterwards, [Hernanz et al. (1996)] and [Jose & Hernanz (1998)] re-examined the problem with an implicit hydro-code including a full reaction network, able to treat both the hydrostatic accretion phase and the explosion stage. They considered both the case of white dwarfs having a carbon–oxygen core and the case of oxygen– neon cores, showing that C–O cores are more efficient in the lithium production, as they have a shorter accretion phase, so that 3He is not destroyed efficiently, and more 7Be is produced. Overproduction of lithium is found, but its dependence on the initial 3He abundance still follows [Boffin et al. (1993)] prescription. Including this revised lithium production in the galactic chemical evolution model, novae appear to be a modest lithium producer ([Romano et al. (1999), Romano et al. 1999]).
3 Luminous AGB stars
Above a luminosity of , the bottom of the convective envelope during the AGB evolution reaches the H–shell burning region, and the nuclear reaction products are transported to the surface by convection. This is the perfect site of lithium production through the Cameron–Fowler mechanism ([Iben (1973), Iben 1973], [Sackmann et al. (1974), Sackmann et al. 1974]). While we have seen that Tbce40MK is sufficient to produce lithium by HBB, if Tbce becomes larger, other important reactions take place.
About 65MK are necessary to convert carbon to nitrogen. The very luminous (, that is L) lithium–rich giants of the Magellanic Clouds ([Smith & Lambert (1989), Smith & Lambert 1989], [Smith & Lambert (1990), 1990], [Smith et al. (1995), Smith et al. 1995]) are indeed M–stars, and not carbon stars. Their carbon star features may have been lost by CN processing in HBB. Carbon stars in the Clouds, in fact, populate only the region at . Lithium rich – oxygen rich AGB stars embedded in thick circumstellar envelopes have also been discovered in a Galactic sample, in a survey by [García-Hernández et al. (2007)], aimed at obtaining spectroscopy of very massive AGB candidates.
A third possible processing occurs at even larger Tbce(80MK), where H burns through the full CNO cycle. These very high temperatures are reached in low metallicity massive AGBs, and are possibly at the basis of the self– enrichment process in globular clusters ([(40), Ventura et al. 2001]). The oxygen abundance in the envelopes of these AGB stars, and consequently in the matter ejected by wind or planetary nebula, is reduced, as we see in the “anomalous” stars of galactic globular clusters, see Sect.4.
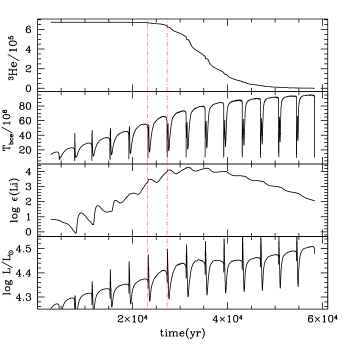
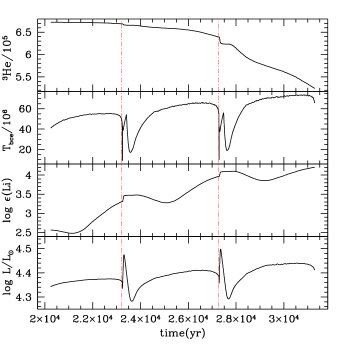
Modelling of lithium rich AGB stars first of all requires to treat non– instantaneous mixing in the envelope, coupling the nuclear reaction network with the mixing process. This can be easily done by treating mixing as a diffusion. In Figure 1 we show the total phase of lithium production in a 5 star of metallicity Z=10-3 (left side), and a zoom of the same figure between two thermal pulses (right side). We see that, when Tbce decreases, due to the ignition of the thermal pulse and the expansion of the envelope, the lithium abundance decreases. We can appreciate the delay time between the physical conditions in the burning region and the surface lithium, due to the non instantaneous mixing. The total phase of lithium production lasts more than 50yr, but the phase in which (Li)3 lasts only yr. Once the initial 3He present in the envelope is depleted, lithium production is over.
Lithium production and destruction depend on
-
1.
the physical inputs, and mainly on the convection model: the higher is the convection efficiency, the larger is Tbce and the larger is the efficiency of HBB (see, e.g. [Ventura & D’Antona (2005), Ventura & D’Antona 2005]);
-
2.
the initial mass (or, better, the initial core mass): it must be large enough to get HBB;
-
3.
the chemical inputs, mainly the metallicity and the envelope opacity. Fixed the mass, the higher is the opacity (or the metallicity) the smaller is Tbce and the lower is the efficiency of HBB.
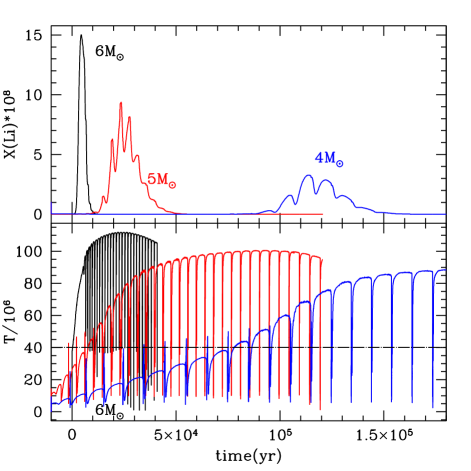
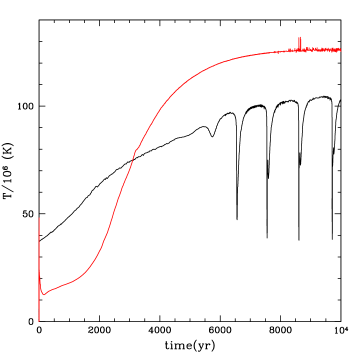
Figure 2 shows the mass dependence for a fixed chemical composition: the larger is the mass, the larger is Tbce and the stronger and faster is lithium production.
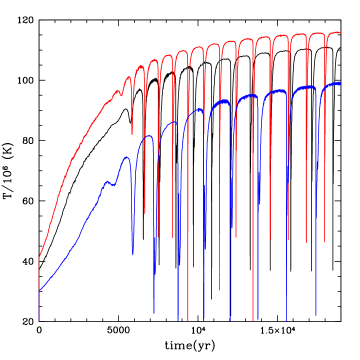
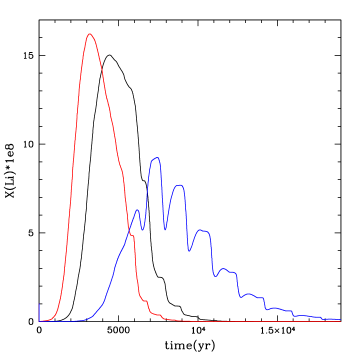
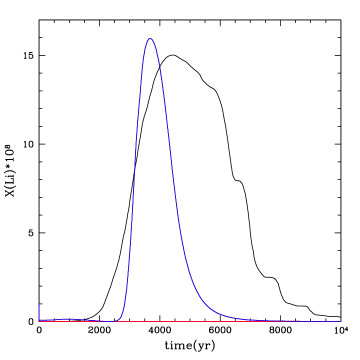
Figure 3 shows the dependence on the metallicity, at fixed mass M=6. Increasing the opacity (and Z), Tbce decreases, and the lithium production is lower but more extended in time.
The computation of lithium production during the super–AGB evolution has been recently achieved by [Ventura & D’Antona (2010), Ventura & D’Antona (2010)] for Z=10-3. The results are very interesting, as we see in Fig. 4 for a mass of 7.5. Lithium achieves very large abundances, due to the very high Tbce, and the Li–rich phase occurs even before the star begins the thermal pulse phase.
Of course ‘production’ does not mean ‘yield’: two ingredients are important: how much lithium is made, and how long it lasts, so that mass loss can recycle it into the interstellar medium. Consequently, the lithium yield is very dependent on the mass loss rate: larger rates during the phase of lithium production provide a higher lithium yield. Unfortunately, mass loss is another great uncertainty in the computation of stellar models. In Figure 6 we show as open (red) circles at [Fe/H]=–1.3 the average lithium abundance in the ejecta of models of 4, 5 and 6 with three different mass loss formulations: the middle points refer to the mass loss rate suggested by Blöcker (1995), who extends Reimers’ recipe to describe the steep increase of mass loss with luminosity as the stars “climb” the AGB. The full expression, for Mira’s periods exceeding 100d, is
| (3) |
where is the free parameter entering the Reimers’ (1977) prescription. In the “standard” models of Fig. 6 we adopt , according to a calibration based on the luminosity function of lithium rich stars in the Magellanic Clouds given in [Ventura et al. (2000), Ventura et al. (2000)]. The highest points in the figure are obtained for the extreme value of , while the models adopting the Vassiliadis & Wood (1993) mass loss rate are the lowest ones. We see then that the absolute values of the lithium yields must be considered highly uncertain (see also [Ventura et al. (2002), Ventura et al. 2002]). The global behaviour of the average lithium abundance in the ejecta, as a function of the initial mass is given in Fig. 5 for the models computed with the standard mass loss (=0.02) prescription and Z=10-3.

Increasing the mass, the average abundance first decreases, due to the faster consumption of 3He, in spite of the larger abundances reached in the phase of production. For the super–AGB masses, the average abundance increases, and may also become very large, both due to the stronger production and to the huge mass loss rate achieved by the largest core masses.
Based on these first computation of the super–AGB phase, we can make a prediction on the lithium galactic evolution: which are the best producers? The larger is the mass, the higher is lithium during the production phase. On the other hand, the shorter is the duration of the Li rich phase, the smaller is the lithium yield. Increasing the metallicity, Tbce becomes smaller, and the duration of the lithium production phase is longer. For large core mass (and thus high luminosity) the mass loss rates become larger and larger. So we should expect that the Li yield is positively correlated both with metallicity and core mass, and that the super–AGB stars of metallicity close to solar are possibly great producers. The possible consequences for galactic Li production are described in the talk by Francesca Matteucci in this book.
4 Lithium and AGB stars in globular clusters
Globular Clusters (GCs) so far examined show spectroscopic evidence for the presence of two stellar generations: a First Generation (FG) having “normal” abundances, similar to those of halo stars of the same metallicity, and a Second Generation (SG) whose abundances are more spreaded, and bear the sign of hot CNO processing, with an often very significative oxygen reduction, evidence for the action of the Ne–Na cycle and sometimes of the Mg–Al cycle (see, e.g. [Gratton et al. (2004), Gratton et al. 2004]). The SG contains at least 50% of the cluster stars (Carretta et al. 2009a,b). At low metallicity, in the most massive AGB stars, Tbce becomes larger than 80MK, and the ON chain of the CNO cycle becomes active. In these envelopes, oxygen is cycled to nitrogen, and its abundance can be dramatically reduced. Thus some models for the formation of the different populations attribute the presence of “anomalous” stars with low oxygen and high sodium, to a SG including matter processed by HBB (e.g. [(40), Ventura et al. 2001]). Other models attribute the formation of the SG to the ejecta of fast rotating massive stars (FRMS, see e.g. [Decressin et al. (2007a), Decressin et al. 2007a]), or even to pollution from gas expelled during highly non conservative evolution of massive binaries ([de Mink et al. (2009), De Mink et al. 2009]), although this latter model in particular can not explain the very high fraction of SG stars present in most of the GCs so far examined.
The lithium yield from AGB stars of different mass may contribute to understand the role (if any) of these stars in the formation of the SG in GCs. It is commonly believed that the polluting matter must be diluted with pristine matter to explain the abundance patterns, such as the Na–O anticorrelation (Prantzos & Carbonnel 2006, D’Antona & Ventura 2007). If the progenitors of the SG stars are massive stars, they have destroyed their original lithium, and the lithium in the SG must be due to the mixing with pristine gas. If instead the progenitors are massive AGB stars, they may have a non negligible lithium yield, that must be taken into account in the explanation of the SG abundances.
Figure 6 shows a compact summary of what we know about lithium abundances in the halo and in GCs in the plane (Li) versus [Fe/H]. The halo stars are plotted as triangles, from [Meléndez et al. (2009), Meléndez et al. (2009)] (their non LTE abundances are plotted). The data for three clusters are added, at their [Fe/H] content, taken from [Carretta et al. (2009c)] scale. The references for the clusters data are in the figure label. Notice that the three open triangles of NGC 6397, at much lower (Li) than the other points, refer to subgiants, in which lithium can be reduced by mixing. Although the data analysis is not homogeneous among the different samples, the figure shows interesting trends. The lithium spread of the halo stars in the range of metallicities of the clusters NGC 6397 and NGC 6752 is very small around a plateau value (Li)2.2. In fact the full triangles at log (Li) are lower mass stars for which depletion is expected ([Meléndez et al. (2009), Meléndez et al. 2009]). The WMAP – big bang nucleosynthesis “standard” abundance, (Li)=2.72 (e.g. [Cyburt et al.(2009), Cyburt et al. 2009]) is much larger than the plateau abundance.
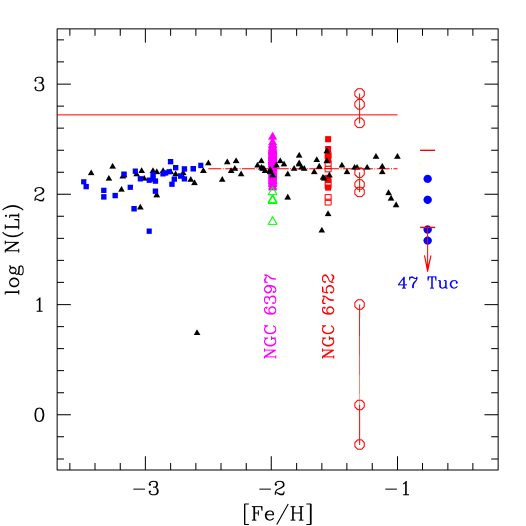
The lithium spread in the clusters appears a bit larger, although [Lind et al. (2009)] point out that in NGC 6397 it is consistent with the observational error. We should expect a larger lithium spread among GC stars if there are SG stars, even if the pollutors’ gas (AGB or massive stars envelopes) has been diluted with pristine gas ([Decressin et al. (2007b), Decressin et al. 2007b], [Prantzos et al. (2007), Prantzos et al. 2007]). The dilution is very plausible if there is a direct correlation between lithium and sodium abundances, as convincingly shown in NGC 6752 ([Pasquini et al. (2005), Pasquini et al. 2005]). A similar correlation also appears in NGC 6397, but it is based only on the high sodium abundance of the three subgiants plotted as open triangles ([Lind et al. (2009), Lind et al. 2009]). A possible anticorrelation among the stars of 47 Tuc ([Bonifacio et al.(2007), Bonifacio et al. 2007]) is not convincing, as these stars may be subject to lithium depletion mechanisms due to their larger iron content (D’Orazi, these proceedings). In addition, according to [Pasquini et al. (2008)], two stars in NGC 6397 differ by 0.6dex in oxygen, but have “normal” (Li)2.2: this is certainly not easily compatible with a simple dilution model, and may require that the pollutors are also important lithium producers. In fact, if the AGB pollutors produce enough lithium, a dilution model must take it into account.
Notice that the dilution model is not so straightforward as we may think a priori: it will include a fraction of matter with pristine Li, plus a fraction (1-) having the Li of the ejecta (so, either the abundance of the AGB ejecta in the AGB mass range involved in the SG formation, or zero Li for the FRMS model). The dilution required to explain a given range in observed Li is different if we assign to the pristine Li the value (Li)=2.72 (see above), or the atmospheric Pop II value (2.2), or some intermediate value. In addition, if we are assuming that the uniform surface abundance of Li in Pop II is due to a depletion mechanism, also the abundance resulting from the dilution model must be decreased to take into account a similar depletion factor.
If we take our “standard mass loss” results of Fig. 6 at face value, ignoring the big question mark on mass loss, the yields can be used to predict the lithium expected in the SG, if the SG is a result of star formation from AGB ejecta diluted with pristine gas. The abundances will depend mainly on the mass range of the AGB progenitors: if the ejecta of masses in the range 4.5 – 6 are involved, their abundance is (Li)2, 0.7dex smaller than the Big Bang abundance. In order to explain the abundances observed in NGC 6397 or in NGC 6752, a dilution model including the ejecta of these AGB stars will require a percentage of pristine matter only slightly smaller than in a model including the lithium free FRMS, and we will not be able to discriminate between the two models. The case is different if the Big Bang abundance is “non standard” and closer to the observed halo stars average value.
A different interesting problem is posed by the GCs in which a “blue” main sequence (MS) has been revealed from precise HST photometry, namely Cen ([Bedin et al.(2004), Bedin et al. 2004]) and NGC 2808 ([D’Antona et al. (2005), D’Antona et al. 2005], [Piotto et al. (2007), Piotto et al. 2007]). The blue MS can only be interpreted as a very high helium MS (mass fraction Y0.38) ([Norris (2004), Norris 2004], [Piotto et al. (2005), Piotto et al. 2005]). Actually, in NGC 2808 three MS well separated each other in color are present ([Piotto et al. (2007), Piotto et al. 2007]), corresponding to three main helium content values, and in agreement with the predictions made from the distribution of stars in the very extended and multimodal horizontal branch (see, e.g. [D’Antona & Caloi (2004), D’Antona & Caloi 2004], [D’Antona et al. (2005), D’Antona et al. 2005]). [Pumo et al. (2008)] noticed that the helium abundances of super–AGB stars envelopes are within the small range 0.36Y0.38 ([Siess (2007), Siess 2007]) and [D’Ercole et al. (2008), D’Ercole et al. (2008)] have shown that a full chemo–hydrodynamical model of the cluster can provide a reasonable interpretation of the three MSs of NGC 2808, provided that the blue MS is formed directly by matter ejected from the super–AGB range, undiluted with pristine gas. In the future, spectroscopic observations of the blue MS in Cen and NGC 2808 will provide a falsification of this hypothesis, e.g. by means of the oxygen and sodium abundance revealed. In particular lithium can be an important test too, as it could provide an independent calibration of the mass loss rate in the super–AGB phase. Already some observations of the turnoff stars in Cen are available (Bonifacio, in this book), but it is not clear whether stars belonging to the blue MS have been observed. The “standard mass–loss” super–AGB models shown in Fig. 5 predict that lithium in these stars may become very large if some blue MS stars are formed from the ejecta of the upper mass range of super–AGB stars. We need observations of the blue MS to falsify this prediction.
We thank Corinne Charbonnel and the organizing committees for the invitation and for the successful and intense meeting. We are grateful to J. Meléndez and L. Sbordone for allowing us to use their data in advance of publication, and to V. D’Orazi and D. Romano for useful information.
References
- [Arnould & Norgaard(1975)] Arnould, M., & Norgaard, H. 1975, A&A, 42, 55
- [Bedin et al.(2004)] Bedin, L. R., Piotto, G., Anderson, J., Cassisi, S., King, I. R., Momany, Y., Carraro, G. 2004, ApJ, 605, L125
- [Blöcker(1995)] Blöcker, T. 1995, A&A, 297, 727
- [Boffin et al. (1993)] Boffin, H. M. J., Paulus, G., Arnould, M., & Mowlavi, N. 1993, A&A, 279, 173
- [Bonifacio et al.(2007)] Bonifacio, P., et al. 2007, A&A, 470, 153
- [Cameron & Fowler (1971)] Cameron, A. G. W., & Fowler, W. A. 1971, ApJ, 164, 111
- [Carretta et al.(2009a)] Carretta, E., et al. 2009a, A&A, 505, 117
- [Carretta et al.(2009b)] Carretta, E., Bragaglia, A., Gratton, R., & Lucatello, S. 2009b, A&A, 505, 139
- [Carretta et al. (2009c)] Carretta, E., Bragaglia, A., Gratton, R., D’Orazi, V., & Lucatello, S. 2009c, arXiv:0910.0675
- [Cyburt et al.(2009)] Cyburt, R. H., Ellis, J., Fields, B. D., Luo, F., Olive, K. A., & Spanos, V. C. 2009, Journal of Cosmology and Astro-Particle Physics, 10, 21
- D’Antona & Caloi (2004) D’Antona F., Caloi V., 2004, ApJ, 611, 871
- D’Antona et al. (2005) D’Antona, F., Bellazzini, M., Caloi, V., Pecci, F. F., Galleti, S., & Rood, R. T. 2005b, ApJ, 631, 868
- D’Antona & Mazzitelli (1982) D’Antona, F., & Mazzitelli, I. 1982, ApJ, 260, 722
- D’Antona & Matteucci (1991) D’Antona, F., & Matteucci, F. 1991, A&A, 248, 62
- D’Antona & Ventura (2007) D’Antona, F., & Ventura, P. 2007, MNRAS, 379, 1431
- Decressin et al. (2007a) Decressin, T., Meynet, G., Charbonnel, C., Prantzos, N., & Ekström, S. 2007a, A&A, 464, 1029
- Decressin et al. (2007b) Decressin, T., Charbonnel, C., & Meynet, G. 2007b, A&A, 475, 859
- D’Ercole et al. (2008) D’Ercole, A., Vesperini, E., D’Antona, F., McMillan, S. L. W., & Recchi, S. 2008, MNRAS, 391, 825
- de Mink et al. (2009) de Mink, S. E., Pols, O. R., Langer, N., & Izzard, R. G. 2009, A&A, 507, L1
- García-Hernández et al. (2007) García-Hernández, D. A., García-Lario, P., Plez, B., Manchado, A., D’Antona, F., Lub, J., & Habing, H. 2007, A&A, 462, 711
- Gratton et al. (2004) Gratton, R., Sneden, C., & Carretta, E. 2004, ARA&A, 42, 385
- Hernanz et al. (1996) Hernanz, M., Jose, J., Coc, A., & Isern, J. 1996, ApJ Letters, 465, L27
- Iben (1973) Iben, I. J. 1973, ApJ, 185, 209
- Jose & Hernanz (1998) Jose, J., & Hernanz, M. 1998, ApJ, 494, 680
- Lind et al. (2009) Lind, K., Primas, F., Charbonnel, C., Grundahl, F., & Asplund, M. 2009, A&A, 503, 545
- Meléndez et al. (2009) Melèndez, J., Casagrande, L., Ramìrez, I., & Asplund, M., submitted
- Nollett et al. (2003) Nollett, K. M., Busso, M., & Wasserburg, G. J. 2003, ApJ, 582, 1036
- Norris (2004) Norris, J. E. 2004, ApJ Letters, 612, L25
- Pasquini et al. (2005) Pasquini, L., Bonifacio, P., Molaro, P., Francois, P., Spite, F., Gratton, R. G., Carretta, E., & Wolff, B. 2005, A &A, 441, 549
- Pasquini et al. (2008) Pasquini, L., Ecuvillon, A., Bonifacio, P., & Wolff, B. 2008, A&A, 489, 315
- Piotto et al. (2005) Piotto, G., et al. 2005, ApJ, 621, 777
- Piotto et al. (2007) Piotto, G., et al. 2007, ApJ Letters, 661, L53
- Prantzos & Charbonnel (2006) Prantzos, N., & Charbonnel, C. 2006, A&A, 458, 135
- Prantzos et al. (2007) Prantzos, N., Charbonnel, C., & Iliadis, C. 2007, A&A, 470, 179
- Pumo et al. (2008) Pumo, M. L., D’Antona, F., & Ventura, P. 2008, ApJ Letters, 672, L25
- Reimers (1977) Reimers, D. 1977, A&A, 61, 217
- Romano et al. (1999) Romano, D., Matteucci, F., Molaro, P., & Bonifacio, P. 1999, A&A, 352, 117 & D’Antona, F. 2001, A&A, 374, 646
- Sackmann & Boothroyd (1999) Sackmann, I.-J., & Boothroyd, A. I. 1999, ApJ, 510, 217
- Sackmann et al. (1974) Sackmann, I.-J., Smith, R. L., & Despain, K. H. 1974, ApJ, 187, 555
- Siess (2007) Siess, L. 2007, A&A, 476, 893
- Sbordone et al. (2009) Sbordone et al. 2009 A&A submitted
- Scalo et al. (1975) Scalo, J. M., Despain, K. H., & Ulrich, R. K. 1975, ApJ, 196, 805
- Schatzman (1951) Schatzman, E. 1951, Annales d’Astrophysique, 14, 294
- Smith & Lambert (1989) Smith, V. V., & Lambert, D. L. 1989, ApJ Letters, 345, L75
- Smith & Lambert (1990) Smith, V. V., & Lambert, D. L. 1990, ApJ Letters, 361, L69
- Smith et al. (1995) Smith, V. V., Plez, B., Lambert, D. L., & Lubowich, D. A. 1995, ApJ, 441, 735
- Starrfield et al. (1978) Starrfield, S., Truran, J. W., Sparks, W. M., & Arnould, M. 1978, ApJ, 222, 600
- Vassiliadis & Wood (1993) Vassiliadis, E., & Wood, P. R. 1993, ApJ, 413, 641
- Ventura et al. (2000) Ventura, P., D’Antona, F., & Mazzitelli, I. 2000, A&A, 363, 605
- (40) Ventura, P., D’Antona, F., Mazzitelli, I., & Gratton, R. 2001, ApJ Letters, 550, L65
- Ventura et al. (2002) Ventura, P., D’Antona, F., & Mazzitelli, I. 2002, A&A, 393, 215
- Ventura & D’Antona (2005) Ventura, P., & D’Antona, F. 2005, A&A, 431, 279
- Ventura & D’Antona (2010) Ventura, P., & D’Antona, F. 2010, MNRAS Letters, in press
- Wasserburg et al. (1995) Wasserburg, G. J., Boothroyd, A. I., & Sackmann, I.-J. 1995, ApJ Letters, 447, L37